Technical Architect Jobs in England

Technical Architect
UK > England

The median Technical Architect salary in England is £82,500 per year according to job vacancies posted during the 6 months to 10 May 2024.

The first table below provides salary benchmarking and summary statistics including a comparison to same period in the previous 2 years.

6 months to
10 May 2024
Same period 2023 Same period 2022
Rank 404 393 607
Rank change year-on-year -11 +214 -99
Permanent jobs requiring a Technical Architect 496 715 642
As % of all permanent jobs advertised in England 0.58% 0.79% 0.48%
As % of the Job Titles category 0.61% 0.87% 0.50%
Number of salaries quoted 330 333 387
10th Percentile £58,375 £62,300 £53,418
25th Percentile £65,000 £73,750 £67,500
Median annual salary (50th Percentile) £82,500 £85,000 £80,000
Median % change year-on-year -2.94% +6.25% +3.23%
75th Percentile £93,750 £95,000 £95,000
90th Percentile £97,500 £102,500 £112,500
UK median annual salary £77,500 £85,000 £80,000
% change year-on-year -8.82% +6.25% +6.67%

All Permanent IT Job Vacancies
England

The following table is for comparison with the above and includes summary statistics for all permanent IT job vacancies advertised in England. Most job vacancies include a discernible job title that can be normalized. As such, the figures in the second row provide an indication of the number of permanent jobs in our overall sample.

Permanent vacancies in England with a recognized job title 81,130 82,270 127,705
% of permanent jobs with a recognized job title 94.48% 91.46% 96.08%
Number of salaries quoted 60,549 52,263 74,733
10th Percentile £28,500 £32,500 £32,500
25th Percentile £38,250 £45,000 £43,000
Median annual salary (50th Percentile) £53,500 £60,800 £60,000
Median % change year-on-year -12.01% +1.33% +9.09%
75th Percentile £71,500 £82,500 £80,000
90th Percentile £90,857 £100,000 £97,500
UK median annual salary £52,500 £60,000 £60,000
% change year-on-year -12.50% - +9.09%

Technical Architect
Job Vacancy Trend in England

Job postings that featured Technical Architect in the job title as a proportion of all IT jobs advertised in England.
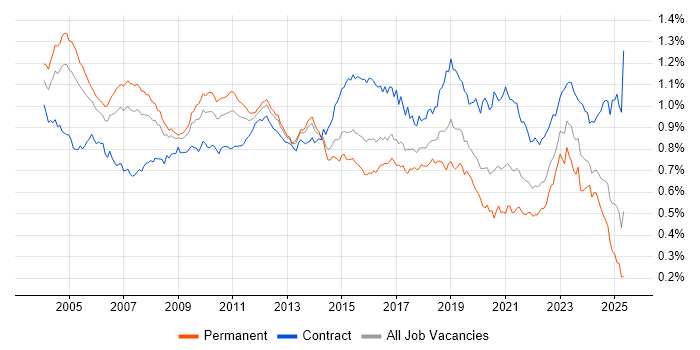
Job vacancy trend for Technical Architect in England

Technical Architect
Salary Trend in England

3-month moving average salary quoted in jobs citing Technical Architect in England.

Salary trend for Technical Architect in England

Technical Architect
Salary Histogram in England

Salary distribution for jobs citing Technical Architect in England over the 6 months to 10 May 2024.

Salary histogram for Technical Architect in England

Technical Architect
Job Locations in England

The table below looks at the demand and provides a guide to the median salaries quoted in IT jobs citing Technical Architect within the England region over the 6 months to 10 May 2024. The 'Rank Change' column provides an indication of the change in demand within each location based on the same 6 month period last year.

Location Rank Change
on Same Period
Last Year
Matching
Permanent
IT Job Ads
Median Salary
Past 6 Months
Median Salary
% Change
on Same Period
Last Year
Live
Jobs
London +15 192 £85,000 - 36
North of England +7 80 £70,000 -15.15% 8
South West -25 68 £80,000 +4.92% 8
South East +15 57 £90,000 +2.86% 14
East of England +12 55 £85,000 - 7
Yorkshire +80 39 £70,000 -17.65% 2
North West -28 37 £76,450 +22.32% 5
Midlands -37 37 £65,050 -13.27% 9
West Midlands -10 21 £75,000 - 4
East Midlands -28 16 £60,000 -31.43% 5
North East -11 4 £68,950 -27.42% 1
Technical Architect
UK

Technical Architect Skill Set
Top 30 Co-occurring Skills and Capabilities in England

For the 6 months to 10 May 2024, Technical Architect job roles required the following skills and capabilities in order of popularity. The figures indicate the absolute number co-occurrences and as a proportion of all permanent job ads across the England region featuring Technical Architect in the job title.

1 151 (30.44%) Social Skills
2 144 (29.03%) Azure
3 134 (27.02%) Microsoft
4 124 (25.00%) Agile
5 118 (23.79%) Security Cleared
6 111 (22.38%) Roadmaps
7 98 (19.76%) DevOps
8 95 (19.15%) Problem-Solving
9 88 (17.74%) AWS
10 85 (17.14%) Degree
11 82 (16.53%) Technical Leadership
12 79 (15.93%) SC Cleared
13 67 (13.51%) C#
14 66 (13.31%) Mentoring
15 64 (12.90%) .NET
16 63 (12.70%) Linux
17 60 (12.10%) Finance
18 59 (11.90%) Microservices
19 56 (11.29%) Kubernetes
20 54 (10.89%) Cloud Native
20 54 (10.89%) Technical Architecture
20 54 (10.89%) Inclusion and Diversity
21 53 (10.69%) Java
22 50 (10.08%) Business Intelligence
23 49 (9.88%) Power Platform
24 46 (9.27%) Migration
24 46 (9.27%) Cybersecurity
25 45 (9.07%) Project Management
26 41 (8.27%) Management Information System
26 41 (8.27%) Computer Science

Technical Architect Skill Set
Co-occurring Skills and Capabilities in England by Category

The follow tables expand on the table above by listing co-occurrences grouped by category. The same employment type, locality and period is covered with up to 20 co-occurrences shown in each of the following categories:

Application Platforms
1 16 (3.23%) SharePoint
2 4 (0.81%) Drupal
2 4 (0.81%) Microsoft Exchange
3 2 (0.40%) Apache Airflow
3 2 (0.40%) Apache Spark
3 2 (0.40%) CMS
3 2 (0.40%) Confluence
3 2 (0.40%) NetWeaver
4 1 (0.20%) BizTalk Server
4 1 (0.20%) OpenStack
Applications
1 9 (1.81%) Microsoft Office
2 2 (0.40%) Microsoft Excel
2 2 (0.40%) Microsoft PowerPoint
2 2 (0.40%) Revit
Business Applications
1 17 (3.43%) Dynamics CRM
2 7 (1.41%) Elite 3E
2 7 (1.41%) Remedy ITSM
3 4 (0.81%) Sparx Enterprise Architect
4 2 (0.40%) Salesforce CRM
4 2 (0.40%) SAP ERP
5 1 (0.20%) Dynamics AX
Cloud Services
1 144 (29.03%) Azure
2 88 (17.74%) AWS
3 49 (9.88%) Power Platform
4 40 (8.06%) Dynamics 365
5 35 (7.06%) SaaS
6 33 (6.65%) Microsoft 365
7 31 (6.25%) PowerApps
8 21 (4.23%) Cloud Computing
8 21 (4.23%) Power Automate
9 20 (4.03%) GCP
10 15 (3.02%) Azure Service Bus
11 14 (2.82%) PaaS
12 12 (2.42%) Azure AKS
12 12 (2.42%) Azure App Service
13 10 (2.02%) IaaS
14 7 (1.41%) Azure Sentinel
15 6 (1.21%) dbt
15 6 (1.21%) Microsoft Purview
16 5 (1.01%) Entra ID
17 4 (0.81%) Serverless
Communications & Networking
1 16 (3.23%) Firewall
2 9 (1.81%) DNS
2 9 (1.81%) WAN
2 9 (1.81%) Wi-Fi
3 8 (1.61%) Wireless
4 5 (1.01%) Broadband
5 4 (0.81%) Intranet
5 4 (0.81%) LAN
5 4 (0.81%) Software-Defined Networking
6 3 (0.60%) CTI
6 3 (0.60%) Internet
6 3 (0.60%) VPN
7 2 (0.40%) Asterisk PBX
7 2 (0.40%) Extranet
7 2 (0.40%) PBX
7 2 (0.40%) RTP
7 2 (0.40%) SSL
7 2 (0.40%) Structured Cabling
7 2 (0.40%) VoIP
8 1 (0.20%) HSRP
Database & Business Intelligence
1 36 (7.26%) Power BI
2 33 (6.65%) Relational Database
3 25 (5.04%) SQL Server
4 10 (2.02%) Data Warehouse
5 9 (1.81%) Data Lake
6 7 (1.41%) MySQL
7 6 (1.21%) CockroachDB
7 6 (1.21%) RDBMS
8 5 (1.01%) Elasticsearch
9 4 (0.81%) Big Data
9 4 (0.81%) MongoDB
9 4 (0.81%) SQL Server Reporting Services
10 3 (0.60%) Data Vault
10 3 (0.60%) NoSQL
10 3 (0.60%) Snowflake Schema
10 3 (0.60%) SQL Server Analysis Services
10 3 (0.60%) SQL Server Integration Services
10 3 (0.60%) Star Schema
11 2 (0.40%) Hadoop
11 2 (0.40%) Redis
Development Applications
1 38 (7.66%) Git
2 26 (5.24%) Jenkins
3 11 (2.22%) GitLab
4 6 (1.21%) Sonatype Nexus
5 5 (1.01%) Jaeger
6 3 (0.60%) Cucumber
6 3 (0.60%) JIRA
6 3 (0.60%) JUnit
6 3 (0.60%) Maven
6 3 (0.60%) Team Foundation Server
6 3 (0.60%) Visual Studio
7 2 (0.40%) MLflow
7 2 (0.40%) PowerDesigner
General
1 151 (30.44%) Social Skills
2 60 (12.10%) Finance
3 54 (10.89%) Inclusion and Diversity
4 37 (7.46%) Public Sector
5 32 (6.45%) Analytical Skills
6 29 (5.85%) Retail
7 26 (5.24%) Banking
8 23 (4.64%) Aerospace
9 20 (4.03%) Legal
10 17 (3.43%) Law
10 17 (3.43%) Presentation Skills
11 15 (3.02%) Marketing
12 11 (2.22%) Influencing Skills
13 10 (2.02%) Financial Institution
14 8 (1.61%) Manufacturing
15 7 (1.41%) Pharmaceutical
16 6 (1.21%) Investment Banking
17 5 (1.01%) Corporate Banking
17 5 (1.01%) Local Government
17 5 (1.01%) Retail Banking
Libraries, Frameworks & Software Standards
1 64 (12.90%) .NET
2 24 (4.84%) React
2 24 (4.84%) REST
3 22 (4.44%) HTML
4 19 (3.83%) .NET Core
4 19 (3.83%) Web Services
5 18 (3.63%) Entity Framework
5 18 (3.63%) XML
6 16 (3.23%) JSON
7 15 (3.02%) ASP.NET
7 15 (3.02%) OAuth
7 15 (3.02%) RESTful
8 14 (2.82%) .NET Framework
9 12 (2.42%) ASP.NET Web API
10 11 (2.22%) Kafka
11 10 (2.02%) CSS
11 10 (2.02%) Hibernate
11 10 (2.02%) SOAP
11 10 (2.02%) Spring
12 9 (1.81%) Middleware
Miscellaneous
1 54 (10.89%) Cloud Native
2 41 (8.27%) Management Information System
3 25 (5.04%) PKI
4 23 (4.64%) Legacy Systems
5 20 (4.03%) Greenfield Project
6 19 (3.83%) Product Ownership
7 17 (3.43%) Public Cloud
8 13 (2.62%) Data Centre
9 12 (2.42%) Distributed Systems
10 11 (2.22%) Data Structures
10 11 (2.22%) Private Cloud
10 11 (2.22%) Virtual Team
11 10 (2.02%) Legacy Applications
12 8 (1.61%) PropTech
13 6 (1.21%) NHS
13 6 (1.21%) Robotics
13 6 (1.21%) Self-Motivation
14 5 (1.01%) Hybrid Cloud
14 5 (1.01%) Mobile App
15 4 (0.81%) PMI
Operating Systems
1 63 (12.70%) Linux
2 21 (4.23%) Android
2 21 (4.23%) Apple iOS
3 9 (1.81%) Windows
4 3 (0.60%) CentOS
5 2 (0.40%) Ubuntu
5 2 (0.40%) Unix
6 1 (0.20%) Red Hat Enterprise Linux
6 1 (0.20%) Windows Server
Processes & Methodologies
1 124 (25.00%) Agile
2 111 (22.38%) Roadmaps
3 98 (19.76%) DevOps
4 95 (19.15%) Problem-Solving
5 82 (16.53%) Technical Leadership
6 66 (13.31%) Mentoring
7 59 (11.90%) Microservices
8 54 (10.89%) Technical Architecture
9 50 (10.08%) Business Intelligence
10 46 (9.27%) Cybersecurity
10 46 (9.27%) Migration
11 45 (9.07%) Project Management
12 41 (8.27%) Architectural Design
12 41 (8.27%) Computer Science
13 39 (7.86%) Actionable Insight
14 38 (7.66%) Artificial Intelligence
15 36 (7.26%) Open Source
15 36 (7.26%) Project Delivery
16 34 (6.85%) Stakeholder Management
17 32 (6.45%) Continuous Improvement
Programming Languages
1 67 (13.51%) C#
2 53 (10.69%) Java
3 40 (8.06%) JavaScript
4 36 (7.26%) Python
5 23 (4.64%) C
6 17 (3.43%) SQL
7 8 (1.61%) T-SQL
8 7 (1.41%) Perl
9 6 (1.21%) Bash
9 6 (1.21%) PHP
9 6 (1.21%) PowerShell
10 5 (1.01%) C++
11 3 (0.60%) Apex Code
12 2 (0.40%) ABAP
12 2 (0.40%) Kotlin
12 2 (0.40%) Kusto Query Language
12 2 (0.40%) Swift
13 1 (0.20%) Shell Script
13 1 (0.20%) SOQL
Qualifications
1 118 (23.79%) Security Cleared
2 85 (17.14%) Degree
3 79 (15.93%) SC Cleared
4 36 (7.26%) Computer Science Degree
5 29 (5.85%) Microsoft Certification
6 14 (2.82%) Master's Degree
7 11 (2.22%) DV Cleared
8 9 (1.81%) Azure Certification
9 5 (1.01%) AWS Certification
9 5 (1.01%) Cisco Certification
9 5 (1.01%) TOGAF Certification
10 4 (0.81%) CCIE
10 4 (0.81%) CISSP
10 4 (0.81%) PMI Certification
10 4 (0.81%) VMware Certified Professional (VCP)
11 3 (0.60%) AWS Certified Solutions Architect
11 3 (0.60%) PhD
11 3 (0.60%) RIBA
12 1 (0.20%) CCSP
12 1 (0.20%) CISM
Quality Assurance & Compliance
1 9 (1.81%) ISO/IEC 27001
1 9 (1.81%) QA
2 6 (1.21%) Data Quality
3 5 (1.01%) GDPR
4 4 (0.81%) Cyber Essentials
5 2 (0.40%) ISO 9000
5 2 (0.40%) PCI DSS
6 1 (0.20%) NIST
System Software
1 32 (6.45%) Docker
2 8 (1.61%) Virtual Servers
3 7 (1.41%) Active Directory
3 7 (1.41%) VMware Infrastructure
4 2 (0.40%) Kamailio
4 2 (0.40%) KVM
5 1 (0.20%) Hyper-V
5 1 (0.20%) Virtual Machines
5 1 (0.20%) VMware ESXi
5 1 (0.20%) Xen
Systems Management
1 56 (11.29%) Kubernetes
2 15 (3.02%) Ansible
3 8 (1.61%) Puppet
4 5 (1.01%) Kiali
5 4 (0.81%) Single Sign-On
5 4 (0.81%) Terraform
6 3 (0.60%) Microsoft Intune
7 2 (0.40%) SCCM
8 1 (0.20%) FortiGate
8 1 (0.20%) Grafana
8 1 (0.20%) Kibana
8 1 (0.20%) logstash
8 1 (0.20%) Nagios
8 1 (0.20%) Prometheus
8 1 (0.20%) vCenter Server
8 1 (0.20%) vRealize
Vendors
1 134 (27.02%) Microsoft
2 28 (5.65%) ServiceNow
3 21 (4.23%) Salesforce
4 14 (2.82%) Google
5 11 (2.22%) Oracle
6 10 (2.02%) Cisco
7 9 (1.81%) BMC
8 8 (1.61%) SAP
9 7 (1.41%) HP
9 7 (1.41%) Remedy
9 7 (1.41%) VMware
10 6 (1.21%) Databricks
10 6 (1.21%) Red Hat
11 5 (1.01%) AppDynamics
11 5 (1.01%) Meraki
11 5 (1.01%) Splunk
12 4 (0.81%) ForgeRock
12 4 (0.81%) Palo Alto
12 4 (0.81%) Solace
12 4 (0.81%) Sparx