Data Warehouse Job Trends in England

Data Warehousing
UK > England

The table below provides summary statistics and salary benchmarking for jobs advertised in England requiring Data Warehouse skills. It covers permanent job vacancies from the 6 months leading up to 24 November 2025, with comparisons to the same periods in the previous two years.

6 months to
24 Nov 2025
Same period 2024 Same period 2023
Rank 190 144 121
Rank change year-on-year -46 -23 -1
Permanent jobs citing Data Warehouse 659 1,110 1,261
As % of all permanent jobs in England 1.43% 1.83% 2.73%
As % of the Database & Business Intelligence category 10.79% 11.14% 12.73%
Number of salaries quoted 405 610 970
10th Percentile £45,300 £42,500 £41,363
25th Percentile £55,000 £51,250 £47,500
Median annual salary (50th Percentile) £67,500 £67,500 £63,048
Median % change year-on-year - +7.06% -3.00%
75th Percentile £85,250 £87,500 £81,250
90th Percentile £105,000 £105,000 £97,500
UK median annual salary £67,500 £67,500 £62,500
% change year-on-year - +8.00% -3.85%

All Database and Business Intelligence Skills
England

Data Warehouse falls under the Databases and Business Intelligence category. For comparison with the information above, the following table provides summary statistics for all permanent job vacancies requiring database or business intelligence skills in England.

Permanent vacancies with a requirement for database or business intelligence skills 6,106 9,963 9,907
As % of all permanent jobs advertised in England 13.22% 16.45% 21.41%
Number of salaries quoted 4,103 5,751 7,789
10th Percentile £34,250 £38,750 £37,500
25th Percentile £42,500 £47,500 £47,500
Median annual salary (50th Percentile) £60,000 £65,000 £61,500
Median % change year-on-year -7.69% +5.69% -1.60%
75th Percentile £80,000 £87,500 £80,000
90th Percentile £105,000 £115,000 £96,539
UK median annual salary £60,000 £65,000 £60,000
% change year-on-year -7.69% +8.33% -4.00%

Data Warehouse
Job Vacancy Trend in England

Historical trend showing the proportion of permanent IT job postings citing Data Warehouse relative to all permanent IT jobs advertised in England.
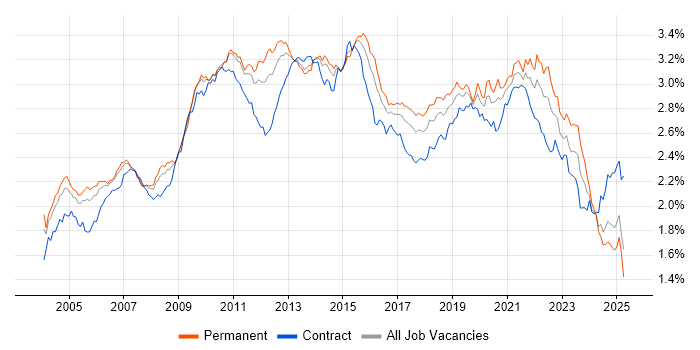
Data Warehouse job vacancy trend in England

Data Warehouse
Salary Trend in England

Salary distribution trend for jobs in England citing Data Warehouse.

Salary distribution trend for jobs in England citing Data Warehouse

Data Warehouse
Salary Histogram in England

Salary distribution for jobs citing Data Warehouse in England over the 6 months to 24 November 2025.

Salary histogram for Data Warehouse in England

Data Warehouse
Job Locations in England

The table below looks at the demand and provides a guide to the median salaries quoted in IT jobs citing Data Warehouse within the England region over the 6 months to 24 November 2025. The 'Rank Change' column provides an indication of the change in demand within each location based on the same 6 month period last year.

Location Rank Change
on Same Period
Last Year
Matching
Permanent
IT Job Ads
Median Salary
Past 6 Months
Median Salary
% Change
on Same Period
Last Year
Live
Jobs
London -3 347 £82,500 +10.00% 116
South East -66 97 £63,000 +9.57% 88
North of England -21 91 £60,000 +9.09% 32
Midlands +43 68 £67,500 +3.85% 40
West Midlands +36 52 £65,000 - 30
North West +4 50 £60,000 +9.09% 22
Yorkshire -2 35 £60,000 +4.35% 7
East of England +37 26 £50,000 - 17
South West -3 23 £64,350 -8.07% 20
East Midlands +28 16 £67,500 +3.85% 10
North East +15 6 £67,500 +3.45% 3
Data Warehouse
UK

Data Warehouse
Co-Occurring Skills & Capabilities in England by Category

The following tables expand on the one above by listing co-occurrences grouped by category. They cover the same employment type, locality and period, with up to 20 co-occurrences shown in each category:

Application Platforms
1 66 (10.02%) Apache Spark
2 27 (4.10%) Apache
3 20 (3.03%) Apache Airflow
4 13 (1.97%) SharePoint
5 7 (1.06%) SAS
6 6 (0.91%) Confluence
7 2 (0.30%) Skype for Business
8 1 (0.15%) ArcGIS
8 1 (0.15%) Microsoft Exchange
Applications
1 35 (5.31%) Microsoft Excel
2 15 (2.28%) Maya
3 8 (1.21%) Microsoft Office
4 4 (0.61%) Microsoft PowerPoint
5 3 (0.46%) MS Visio
6 2 (0.30%) Spreadsheet
Business Applications
1 30 (4.55%) SAP S/4HANA
2 8 (1.21%) SAP IBP
3 7 (1.06%) Dynamics CRM
4 3 (0.46%) Markit EDM
5 2 (0.30%) Payment Gateway
6 1 (0.15%) Aladdin
6 1 (0.15%) Cognos Business Intelligence
6 1 (0.15%) Dynamics AX
6 1 (0.15%) Dynamics NAV
6 1 (0.15%) Elite 3E
6 1 (0.15%) Maximo
6 1 (0.15%) Oracle EBS
6 1 (0.15%) SAP Business One
6 1 (0.15%) SAP ERP
6 1 (0.15%) SimCorp Dimension
Cloud Services
1 356 (54.02%) Azure
2 209 (31.71%) AWS
3 186 (28.22%) Power Platform
4 118 (17.91%) Snowflake
5 107 (16.24%) GCP
6 77 (11.68%) Azure Data Factory
7 61 (9.26%) Azure Synapse Analytics
8 53 (8.04%) SaaS
9 49 (7.44%) dbt
9 49 (7.44%) Serverless
10 47 (7.13%) AWS Lambda
11 45 (6.83%) Amazon S3
12 36 (5.46%) Azure DevOps
13 28 (4.25%) GitHub
14 20 (3.03%) Fivetran
15 18 (2.73%) AWS Step Functions
16 16 (2.43%) AWS CloudFormation
17 15 (2.28%) Azure Cosmos DB
18 14 (2.12%) Amazon EMR
19 13 (1.97%) Amazon Kinesis
Communications & Networking
1 7 (1.06%) Network Security
2 3 (0.46%) Broadband
3 2 (0.30%) Kerberos
3 2 (0.30%) PuTTY
3 2 (0.30%) Skype
4 1 (0.15%) SMS
Database & Business Intelligence
1 179 (27.16%) Power BI
2 131 (19.88%) Data Lake
3 99 (15.02%) SQL Server
4 66 (10.02%) Amazon Redshift
5 63 (9.56%) Metadata
6 55 (8.35%) Big Data
7 54 (8.19%) SQL Server Integration Services
8 48 (7.28%) NoSQL
8 48 (7.28%) Tableau
9 42 (6.37%) Hadoop
10 41 (6.22%) Azure SQL Database
11 40 (6.07%) SQL Server Reporting Services
12 35 (5.31%) PostgreSQL
13 34 (5.16%) Relational Database
14 32 (4.86%) MySQL
14 32 (4.86%) SQL Server Analysis Services
15 30 (4.55%) Azure SQL Data Warehouse
16 27 (4.10%) DynamoDB
17 25 (3.79%) Data Mining
18 24 (3.64%) Data Vault
Development Applications
1 41 (6.22%) Git
2 18 (2.73%) JIRA
3 11 (1.67%) ER Studio
4 7 (1.06%) ERwin
4 7 (1.06%) PowerDesigner
5 5 (0.76%) git-flow
5 5 (0.76%) Jenkins
6 4 (0.61%) Selenium
6 4 (0.61%) SQL Server Management Studio (SSMS)
7 3 (0.46%) Visual Studio
8 2 (0.30%) Bitbucket
8 2 (0.30%) JMeter
8 2 (0.30%) LoadRunner
8 2 (0.30%) REST Assured
8 2 (0.30%) Subversion
8 2 (0.30%) TestRail
9 1 (0.15%) JUnit
9 1 (0.15%) SonarQube
9 1 (0.15%) TestComplete
General
1 233 (35.36%) Social Skills
2 194 (29.44%) Finance
3 131 (19.88%) Analytical Skills
4 88 (13.35%) Law
5 64 (9.71%) Marketing
6 55 (8.35%) Retail
7 30 (4.55%) Banking
8 25 (3.79%) Legal
8 25 (3.79%) Public Sector
9 21 (3.19%) Inclusion and Diversity
10 17 (2.58%) Manufacturing
11 16 (2.43%) Games
12 14 (2.12%) Influencing Skills
13 13 (1.97%) Automotive
13 13 (1.97%) Financial Institution
14 12 (1.82%) Front Office
15 8 (1.21%) Telecoms
16 7 (1.06%) Local Government
17 5 (0.76%) Documentation Skills
17 5 (0.76%) Tech for Good
Job Titles
1 223 (33.84%) Data Engineer
2 189 (28.68%) Senior
3 144 (21.85%) Architect
4 118 (17.91%) Data Architect
5 108 (16.39%) Senior Data Engineer
6 85 (12.90%) Developer
7 68 (10.32%) Lead
8 58 (8.80%) Analyst
9 48 (7.28%) Azure Engineer
10 47 (7.13%) Azure Data Engineer
11 36 (5.46%) Senior Architect
12 27 (4.10%) Senior Data Architect
13 25 (3.79%) Business Intelligence Developer
13 25 (3.79%) Data Warehouse Developer
14 21 (3.19%) Data Analyst
14 21 (3.19%) Lead Data Engineer
15 19 (2.88%) AWS Engineer
15 19 (2.88%) Azure Architect
16 18 (2.73%) AWS Data Engineer
16 18 (2.73%) Full-Stack Developer
Libraries, Frameworks & Software Standards
1 59 (8.95%) Kafka
2 33 (5.01%) PySpark
3 14 (2.12%) XML
4 13 (1.97%) AngularJS
4 13 (1.97%) GraphQL
4 13 (1.97%) REST
5 12 (1.82%) Spring
6 11 (1.67%) Pandas
7 10 (1.52%) .NET
7 10 (1.52%) JSON
7 10 (1.52%) Middleware
8 9 (1.37%) CSS
9 8 (1.21%) boto
9 8 (1.21%) HTML
9 8 (1.21%) Material-UI
9 8 (1.21%) React
9 8 (1.21%) Spark Streaming
10 7 (1.06%) AWS CDK
11 6 (0.91%) NumPy
11 6 (0.91%) scikit-learn
Miscellaneous
1 47 (7.13%) Management Information System
2 39 (5.92%) Product Ownership
3 26 (3.95%) Cloud Native
4 21 (3.19%) Distributed Systems
5 19 (2.88%) Data Structures
5 19 (2.88%) Enterprise Software
6 17 (2.58%) Reinsurance
7 15 (2.28%) Reference Data
8 14 (2.12%) FMCG
8 14 (2.12%) Greenfield Project
9 12 (1.82%) Analytical Mindset
9 12 (1.82%) Self-Motivation
10 11 (1.67%) Hedge funds
11 10 (1.52%) Legacy Systems
12 9 (1.37%) NHS
13 8 (1.21%) e-Learning
13 8 (1.21%) Hybrid Cloud
13 8 (1.21%) Low-Code
13 8 (1.21%) PMI
14 7 (1.06%) Tandem
Operating Systems
1 5 (0.76%) Unix
2 4 (0.61%) Linux
3 3 (0.46%) Android
3 3 (0.46%) Apple iOS
4 1 (0.15%) Windows
Processes & Methodologies
1 370 (56.15%) Data Modelling
2 340 (51.59%) ETL
3 297 (45.07%) Analytics
4 273 (41.43%) Business Intelligence
5 265 (40.21%) Data Engineering
6 209 (31.71%) Data Pipeline
7 181 (27.47%) Data Governance
8 158 (23.98%) Agile
9 149 (22.61%) Data Architecture
10 140 (21.24%) Data Integration
11 137 (20.79%) CI/CD
12 133 (20.18%) Problem-Solving
13 132 (20.03%) AI
14 130 (19.73%) Decision-Making
15 128 (19.42%) Mentoring
16 127 (19.27%) Data Management
17 120 (18.21%) Data Science
17 120 (18.21%) DevOps
18 99 (15.02%) Machine Learning
19 91 (13.81%) Roadmaps
Programming Languages
1 405 (61.46%) SQL
2 292 (44.31%) Python
3 54 (8.19%) Java
4 39 (5.92%) Data Analysis Expressions
5 33 (5.01%) Scala
6 30 (4.55%) T-SQL
7 24 (3.64%) C#
8 15 (2.28%) PowerShell
9 12 (1.82%) R
10 7 (1.06%) PL/SQL
11 6 (0.91%) TypeScript
12 5 (0.76%) Fortran
12 5 (0.76%) JavaScript
13 4 (0.61%) Bash
14 3 (0.46%) Kotlin
14 3 (0.46%) Swift
15 2 (0.30%) PROC SQL
16 1 (0.15%) ANSI SQL
Qualifications
1 65 (9.86%) Degree
2 36 (5.46%) Computer Science Degree
3 21 (3.19%) AWS Certification
4 18 (2.73%) Azure Certification
5 17 (2.58%) Microsoft Certification
6 14 (2.12%) Master's Degree
7 12 (1.82%) PMI Certification
8 9 (1.37%) Security Cleared
8 9 (1.37%) SnowPro
8 9 (1.37%) TOGAF Certification
9 7 (1.06%) DBS Check
9 7 (1.06%) SC Cleared
10 5 (0.76%) AWS Certified Solutions Architect
10 5 (0.76%) SAP Certification
11 4 (0.61%) MCSE
11 4 (0.61%) PMP
12 3 (0.46%) AWS Certified Developer
13 2 (0.30%) HNC
13 2 (0.30%) MCSA
13 2 (0.30%) Tableau Certification
Quality Assurance & Compliance
1 144 (21.85%) Data Quality
2 52 (7.89%) GDPR
3 51 (7.74%) Accessibility
4 33 (5.01%) QA
5 7 (1.06%) ISO/IEC 27001
6 6 (0.91%) California Consumer Privacy Act
7 2 (0.30%) HIPAA
7 2 (0.30%) SEPA
8 1 (0.15%) CDISC
8 1 (0.15%) Cyber Essentials
8 1 (0.15%) DICOM
8 1 (0.15%) GAAP
8 1 (0.15%) HL7
8 1 (0.15%) IASME
8 1 (0.15%) PERC
8 1 (0.15%) Sarbanes-Oxley
8 1 (0.15%) SLA
8 1 (0.15%) SNOMED CT
8 1 (0.15%) SOC 2
System Software
1 30 (4.55%) Docker
2 11 (1.67%) HDFS
3 6 (0.91%) Active Directory
4 2 (0.30%) Apache Flume
4 2 (0.30%) Firmware
5 1 (0.15%) Hyper-V
5 1 (0.15%) VMware Infrastructure
Systems Management
1 28 (4.25%) Terraform
2 12 (1.82%) Kubernetes
3 2 (0.30%) Kibana
3 2 (0.30%) logstash
3 2 (0.30%) Microsoft Intune
3 2 (0.30%) Oozie
4 1 (0.15%) Ansible
4 1 (0.15%) Control-M
Vendors
1 157 (23.82%) Microsoft
2 144 (21.85%) Databricks
3 43 (6.53%) SAP
4 34 (5.16%) Oracle
5 30 (4.55%) Google
6 24 (3.64%) Informatica
7 18 (2.73%) Salesforce
8 14 (2.12%) Talend
9 10 (1.52%) Dataiku
10 9 (1.37%) Ariba
10 9 (1.37%) ServiceNow
11 8 (1.21%) IBM
12 7 (1.06%) Alteryx
12 7 (1.06%) Dell
13 6 (0.91%) Splunk
14 5 (0.76%) OpenAI
15 4 (0.61%) CrowdStrike
15 4 (0.61%) MuleSoft
15 4 (0.61%) Palo Alto
15 4 (0.61%) Zoho