Big Data Jobs in England

Big Data
UK > England

The table below provides summary statistics for permanent job vacancies advertised in England requiring Big Data skills. It includes a benchmarking guide to the annual salaries offered in vacancies that cited Big Data over the 6 months leading up to 26 July 2024, comparing them to the same period in the previous two years.

6 months to
26 Jul 2024
Same period 2023 Same period 2022
Rank 362 167 126
Rank change year-on-year -195 -41 +1
Permanent jobs citing Big Data 547 1,535 4,683
As % of all permanent jobs advertised in England 0.70% 2.16% 3.19%
As % of the Database & Business Intelligence category 4.38% 10.28% 11.71%
Number of salaries quoted 369 810 1,836
10th Percentile £51,250 £52,500 £47,369
25th Percentile £58,750 £63,750 £62,500
Median annual salary (50th Percentile) £85,000 £70,000 £80,000
Median % change year-on-year +21.43% -12.50% +14.29%
75th Percentile £117,500 £92,688 £95,000
90th Percentile £140,000 £110,000 £110,000
UK median annual salary £80,000 £70,000 £80,000
% change year-on-year +14.29% -12.50% +14.29%

All Database and Business Intelligence Skills
England

Big Data falls under the Databases and Business Intelligence category. For comparison with the information above, the following table provides summary statistics for all permanent job vacancies requiring database or business intelligence skills in England.

Permanent vacancies with a requirement for database or business intelligence skills 12,495 14,926 39,989
As % of all permanent jobs advertised in England 15.95% 21.00% 27.20%
Number of salaries quoted 8,650 10,674 19,065
10th Percentile £36,250 £37,500 £36,250
25th Percentile £45,000 £47,500 £45,491
Median annual salary (50th Percentile) £60,000 £65,000 £60,000
Median % change year-on-year -7.69% +8.33% +9.09%
75th Percentile £84,188 £82,500 £81,250
90th Percentile £112,500 £100,000 £97,500
UK median annual salary £60,000 £62,500 £60,000
% change year-on-year -4.00% +4.17% +9.09%

Big Data
Job Vacancy Trend in England

Job postings citing Big Data as a proportion of all IT jobs advertised in England.
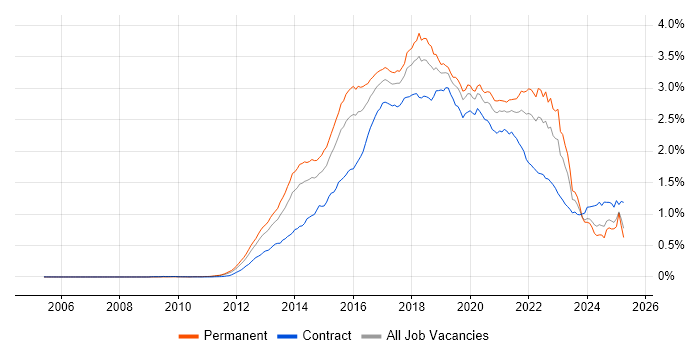
Job vacancy trend for Big Data in England

Big Data
Salary Trend in England

3-month moving average salary quoted in jobs citing Big Data in England.

Salary trend for Big Data in England

Big Data
Salary Histogram in England

Salary distribution for jobs citing Big Data in England over the 6 months to 26 July 2024.

Salary histogram for Big Data in England

Big Data
Job Locations in England

The table below looks at the demand and provides a guide to the median salaries quoted in IT jobs citing Big Data within the England region over the 6 months to 26 July 2024. The 'Rank Change' column provides an indication of the change in demand within each location based on the same 6 month period last year.

Location Rank Change
on Same Period
Last Year
Matching
Permanent
IT Job Ads
Median Salary
Past 6 Months
Median Salary
% Change
on Same Period
Last Year
Live
Jobs
London -84 275 £105,000 +30.77% 39
South West -27 97 £80,000 +14.29% 14
South East -116 63 £54,500 -22.14% 18
North of England -183 62 £56,509 -19.27% 7
North West -134 50 £58,254 -16.78% 2
Midlands -110 32 £62,500 -3.85% 8
West Midlands -73 22 £62,500 -3.85% 7
East of England -33 17 £80,000 +22.14% 1
East Midlands -50 10 £52,000 -30.67% 1
North East -13 9 £42,500 -36.80% 3
Yorkshire -56 3 £55,000 -21.43% 2
Big Data
UK

Big Data
Co-occurring Skills and Capabilities in England by Category

The follow tables expand on the table above by listing co-occurrences grouped by category. The same employment type, locality and period is covered with up to 20 co-occurrences shown in each of the following categories:

Application Platforms
1 157 (28.70%) Apache Spark
2 121 (22.12%) Apache
3 94 (17.18%) Apache Airflow
4 17 (3.11%) nginx
5 16 (2.93%) Jupyter
6 15 (2.74%) SAS
7 7 (1.28%) Kinematics
8 5 (0.91%) Luigi
9 4 (0.73%) Apache Pig
9 4 (0.73%) Confluence
10 1 (0.18%) Apache Solr
10 1 (0.18%) CMS
Applications
1 23 (4.20%) Microsoft Excel
2 22 (4.02%) Microsoft Office
3 7 (1.28%) SPSS
4 6 (1.10%) Trello
5 2 (0.37%) Microsoft PowerPoint
6 1 (0.18%) Microsoft Project
6 1 (0.18%) MS Visio
6 1 (0.18%) Spreadsheet
Business Applications
1 3 (0.55%) Relativity
2 2 (0.37%) NEC Housing
2 2 (0.37%) Primavera
2 2 (0.37%) Sparx Enterprise Architect
2 2 (0.37%) Veritas eDiscovery
3 1 (0.18%) SAP Business One
Cloud Services
1 272 (49.73%) AWS
2 197 (36.01%) Azure
3 112 (20.48%) GCP
4 95 (17.37%) Power Platform
5 93 (17.00%) Snowflake
6 90 (16.45%) dbt
7 59 (10.79%) Serverless
8 52 (9.51%) OpenShift
9 41 (7.50%) AWS Lambda
10 40 (7.31%) Azure Synapse Analytics
11 35 (6.40%) Amazon S3
12 33 (6.03%) Amazon EKS
13 32 (5.85%) AWS CloudFormation
14 28 (5.12%) SaaS
15 27 (4.94%) Azure Data Factory
16 26 (4.75%) Amazon Kinesis
17 24 (4.39%) Azure DevOps
18 21 (3.84%) GitHub
19 20 (3.66%) Cloud Computing
20 16 (2.93%) MinIO
Communications & Networking
1 29 (5.30%) AMQP
2 13 (2.38%) Firewall
3 9 (1.65%) Internet
4 7 (1.28%) RFID
5 4 (0.73%) Modbus
5 4 (0.73%) SNMP
5 4 (0.73%) Wireless
6 2 (0.37%) 4G
6 2 (0.37%) Intrusion Detection
6 2 (0.37%) Network Security
6 2 (0.37%) RS-232
7 1 (0.18%) MQTT
Database & Business Intelligence
1 143 (26.14%) Data Lake
2 110 (20.11%) Hadoop
3 89 (16.27%) Data Warehouse
4 85 (15.54%) Power BI
5 82 (14.99%) Apache Arrow
5 82 (14.99%) Dremio
6 75 (13.71%) Amazon Athena
7 73 (13.35%) Tableau
8 55 (10.05%) NoSQL
9 44 (8.04%) Relational Database
10 38 (6.95%) Data Mining
11 33 (6.03%) Amazon Redshift
12 29 (5.30%) Cloudera CDH
13 28 (5.12%) PostgreSQL
14 27 (4.94%) BigQuery
15 25 (4.57%) MongoDB
16 20 (3.66%) Metadata
16 20 (3.66%) SQL Server Integration Services
17 19 (3.47%) SQL Server
18 17 (3.11%) Elasticsearch
Development Applications
1 48 (8.78%) Jenkins
2 47 (8.59%) Git
3 16 (2.93%) Atlassian Bamboo
4 15 (2.74%) JIRA
5 9 (1.65%) GitLab
5 9 (1.65%) MLflow
6 6 (1.10%) Visual Studio
7 5 (0.91%) Cucumber
7 5 (0.91%) JUnit
7 5 (0.91%) SonarQube
8 4 (0.73%) Octopus Deploy
9 3 (0.55%) Gatling
9 3 (0.55%) Selenium
9 3 (0.55%) Spinnaker
10 2 (0.37%) Checkstyle
10 2 (0.37%) CircleCI
10 2 (0.37%) Cypress.io
10 2 (0.37%) Oracle Forms
10 2 (0.37%) Subversion
10 2 (0.37%) Team Foundation Server
General
1 165 (30.16%) Social Skills
2 164 (29.98%) Finance
3 80 (14.63%) Analytical Skills
4 66 (12.07%) Banking
5 46 (8.41%) Aerospace
6 33 (6.03%) Investment Banking
7 29 (5.30%) Front Office
8 25 (4.57%) Presentation Skills
9 22 (4.02%) Inclusion and Diversity
10 17 (3.11%) Pharmaceutical
11 15 (2.74%) Marketing
12 14 (2.56%) Legal
13 13 (2.38%) Electronics
14 12 (2.19%) Retail
15 10 (1.83%) Law
16 6 (1.10%) Public Sector
17 5 (0.91%) Financial Institution
18 4 (0.73%) Automotive
18 4 (0.73%) Korean Language
18 4 (0.73%) Telecoms
Job Titles
1 120 (21.94%) Senior
2 87 (15.90%) Data Engineer
3 77 (14.08%) Big Data Engineer
4 71 (12.98%) Architect
5 62 (11.33%) AWS Engineer
6 59 (10.79%) Analyst
7 54 (9.87%) Site Engineer
7 54 (9.87%) Site Reliability Engineer
8 47 (8.59%) Software Engineer
9 39 (7.13%) DevOps Engineer
10 37 (6.76%) Data Architect
11 35 (6.40%) Developer
12 32 (5.85%) Lead
13 30 (5.48%) DV Cleared Software Engineer
14 24 (4.39%) Business Analyst
15 21 (3.84%) Data Scientist
15 21 (3.84%) Financial Analyst
16 20 (3.66%) Senior Data Engineer
17 17 (3.11%) Data Manager
17 17 (3.11%) Senior Architect
Libraries, Frameworks & Software Standards
1 90 (16.45%) gRPC
2 61 (11.15%) Kafka
3 54 (9.87%) Protocol Buffers
4 45 (8.23%) Node.js
4 45 (8.23%) RabbitMQ
5 42 (7.68%) React
6 39 (7.13%) PySpark
7 37 (6.76%) Spring
7 37 (6.76%) Spring Boot
8 35 (6.40%) REST
9 32 (5.85%) AngularJS
10 29 (5.30%) Material-UI
10 29 (5.30%) OpenAPI
10 29 (5.30%) Swagger
11 19 (3.47%) Pandas
12 18 (3.29%) Apache NiFi
13 17 (3.11%) .NET
13 17 (3.11%) ActiveMQ
13 17 (3.11%) Apache Beam
13 17 (3.11%) Elastic Stack
Miscellaneous
1 85 (15.54%) Hedge funds
2 55 (10.05%) Clustering
3 42 (7.68%) Algorithms
4 40 (7.31%) Cloud Native
4 40 (7.31%) Product Ownership
5 32 (5.85%) Onboarding
6 30 (5.48%) Fixed Income
7 29 (5.30%) Derivative
7 29 (5.30%) Equities
8 28 (5.12%) Foreign Exchange (FX)
9 27 (4.94%) Data Structures
10 22 (4.02%) Legacy Systems
11 20 (3.66%) IoT
12 19 (3.47%) Management Information System
13 18 (3.29%) Hybrid Cloud
14 13 (2.38%) Cyber Defence
15 12 (2.19%) Distributed Systems
16 11 (2.01%) Greenfield Project
16 11 (2.01%) Reinsurance
17 10 (1.83%) Data Centre
Operating Systems
1 89 (16.27%) Linux
2 35 (6.40%) CentOS
2 35 (6.40%) Red Hat Enterprise Linux
3 31 (5.67%) Debian
3 31 (5.67%) Ubuntu
4 8 (1.46%) Windows
5 4 (0.73%) Windows Server
6 2 (0.37%) FreeRTOS
6 2 (0.37%) Unix
7 1 (0.18%) Android
7 1 (0.18%) Apple iOS
Processes & Methodologies
1 203 (37.11%) DevOps
2 201 (36.75%) Analytics
3 196 (35.83%) Agile
4 130 (23.77%) Machine Learning
5 118 (21.57%) Data Science
6 111 (20.29%) Data Modelling
7 108 (19.74%) Data Engineering
7 108 (19.74%) ETL
8 104 (19.01%) CI/CD
9 102 (18.65%) Problem-Solving
10 100 (18.28%) Artificial Intelligence
11 98 (17.92%) Business Intelligence
12 96 (17.55%) Asset Management
13 94 (17.18%) Computer Science
14 84 (15.36%) Investment Management
15 81 (14.81%) Visualisation
16 78 (14.26%) Collaborative Working
17 74 (13.53%) Infrastructure as Code
17 74 (13.53%) Microservices
18 72 (13.16%) Data Pipeline
Programming Languages
1 329 (60.15%) Python
2 225 (41.13%) SQL
3 156 (28.52%) Java
4 103 (18.83%) JavaScript
5 65 (11.88%) Go
6 42 (7.68%) R
7 33 (6.03%) C#
8 29 (5.30%) Scala
9 24 (4.39%) Shell Script
10 21 (3.84%) Bash
11 17 (3.11%) T-SQL
12 16 (2.93%) C++
13 11 (2.01%) C
14 7 (1.28%) XAML
15 6 (1.10%) Ruby
15 6 (1.10%) TypeScript
16 5 (0.91%) PHP
16 5 (0.91%) PowerShell
17 4 (0.73%) Kotlin
17 4 (0.73%) Perl
Qualifications
1 165 (30.16%) Degree
2 101 (18.46%) Security Cleared
3 69 (12.61%) SC Cleared
4 64 (11.70%) Computer Science Degree
5 59 (10.79%) DV Cleared
6 58 (10.60%) Master's Degree
7 14 (2.56%) AWS Certification
8 11 (2.01%) DBS Check
8 11 (2.01%) PhD
9 8 (1.46%) CTC Cleared
10 6 (1.10%) Azure Certification
10 6 (1.10%) BPSS Clearance
10 6 (1.10%) IIBA
10 6 (1.10%) Microsoft Certification
10 6 (1.10%) PMI Certification
11 5 (0.91%) MBA
12 4 (0.73%) AWS Certified Solutions Architect
13 3 (0.55%) CISSP
14 2 (0.37%) CISA
14 2 (0.37%) CISM
Quality Assurance & Compliance
1 61 (11.15%) Data Quality
2 18 (3.29%) QA
3 16 (2.93%) GDPR
4 4 (0.73%) Accessibility
4 4 (0.73%) ISO/IEC 27001
5 2 (0.37%) SEPA
6 1 (0.18%) PMO
System Software
1 57 (10.42%) Docker
2 7 (1.28%) Firmware
2 7 (1.28%) HDFS
3 2 (0.37%) IAG
4 1 (0.18%) Apache Flume
4 1 (0.18%) KVM
4 1 (0.18%) Virtual Machines
4 1 (0.18%) VMware ESXi
4 1 (0.18%) VMware Infrastructure
Systems Management
1 151 (27.61%) Terraform
2 148 (27.06%) Kubernetes
3 74 (13.53%) Prometheus
4 71 (12.98%) Ansible
5 38 (6.95%) Puppet
6 24 (4.39%) Grafana
7 16 (2.93%) HAProxy
8 5 (0.91%) Nagios
9 4 (0.73%) Cacti
10 3 (0.55%) Podman
11 2 (0.37%) Kibana
11 2 (0.37%) Kubeflow
11 2 (0.37%) Kustomize
12 1 (0.18%) Apache Ranger
12 1 (0.18%) Hadoop YARN
12 1 (0.18%) HP ALM
12 1 (0.18%) logstash
12 1 (0.18%) Rancher
12 1 (0.18%) vCenter Server
12 1 (0.18%) vRealize
Vendors
1 90 (16.45%) Databricks
2 70 (12.80%) Microsoft
3 56 (10.24%) Google
4 29 (5.30%) Red Hat
4 29 (5.30%) SaltStack
5 10 (1.83%) SAP
6 9 (1.65%) MuleSoft
7 7 (1.28%) Cloudera
8 6 (1.10%) Oracle
9 5 (0.91%) Salesforce
9 5 (0.91%) Sparx
9 5 (0.91%) webMethods
10 4 (0.73%) Citrix
11 3 (0.55%) Atlassian
11 3 (0.55%) CA
11 3 (0.55%) Foundry
11 3 (0.55%) Hortonworks
11 3 (0.55%) Informatica
11 3 (0.55%) Palantir
11 3 (0.55%) Splunk