Senior Developer Jobs in England

Senior Developer
UK > England

The median Senior Developer salary in England is £65,000 per year, according to job vacancies posted during the 6 months leading to 13 June 2025.

The table below provides salary benchmarking and summary statistics, comparing them to the same period in the previous two years.

6 months to
13 Jun 2025
Same period 2024 Same period 2023
Rank 186 71 79
Rank change year-on-year -115 +8 -7
Permanent jobs requiring a Senior Developer 913 3,077 3,210
As % of all permanent jobs advertised in England 1.86% 3.22% 3.91%
As % of the Job Titles category 2.05% 3.40% 4.29%
Number of salaries quoted 650 2,533 2,281
10th Percentile £52,500 £46,250 £52,500
25th Percentile £56,250 £53,750 £60,000
Median annual salary (50th Percentile) £65,000 £65,000 £75,000
Median % change year-on-year - -13.33% +7.14%
75th Percentile £78,750 £80,000 £90,000
90th Percentile £88,875 £100,000 £110,000
UK median annual salary £65,000 £65,000 £72,500
% change year-on-year - -10.34% +3.57%

All Permanent IT Job Vacancies
England

For comparison with the information above, the following table provides summary statistics for all permanent IT job vacancies in England. Most job vacancies include a discernible job title that can be normalized. As such, the figures in the second row provide an indication of the number of permanent jobs in our overall sample.

Permanent vacancies in England with a recognized job title 44,586 90,433 74,853
% of permanent jobs with a recognized job title 90.60% 94.62% 91.20%
Number of salaries quoted 23,770 65,916 49,359
10th Percentile £28,500 £28,500 £32,500
25th Percentile £40,000 £38,500 £45,000
Median annual salary (50th Percentile) £55,000 £52,500 £60,567
Median % change year-on-year +4.76% -13.32% +0.95%
75th Percentile £74,014 £70,000 £81,250
90th Percentile £96,250 £90,000 £100,000
UK median annual salary £55,000 £52,500 £60,000
% change year-on-year +4.76% -12.50% -

Senior Developer
Job Vacancy Trend in England

Job postings that featured Senior Developer in the job title as a proportion of all IT jobs advertised in England.
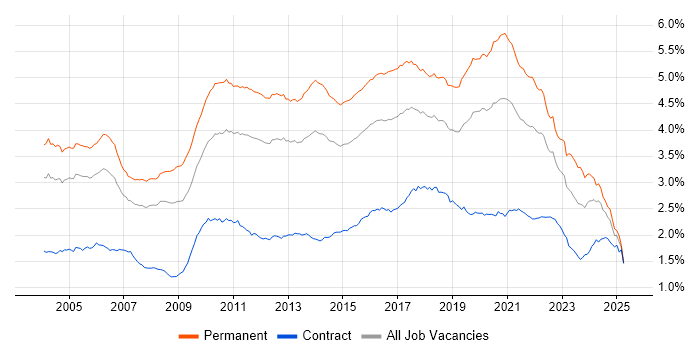
Job vacancy trend for Senior Developer in England

Senior Developer
Salary Trend in England

3-month moving average salary quoted in jobs citing Senior Developer in England.

Salary trend for Senior Developer in England

Senior Developer
Salary Histogram in England

Salary distribution for jobs citing Senior Developer in England over the 6 months to 13 June 2025.

Salary histogram for Senior Developer in England

Senior Developer
Job Locations in England

The table below looks at the demand and provides a guide to the median salaries quoted in IT jobs citing Senior Developer within the England region over the 6 months to 13 June 2025. The 'Rank Change' column provides an indication of the change in demand within each location based on the same 6 month period last year.

Location Rank Change
on Same Period
Last Year
Matching
Permanent
IT Job Ads
Median Salary
Past 6 Months
Median Salary
% Change
on Same Period
Last Year
Live
Jobs
London -36 401 £75,000 -6.25% 435
South East -79 172 £65,000 - 268
North of England -144 137 £60,000 - 175
North West -138 92 £60,000 - 119
Midlands -95 72 £57,500 -4.17% 98
South West -59 65 £60,000 +1.69% 62
West Midlands -57 55 £60,000 -4.00% 47
Yorkshire -68 35 £60,000 +9.09% 39
East of England -35 26 £65,000 +8.33% 51
East Midlands -54 17 £55,000 -4.35% 46
North East +16 10 £72,500 +31.82% 17
Senior Developer
UK

Senior Developer Skill Set
Top 30 Co-occurring Skills and Capabilities in England

For the 6 months to 13 June 2025, Senior Developer job roles required the following skills and capabilities in order of popularity. The figures indicate the absolute number co-occurrences and as a proportion of all permanent job ads across the England region featuring Senior Developer in the job title.

1 360 (39.43%) Agile
2 341 (37.35%) JavaScript
3 297 (32.53%) AWS
4 296 (32.42%) React
5 265 (29.03%) C#
6 250 (27.38%) .NET
6 250 (27.38%) TypeScript
7 244 (26.73%) Python
8 241 (26.40%) CI/CD
9 221 (24.21%) SQL
10 210 (23.00%) Azure
11 209 (22.89%) Finance
12 192 (21.03%) Social Skills
13 182 (19.93%) HTML
14 180 (19.72%) Mentoring
15 174 (19.06%) Serverless
16 161 (17.63%) Clean Code
17 154 (16.87%) DevOps
18 150 (16.43%) Problem-Solving
19 147 (16.10%) CSS
20 146 (15.99%) AWS Lambda
21 137 (15.01%) Git
22 136 (14.90%) Full-Stack Development
23 135 (14.79%) SQL Server
24 127 (13.91%) User Experience
25 120 (13.14%) DynamoDB
26 119 (13.03%) Continuous Integration
26 119 (13.03%) Software Engineering
27 114 (12.49%) Test Automation
27 114 (12.49%) GraphQL

Senior Developer Skill Set
Co-occurring Skills and Capabilities in England by Category

The follow tables expand on the table above by listing co-occurrences grouped by category. The same employment type, locality and period is covered with up to 20 co-occurrences shown in each of the following categories:

Application Platforms
1 20 (2.19%) SharePoint
2 17 (1.86%) CMS
3 14 (1.53%) Microsoft Exchange
4 12 (1.31%) Confluence
5 10 (1.10%) IIS
5 10 (1.10%) WordPress
6 7 (0.77%) Appian
7 5 (0.55%) Liferay
7 5 (0.55%) Oracle SOA Suite
7 5 (0.55%) Umbraco
8 4 (0.44%) Drupal
8 4 (0.44%) Headless CMS
8 4 (0.44%) nginx
9 3 (0.33%) Apache
10 2 (0.22%) OpenStack
10 2 (0.22%) Oracle Workflow
10 2 (0.22%) Strapi
10 2 (0.22%) WebLogic
11 1 (0.11%) Apache Spark
11 1 (0.11%) Sitefinity
Applications
1 4 (0.44%) Microsoft Excel
2 3 (0.33%) Adobe XD
2 3 (0.33%) Sketch
3 1 (0.11%) Chatbot
3 1 (0.11%) Microsoft Office
3 1 (0.11%) Trello
Business Applications
1 30 (3.29%) Dynamics CRM
2 24 (2.63%) NetSuite
3 9 (0.99%) Payment Gateway
4 7 (0.77%) Magento
5 5 (0.55%) Oracle EBS
6 4 (0.44%) Oracle BPM
6 4 (0.44%) SimCorp Dimension
7 3 (0.33%) Endur
8 2 (0.22%) Salesforce CRM
8 2 (0.22%) Shopify
9 1 (0.11%) Dynamics NAV
9 1 (0.11%) Oracle Applications
9 1 (0.11%) Oracle EBS R12
9 1 (0.11%) SAP S/4HANA
Cloud Services
1 297 (32.53%) AWS
2 210 (23.00%) Azure
3 174 (19.06%) Serverless
4 146 (15.99%) AWS Lambda
5 103 (11.28%) Amazon S3
6 81 (8.87%) AWS Step Functions
7 64 (7.01%) Power Platform
8 61 (6.68%) GCP
8 61 (6.68%) SaaS
9 43 (4.71%) Dynamics 365
10 30 (3.29%) Azure DevOps
11 29 (3.18%) Power Automate
12 27 (2.96%) GitHub
13 25 (2.74%) PowerApps
14 22 (2.41%) Amazon EC2
15 19 (2.08%) Snowflake
16 17 (1.86%) Azure Cosmos DB
17 16 (1.75%) Azure Logic Apps
17 16 (1.75%) Boomi
18 15 (1.64%) Figma
Communications & Networking
1 73 (8.00%) Broadband
2 8 (0.88%) HTTP
3 7 (0.77%) Internet
4 5 (0.55%) TCP/IP
5 4 (0.44%) Multicast
6 2 (0.22%) Wireshark
7 1 (0.11%) Network Security
7 1 (0.11%) RFID
Database & Business Intelligence
1 135 (14.79%) SQL Server
2 120 (13.14%) DynamoDB
3 106 (11.61%) Elasticsearch
4 70 (7.67%) MySQL
5 46 (5.04%) PostgreSQL
6 43 (4.71%) NoSQL
7 39 (4.27%) Relational Database
8 33 (3.61%) Power BI
9 29 (3.18%) MongoDB
10 26 (2.85%) OLTP
11 23 (2.52%) Data Warehouse
12 21 (2.30%) SQL Server Reporting Services
13 19 (2.08%) Redis
14 16 (1.75%) RDBMS
15 15 (1.64%) Metadata
15 15 (1.64%) SQL Server Integration Services
16 13 (1.42%) Data Hub
16 13 (1.42%) SQL CLR
16 13 (1.42%) SQL Server Analysis Services
17 6 (0.66%) DocumentDB
Development Applications
1 137 (15.01%) Git
2 40 (4.38%) JIRA
3 25 (2.74%) Jenkins
4 21 (2.30%) GitLab
5 20 (2.19%) JUnit
5 20 (2.19%) Maven
6 18 (1.97%) NUnit
7 15 (1.64%) Mockito
8 14 (1.53%) MagicDraw
9 12 (1.31%) Cucumber
9 12 (1.31%) IntelliJ
10 11 (1.20%) Cypress.io
10 11 (1.20%) Jasmine
10 11 (1.20%) TeamCity
11 8 (0.88%) Vite
12 7 (0.77%) Gradle
12 7 (0.77%) Octopus Deploy
12 7 (0.77%) rollup.js
13 6 (0.66%) Visual Studio
14 5 (0.55%) Mocha
General
1 209 (22.89%) Finance
2 192 (21.03%) Social Skills
3 49 (5.37%) Marketing
4 48 (5.26%) Banking
5 43 (4.71%) Analytical Skills
6 40 (4.38%) Retail
7 39 (4.27%) Games
8 34 (3.72%) Inclusion and Diversity
9 30 (3.29%) Public Sector
10 28 (3.07%) Front Office
11 25 (2.74%) Tech for Good
12 24 (2.63%) Back Office
12 24 (2.63%) Telecoms
13 18 (1.97%) Health Technology
13 18 (1.97%) Publishing
14 16 (1.75%) Law
15 15 (1.64%) Manufacturing
16 13 (1.42%) Electronics
16 13 (1.42%) Investment Banking
17 9 (0.99%) Documentation Skills
Libraries, Frameworks & Software Standards
1 296 (32.42%) React
2 250 (27.38%) .NET
3 182 (19.93%) HTML
4 147 (16.10%) CSS
5 114 (12.49%) GraphQL
6 102 (11.17%) RESTful
7 95 (10.41%) AngularJS
7 95 (10.41%) Node.js
8 87 (9.53%) .NET Core
9 82 (8.98%) ASP.NET
10 81 (8.87%) REST
11 72 (7.89%) Serverless Framework
12 61 (6.68%) XML
13 55 (6.02%) .NET Framework
14 51 (5.59%) Vue
15 43 (4.71%) Web Services
16 41 (4.49%) Blazor
17 40 (4.38%) HTML5
18 35 (3.83%) Spring
18 35 (3.83%) Spring Boot
Miscellaneous
1 51 (5.59%) Mobile App
2 39 (4.27%) Cloud Native
3 35 (3.83%) Hedge funds
4 34 (3.72%) Equities
5 30 (3.29%) Self-Motivation
6 28 (3.07%) Algorithms
6 28 (3.07%) Product Ownership
7 27 (2.96%) Management Information System
8 24 (2.63%) Data Structures
9 23 (2.52%) Onboarding
10 17 (1.86%) Greenfield Project
11 16 (1.75%) Private Cloud
12 15 (1.64%) Legacy Systems
13 14 (1.53%) Enterprise Software
14 13 (1.42%) Virtual Team
15 12 (1.31%) Credit Derivative
16 10 (1.10%) Distributed Systems
16 10 (1.10%) Foreign Exchange (FX)
16 10 (1.10%) Legacy Applications
16 10 (1.10%) Team-Oriented Environment
Operating Systems
1 72 (7.89%) Linux
2 15 (1.64%) Apple iOS
3 14 (1.53%) Android
4 7 (0.77%) Windows
5 6 (0.66%) Unix
6 2 (0.22%) Mac OS
7 1 (0.11%) Ubuntu
7 1 (0.11%) zOS
Processes & Methodologies
1 360 (39.43%) Agile
2 241 (26.40%) CI/CD
3 180 (19.72%) Mentoring
4 161 (17.63%) Clean Code
5 154 (16.87%) DevOps
6 150 (16.43%) Problem-Solving
7 136 (14.90%) Full-Stack Development
8 127 (13.91%) User Experience
9 119 (13.03%) Continuous Integration
9 119 (13.03%) Software Engineering
10 114 (12.49%) Test Automation
11 109 (11.94%) Front End Development
12 108 (11.83%) Artificial Intelligence
13 104 (11.39%) Microservices
14 97 (10.62%) Event-Driven
15 92 (10.08%) Event-Driven Architecture
16 77 (8.43%) MVC
16 77 (8.43%) SDLC
17 69 (7.56%) TDD
18 66 (7.23%) Scrum
Programming Languages
1 341 (37.35%) JavaScript
2 265 (29.03%) C#
3 250 (27.38%) TypeScript
4 244 (26.73%) Python
5 221 (24.21%) SQL
6 101 (11.06%) Java
7 73 (8.00%) C++
8 72 (7.89%) PHP
9 31 (3.40%) PL/SQL
10 28 (3.07%) T-SQL
11 18 (1.97%) Apex Code
12 10 (1.10%) C
13 8 (0.88%) Bicep
13 8 (0.88%) Go
14 7 (0.77%) Ruby
15 6 (0.66%) Bash
15 6 (0.66%) Data Analysis Expressions
15 6 (0.66%) SOQL
16 5 (0.55%) Rust
16 5 (0.55%) Swift
Qualifications
1 81 (8.87%) Degree
2 76 (8.32%) AWS Certification
3 39 (4.27%) Security Cleared
4 29 (3.18%) Computer Science Degree
5 27 (2.96%) SC Cleared
6 18 (1.97%) BPSS Clearance
7 12 (1.31%) DBS Check
8 7 (0.77%) Master's Degree
9 6 (0.66%) Microsoft Certification
10 5 (0.55%) DV Cleared
11 4 (0.44%) AWS Certified Solutions Architect
11 4 (0.44%) PhD
12 2 (0.22%) Azure Certification
13 1 (0.11%) ITIL Certification
13 1 (0.11%) Numerate Degree
Quality Assurance & Compliance
1 89 (9.75%) QA
2 19 (2.08%) Accessibility
3 5 (0.55%) Data Quality
3 5 (0.55%) Software Quality Assurance
4 4 (0.44%) WCAG
5 3 (0.33%) GDPR
6 2 (0.22%) EMIR
6 2 (0.22%) MiFID
7 1 (0.11%) California Consumer Privacy Act
7 1 (0.11%) CDISC
7 1 (0.11%) HL7
System Software
1 104 (11.39%) Docker
2 13 (1.42%) VMware Infrastructure
3 7 (0.77%) Active Directory
4 1 (0.11%) Embedded Firmware
4 1 (0.11%) Firmware
Systems Management
1 71 (7.78%) Kubernetes
2 63 (6.90%) Terraform
3 19 (2.08%) Single Sign-On
4 14 (1.53%) Ansible
5 13 (1.42%) Failover Clustering
6 11 (1.20%) Prometheus
7 6 (0.66%) Grafana
8 4 (0.44%) Argo
9 1 (0.11%) RSA Archer
Vendors
1 98 (10.73%) Microsoft
2 54 (5.91%) Oracle
3 30 (3.29%) Salesforce
4 29 (3.18%) Google
5 16 (1.75%) IBM
6 15 (1.64%) Databricks
6 15 (1.64%) SAP
7 14 (1.53%) Adobe
7 14 (1.53%) New Relic
8 13 (1.42%) MuleSoft
8 13 (1.42%) VMware
9 12 (1.31%) Rollbar
10 8 (0.88%) Twitter
11 6 (0.66%) WooCommerce
12 4 (0.44%) Bloomberg
12 4 (0.44%) Okta
12 4 (0.44%) ServiceNow
12 4 (0.44%) SimCorp
12 4 (0.44%) Splunk
13 3 (0.33%) OpenLink