SQL Server Integration Services Jobs in England

Microsoft SQL Server Integration Services (SSIS)
UK > England

The table below provides summary statistics for permanent job vacancies advertised in England requiring SQL Server Integration Services skills. It includes a benchmarking guide to the annual salaries offered in vacancies that cited SQL Server Integration Services over the 6 months leading up to 26 July 2024, comparing them to the same period in the previous two years.

6 months to
26 Jul 2024
Same period 2023 Same period 2022
Rank 396 292 297
Rank change year-on-year -104 +5 -82
Permanent jobs citing SQL Server Integration Services 481 825 2,093
As % of all permanent jobs advertised in England 0.61% 1.16% 1.42%
As % of the Database & Business Intelligence category 3.85% 5.53% 5.23%
Number of salaries quoted 381 712 1,660
10th Percentile £41,250 £36,800 £36,250
25th Percentile £47,500 £46,250 £44,738
Median annual salary (50th Percentile) £57,500 £57,500 £55,000
Median % change year-on-year - +4.55% +6.80%
75th Percentile £71,250 £72,500 £68,750
90th Percentile £85,000 £82,500 £83,750
UK median annual salary £57,500 £56,500 £55,000
% change year-on-year +1.77% +2.73% +10.00%

All Database and Business Intelligence Skills
England

SQL Server Integration Services falls under the Databases and Business Intelligence category. For comparison with the information above, the following table provides summary statistics for all permanent job vacancies requiring database or business intelligence skills in England.

Permanent vacancies with a requirement for database or business intelligence skills 12,495 14,926 39,989
As % of all permanent jobs advertised in England 15.95% 21.00% 27.20%
Number of salaries quoted 8,650 10,674 19,065
10th Percentile £36,250 £37,500 £36,250
25th Percentile £45,000 £47,500 £45,491
Median annual salary (50th Percentile) £60,000 £65,000 £60,000
Median % change year-on-year -7.69% +8.33% +9.09%
75th Percentile £84,188 £82,500 £81,250
90th Percentile £112,500 £100,000 £97,500
UK median annual salary £60,000 £62,500 £60,000
% change year-on-year -4.00% +4.17% +9.09%

SQL Server Integration Services
Job Vacancy Trend in England

Job postings citing SQL Server Integration Services as a proportion of all IT jobs advertised in England.
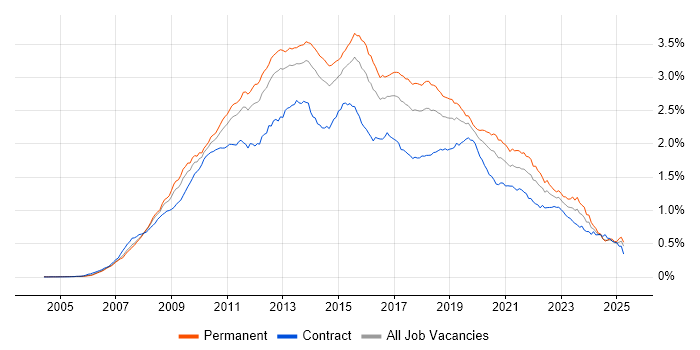
Job vacancy trend for SQL Server Integration Services in England

SQL Server Integration Services
Salary Trend in England

3-month moving average salary quoted in jobs citing SQL Server Integration Services in England.

Salary trend for SQL Server Integration Services in England

SQL Server Integration Services
Salary Histogram in England

Salary distribution for jobs citing SQL Server Integration Services in England over the 6 months to 26 July 2024.

Salary histogram for SQL Server Integration Services in England

SQL Server Integration Services
Job Locations in England

The table below looks at the demand and provides a guide to the median salaries quoted in IT jobs citing SQL Server Integration Services within the England region over the 6 months to 26 July 2024. The 'Rank Change' column provides an indication of the change in demand within each location based on the same 6 month period last year.

Location Rank Change
on Same Period
Last Year
Matching
Permanent
IT Job Ads
Median Salary
Past 6 Months
Median Salary
% Change
on Same Period
Last Year
Live
Jobs
London -63 195 £67,500 - 14
North of England -14 101 £50,000 - 23
Midlands -41 93 £57,500 +15.00% 10
West Midlands -9 78 £57,500 +15.00% 6
North West -8 69 £50,500 +1.00% 12
South East -9 41 £59,125 +12.62% 10
Yorkshire +36 30 £50,000 - 10
South West -38 28 £52,500 +5.00% 13
East of England -34 20 £47,143 -14.29% 7
East Midlands -43 13 £55,000 +15.79% 4
North East -18 2 £30,000 -40.00% 2
SQL Server Integration Services
UK

SQL Server Integration Services
Co-occurring Skills and Capabilities in England by Category

The follow tables expand on the table above by listing co-occurrences grouped by category. The same employment type, locality and period is covered with up to 20 co-occurrences shown in each of the following categories:

Application Platforms
1 14 (2.91%) SharePoint
2 7 (1.46%) IIS
3 6 (1.25%) BizTalk Server
3 6 (1.25%) CMS
4 5 (1.04%) SAS
5 4 (0.83%) Cloud Foundry
5 4 (0.83%) Confluence
5 4 (0.83%) Sitecore CMS
6 3 (0.62%) Apache
6 3 (0.62%) Apache Spark
6 3 (0.62%) Jupyter
7 2 (0.42%) Apache Airflow
7 2 (0.42%) Umbraco
8 1 (0.21%) Apache Pig
8 1 (0.21%) Moodle
8 1 (0.21%) WebLogic
Applications
1 42 (8.73%) Microsoft Excel
2 22 (4.57%) Microsoft Office
3 13 (2.70%) Microsoft PowerPoint
4 5 (1.04%) MS Visio
5 2 (0.42%) Microsoft Project
Business Applications
1 25 (5.20%) Dynamics CRM
2 3 (0.62%) Dynamics NAV
2 3 (0.62%) NEC Housing
3 2 (0.42%) SAP S/4HANA
4 1 (0.21%) Dynamics AX
4 1 (0.21%) HFM
4 1 (0.21%) NetSuite
4 1 (0.21%) Oracle Applications
4 1 (0.21%) Scribe Insight
4 1 (0.21%) Shopify
Cloud Services
1 306 (63.62%) Azure
2 231 (48.02%) Power Platform
3 94 (19.54%) Azure Data Factory
4 59 (12.27%) Azure Synapse Analytics
5 30 (6.24%) Dynamics 365
6 26 (5.41%) SaaS
7 25 (5.20%) Azure DevOps
8 24 (4.99%) PowerApps
9 23 (4.78%) Microsoft 365
10 22 (4.57%) Power Automate
11 21 (4.37%) AWS
12 20 (4.16%) Cloud Computing
13 14 (2.91%) Serverless
14 12 (2.49%) Snowflake
15 11 (2.29%) Azure Logic Apps
16 9 (1.87%) Azure Stack
16 9 (1.87%) IaaS
16 9 (1.87%) PaaS
17 8 (1.66%) Boomi
17 8 (1.66%) GCP
Communications & Networking
1 7 (1.46%) DNS
2 6 (1.25%) Firewall
3 5 (1.04%) DHCP
4 4 (0.83%) Network Security
5 3 (0.62%) TCP/IP
6 2 (0.42%) FTP
6 2 (0.42%) LAN
6 2 (0.42%) VPN
6 2 (0.42%) WAN
6 2 (0.42%) WebEx
6 2 (0.42%) Wireless
7 1 (0.21%) Internet
7 1 (0.21%) Skype
7 1 (0.21%) SSL
Database & Business Intelligence
1 315 (65.49%) SQL Server
2 246 (51.14%) SQL Server Reporting Services
3 224 (46.57%) Power BI
4 146 (30.35%) Data Warehouse
5 143 (29.73%) SQL Server Analysis Services
6 55 (11.43%) Data Lake
7 40 (8.32%) Azure SQL Database
8 37 (7.69%) Relational Database
9 31 (6.44%) Power Query
10 28 (5.82%) Tableau
11 20 (4.16%) Big Data
11 20 (4.16%) Metadata
11 20 (4.16%) Microsoft Analysis Services
11 20 (4.16%) Oracle Database
12 12 (2.49%) PostgreSQL
13 10 (2.08%) BusinessObjects
13 10 (2.08%) Oracle Reports
13 10 (2.08%) RDBMS
14 9 (1.87%) PowerPivot
15 7 (1.46%) Semantic Layer
Development Applications
1 32 (6.65%) Visual Studio
2 29 (6.03%) Git
3 21 (4.37%) SQL Server Management Studio (SSMS)
4 15 (3.12%) JIRA
5 14 (2.91%) Team Foundation Server
6 8 (1.66%) SoapUI
7 6 (1.25%) Dreamweaver
8 5 (1.04%) Jenkins
9 4 (0.83%) Ant
9 4 (0.83%) Atlassian Bamboo
9 4 (0.83%) Eclipse
9 4 (0.83%) Mercurial
10 3 (0.62%) Bitbucket
10 3 (0.62%) ER Studio
10 3 (0.62%) ERwin
10 3 (0.62%) Subversion
11 2 (0.42%) Android Studio
11 2 (0.42%) Postman
11 2 (0.42%) TeamCity
12 1 (0.21%) Oracle Forms
General
1 134 (27.86%) Social Skills
2 122 (25.36%) Finance
3 54 (11.23%) Analytical Skills
4 33 (6.86%) Retail
5 19 (3.95%) Law
6 15 (3.12%) Marketing
7 13 (2.70%) Presentation Skills
7 13 (2.70%) Public Sector
8 11 (2.29%) Inclusion and Diversity
9 10 (2.08%) Documentation Skills
9 10 (2.08%) Legal
10 9 (1.87%) Pharmaceutical
11 8 (1.66%) General Ledger
12 6 (1.25%) Back Office
12 6 (1.25%) Banking
12 6 (1.25%) Local Government
12 6 (1.25%) Manufacturing
13 5 (1.04%) Influencing Skills
14 4 (0.83%) Telecoms
15 3 (0.62%) Games
Job Titles
1 197 (40.96%) Developer
2 87 (18.09%) Data Engineer
3 86 (17.88%) Senior
4 63 (13.10%) DBA
5 62 (12.89%) SQL Developer
6 60 (12.47%) Analyst
7 46 (9.56%) Business Intelligence Developer
8 37 (7.69%) Senior Developer
9 35 (7.28%) SQL DBA
10 34 (7.07%) Administrator
10 34 (7.07%) Lead
11 26 (5.41%) .NET Developer
12 24 (4.99%) Power BI Developer
13 22 (4.57%) Azure Data Engineer
13 22 (4.57%) Azure Engineer
13 22 (4.57%) Database Developer
14 20 (4.16%) Consultant
14 20 (4.16%) Senior Data Engineer
15 18 (3.74%) SSIS Developer
16 17 (3.53%) Business Intelligence Analyst
Libraries, Frameworks & Software Standards
1 96 (19.96%) .NET
2 26 (5.41%) .NET Framework
3 25 (5.20%) REST
4 24 (4.99%) ASP.NET
5 23 (4.78%) JSON
6 20 (4.16%) SOAP
7 18 (3.74%) HTML
8 16 (3.33%) Web Services
9 15 (3.12%) XML
10 14 (2.91%) AngularJS
11 13 (2.70%) ASP.NET Web API
12 11 (2.29%) CSS
13 10 (2.08%) jQuery
13 10 (2.08%) MDX
14 9 (1.87%) .NET Core
15 8 (1.66%) Razor View Engine
16 7 (1.46%) HTML5
17 6 (1.25%) Classic ASP
17 6 (1.25%) WSDL
17 6 (1.25%) XML Messaging
Miscellaneous
1 23 (4.78%) Replication
2 17 (3.53%) Management Information System
3 13 (2.70%) Algorithms
3 13 (2.70%) Housing Association
4 10 (2.08%) Product Ownership
5 9 (1.87%) e-Learning
5 9 (1.87%) NHS
5 9 (1.87%) Self-Motivation
6 8 (1.66%) Data Protection Act
7 7 (1.46%) Cloud Native
7 7 (1.46%) Clustering
8 6 (1.25%) Greenfield Project
8 6 (1.25%) PropTech
8 6 (1.25%) Public Cloud
9 4 (0.83%) Data Structures
9 4 (0.83%) Reinsurance
10 3 (0.62%) Analytical Mindset
11 2 (0.42%) Cyber Threat
11 2 (0.42%) Driving Licence
11 2 (0.42%) Legacy Systems
Operating Systems
1 43 (8.94%) Windows
2 14 (2.91%) Windows Server
3 13 (2.70%) Linux
4 8 (1.66%) Unix
5 3 (0.62%) Windows Server 2012
6 2 (0.42%) Android
6 2 (0.42%) Windows 10
6 2 (0.42%) Windows Server 2008
6 2 (0.42%) Windows Server 2016
6 2 (0.42%) Windows Server 2019
Processes & Methodologies
1 253 (52.60%) Business Intelligence
2 212 (44.07%) ETL
3 118 (24.53%) Data Modelling
4 109 (22.66%) Analytics
5 108 (22.45%) Problem-Solving
6 90 (18.71%) Agile
7 88 (18.30%) DevOps
8 78 (16.22%) Visualisation
9 66 (13.72%) Data Integration
10 58 (12.06%) Data Visualisation
11 57 (11.85%) Migration
12 50 (10.40%) Data Engineering
12 50 (10.40%) Performance Tuning
13 48 (9.98%) CI/CD
14 42 (8.73%) Computer Science
14 42 (8.73%) Data Management
15 40 (8.32%) Data Analysis
16 38 (7.90%) Decision-Making
17 37 (7.69%) Customer Service
18 35 (7.28%) CRM
Programming Languages
1 406 (84.41%) SQL
2 190 (39.50%) T-SQL
3 128 (26.61%) C#
4 76 (15.80%) PowerShell
5 49 (10.19%) Python
6 39 (8.11%) JavaScript
7 31 (6.44%) Data Analysis Expressions
8 23 (4.78%) PL/SQL
9 15 (3.12%) VB.NET
10 12 (2.49%) VBA
11 11 (2.29%) Bicep
11 11 (2.29%) VB
12 8 (1.66%) Shell Script
13 7 (1.46%) Java
13 7 (1.46%) R
14 6 (1.25%) VBScript
15 4 (0.83%) Apex Code
16 3 (0.62%) X++
17 2 (0.42%) Bash
17 2 (0.42%) Scala
Qualifications
1 101 (21.00%) Degree
2 26 (5.41%) Microsoft Certification
3 25 (5.20%) Computer Science Degree
4 19 (3.95%) DBS Check
4 19 (3.95%) Security Cleared
5 14 (2.91%) Azure Certification
6 8 (1.66%) Master's Degree
6 8 (1.66%) SC Cleared
7 4 (0.83%) ITIL Certification
8 3 (0.62%) ISTQB
8 3 (0.62%) MCSA
9 2 (0.42%) CCIE
9 2 (0.42%) CCNA
9 2 (0.42%) CCNP
9 2 (0.42%) Cisco Certification
9 2 (0.42%) ITIL Foundation Certificate
9 2 (0.42%) MCSE
9 2 (0.42%) Oracle Certification
10 1 (0.21%) MCP
10 1 (0.21%) PMP
Quality Assurance & Compliance
1 73 (15.18%) Data Quality
2 16 (3.33%) QA
3 14 (2.91%) GDPR
4 2 (0.42%) Software Quality Assurance
5 1 (0.21%) Accessibility
System Software
1 13 (2.70%) Active Directory
2 7 (1.46%) Docker
3 4 (0.83%) Virtual Machines
4 3 (0.62%) vSphere
5 1 (0.21%) Apache Flume
5 1 (0.21%) HDFS
5 1 (0.21%) Oracle RAC
Systems Management
1 14 (2.91%) Terraform
2 7 (1.46%) Kubernetes
3 6 (1.25%) Ansible
3 6 (1.25%) Foglight
4 5 (1.04%) Microsoft Clustering
4 5 (1.04%) Nagios
5 4 (0.83%) Single Sign-On
6 1 (0.21%) Control-M
6 1 (0.21%) Data Guard
6 1 (0.21%) Failover Clustering
6 1 (0.21%) Kibana
6 1 (0.21%) Oracle Enterprise Manager
6 1 (0.21%) Oracle RMAN
6 1 (0.21%) yum
Vendors
1 252 (52.39%) Microsoft
2 65 (13.51%) Databricks
3 47 (9.77%) Oracle
4 13 (2.70%) Informatica
5 11 (2.29%) Google
5 11 (2.29%) SAP
6 9 (1.87%) BT
6 9 (1.87%) Dell
6 9 (1.87%) MuleSoft
7 8 (1.66%) Salesforce
7 8 (1.66%) Veeam
8 7 (1.46%) Commvault
8 7 (1.46%) NEC
8 7 (1.46%) TIBCO
9 6 (1.25%) webMethods
10 5 (1.04%) Alteryx
10 5 (1.04%) ArcSight
10 5 (1.04%) HP
11 4 (0.83%) ServiceNow
11 4 (0.83%) Sitecore