Serverless Jobs in England

Serverless Computing
UK > England

The table below provides summary statistics for permanent job vacancies advertised in England requiring Serverless skills. It includes a benchmarking guide to the annual salaries offered in vacancies that cited Serverless over the 6 months leading up to 1 May 2025, comparing them to the same period in the previous two years.

6 months to
1 May 2025
Same period 2024 Same period 2023
Rank 179 188 149
Rank change year-on-year +9 -39 -70
Permanent jobs citing Serverless 784 1,320 2,260
As % of all permanent jobs advertised in England 1.70% 1.55% 2.44%
As % of the Cloud Services category 5.71% 4.35% 5.63%
Number of salaries quoted 611 907 1,368
10th Percentile £52,500 £47,500 £50,000
25th Percentile £60,000 £56,250 £60,000
Median annual salary (50th Percentile) £75,000 £75,000 £75,000
Median % change year-on-year - - -3.23%
75th Percentile £100,000 £93,750 £95,000
90th Percentile £118,750 £112,500 £108,750
UK median annual salary £75,000 £75,000 £72,500
% change year-on-year - +3.45% -3.33%

All Cloud Skills
England

Serverless falls under the Cloud Services category. For comparison with the information above, the following table provides summary statistics for all permanent job vacancies requiring cloud computing skills in England.

Permanent vacancies with a requirement for cloud computing skills 13,738 30,311 40,119
As % of all permanent jobs advertised in England 29.83% 35.58% 43.36%
Number of salaries quoted 10,184 24,258 26,546
10th Percentile £31,250 £30,000 £34,750
25th Percentile £44,277 £41,250 £46,250
Median annual salary (50th Percentile) £62,500 £57,500 £65,000
Median % change year-on-year +8.70% -11.54% +4.00%
75th Percentile £83,750 £77,500 £85,000
90th Percentile £105,000 £97,500 £105,000
UK median annual salary £61,000 £57,500 £65,000
% change year-on-year +6.09% -11.54% +4.00%

Serverless
Job Vacancy Trend in England

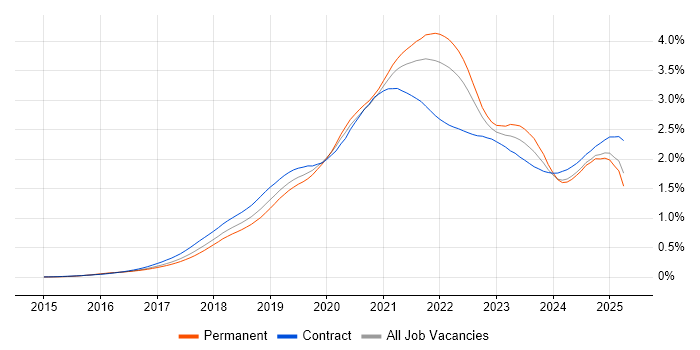
Job postings citing Serverless as a proportion of all IT jobs advertised in England.

Job vacancy trend for Serverless in England

Serverless
Salary Trend in England

3-month moving average salary quoted in jobs citing Serverless in England.

Salary trend for Serverless in England

Serverless
Salary Histogram in England

Salary distribution for jobs citing Serverless in England over the 6 months to 1 May 2025.

Salary histogram for Serverless in England

Serverless
Job Locations in England

The table below looks at the demand and provides a guide to the median salaries quoted in IT jobs citing Serverless within the England region over the 6 months to 1 May 2025. The 'Rank Change' column provides an indication of the change in demand within each location based on the same 6 month period last year.

Location Rank Change
on Same Period
Last Year
Matching
Permanent
IT Job Ads
Median Salary
Past 6 Months
Median Salary
% Change
on Same Period
Last Year
Live
Jobs
London +37 449 £92,500 +8.82% 471
South East +13 116 £60,000 -14.29% 142
North of England -40 94 £65,000 +8.33% 147
Midlands +35 67 £55,000 -21.43% 44
South West +87 59 £60,000 -7.69% 41
West Midlands +19 54 £56,250 -19.64% 26
North West -54 54 £75,000 +25.00% 97
Yorkshire +52 38 £57,500 -4.17% 37
East of England +29 29 £85,000 +47.83% 18
East Midlands +37 13 £55,000 -15.38% 12
North East +18 6 £62,500 -3.85% 18
Serverless
UK

Serverless
Co-occurring Skills and Capabilities in England by Category

The follow tables expand on the table above by listing co-occurrences grouped by category. The same employment type, locality and period is covered with up to 20 co-occurrences shown in each of the following categories:

Application Platforms
1 88 (11.22%) Apache Spark
2 85 (10.84%) Apache
3 77 (9.82%) Apache Airflow
4 18 (2.30%) SharePoint
5 17 (2.17%) Confluence
6 12 (1.53%) CMS
6 12 (1.53%) JBoss
6 12 (1.53%) Red Hat Fuse
7 8 (1.02%) Headless CMS
8 6 (0.77%) OpenStack
9 4 (0.51%) Microsoft Exchange
10 3 (0.38%) Oracle SOA Suite
11 2 (0.26%) Adobe Experience Manager
11 2 (0.26%) Mule
11 2 (0.26%) Oracle Coherence
11 2 (0.26%) Strapi
11 2 (0.26%) Tomcat
11 2 (0.26%) Umbraco
Applications
1 7 (0.89%) Mozilla Thunderbird
2 3 (0.38%) Microsoft Office
2 3 (0.38%) MS Visio
3 2 (0.26%) Chatbot
4 1 (0.13%) Microsoft Excel
4 1 (0.13%) Trello
Business Applications
1 10 (1.28%) Dynamics CRM
2 5 (0.64%) SimCorp Dimension
3 2 (0.26%) Payment Gateway
3 2 (0.26%) Sprinklr
Cloud Services
1 616 (78.57%) AWS
2 451 (57.53%) AWS Lambda
3 228 (29.08%) Azure
4 219 (27.93%) Amazon S3
5 183 (23.34%) Amazon ECS
6 163 (20.79%) Amazon EC2
7 129 (16.45%) Azure Functions
8 105 (13.39%) AWS CloudFormation
9 87 (11.10%) Amazon SQS
10 83 (10.59%) OpenShift
11 82 (10.46%) dbt
12 74 (9.44%) SaaS
13 69 (8.80%) GitHub
14 68 (8.67%) Amazon EKS
15 67 (8.55%) Azure Logic Apps
15 67 (8.55%) GCP
16 54 (6.89%) Amazon CloudWatch
16 54 (6.89%) Power Platform
17 49 (6.25%) Azure DevOps
18 48 (6.12%) AWS Step Functions
Communications & Networking
1 19 (2.42%) HTTP
2 17 (2.17%) Network Security
3 13 (1.66%) Firewall
4 8 (1.02%) SSL
5 6 (0.77%) Bluetooth
5 6 (0.77%) Internet
5 6 (0.77%) VPN
6 4 (0.51%) IPv4
7 2 (0.26%) OSPF
7 2 (0.26%) VLAN
8 1 (0.13%) MQTT
8 1 (0.13%) Wi-Fi
Database & Business Intelligence
1 107 (13.65%) Amazon RDS
2 102 (13.01%) DynamoDB
3 87 (11.10%) Amazon Athena
4 80 (10.20%) Amazon Redshift
4 80 (10.20%) PostgreSQL
5 76 (9.69%) Dremio
6 72 (9.18%) Apache Iceberg
7 71 (9.06%) Apache Arrow
7 71 (9.06%) Apache Ignite
8 62 (7.91%) NoSQL
9 56 (7.14%) Relational Database
10 53 (6.76%) Data Lake
11 44 (5.61%) SQL Server
12 42 (5.36%) Data Warehouse
13 41 (5.23%) Big Data
14 38 (4.85%) Power BI
15 35 (4.46%) MySQL
16 25 (3.19%) RDBMS
17 24 (3.06%) Azure SQL Database
17 24 (3.06%) MongoDB
Development Applications
1 124 (15.82%) Git
2 103 (13.14%) Jenkins
3 86 (10.97%) Artifactory
4 47 (5.99%) JIRA
4 47 (5.99%) JUnit
5 43 (5.48%) GitLab
6 32 (4.08%) Mockito
7 19 (2.42%) JMeter
8 18 (2.30%) Cucumber
9 15 (1.91%) Maven
9 15 (1.91%) Selenium
9 15 (1.91%) Visual Studio
10 14 (1.79%) IntelliJ
11 10 (1.28%) PowerBuilder
12 7 (0.89%) Bitbucket
12 7 (0.89%) Bitbucket Server
12 7 (0.89%) CircleCI
12 7 (0.89%) Postman
12 7 (0.89%) SonarQube
13 6 (0.77%) Octopus Deploy
General
1 229 (29.21%) Finance
2 175 (22.32%) Social Skills
3 121 (15.43%) Front Office
4 73 (9.31%) Public Sector
5 58 (7.40%) Banking
6 50 (6.38%) Analytical Skills
7 34 (4.34%) Law
8 24 (3.06%) Retail
9 20 (2.55%) Health Technology
9 20 (2.55%) Publishing
9 20 (2.55%) Tech for Good
10 19 (2.42%) Marketing
11 17 (2.17%) Influencing Skills
12 16 (2.04%) Manufacturing
12 16 (2.04%) Presentation Skills
13 15 (1.91%) Inclusion and Diversity
13 15 (1.91%) Organisational Skills
14 12 (1.53%) Telecoms
15 11 (1.40%) Electronics
15 11 (1.40%) Legal
Job Titles
1 255 (32.53%) Developer
2 198 (25.26%) Senior
3 167 (21.30%) AWS Engineer
4 136 (17.35%) DevOps Engineer
5 133 (16.96%) Data Engineer
6 130 (16.58%) AWS DevOps
7 119 (15.18%) Lead
8 116 (14.80%) AWS DevOps Engineer
9 115 (14.67%) Python Engineer
10 105 (13.39%) Senior Developer
11 73 (9.31%) Architect
12 70 (8.93%) Software Engineer
13 64 (8.16%) Java Developer
14 60 (7.65%) Full-Stack Developer
15 38 (4.85%) AWS Developer
16 35 (4.46%) Cloud Architect
17 34 (4.34%) Software Developer
18 31 (3.95%) AWS Architect
19 30 (3.83%) Senior DevOps
20 27 (3.44%) DevOps Manager
Libraries, Frameworks & Software Standards
1 168 (21.43%) React
2 126 (16.07%) Kafka
3 116 (14.80%) Node.js
4 103 (13.14%) REST
5 93 (11.86%) J2EE
6 92 (11.73%) RESTful
7 91 (11.61%) PySpark
8 90 (11.48%) .NET
9 81 (10.33%) HTML
10 69 (8.80%) GraphQL
11 68 (8.67%) Spring Boot
12 66 (8.42%) Spring
13 65 (8.29%) CSS
14 52 (6.63%) Web Services
15 48 (6.12%) AngularJS
16 35 (4.46%) JSON
16 35 (4.46%) SOAP
17 32 (4.08%) ActiveMQ
18 30 (3.83%) Apache Camel
18 30 (3.83%) Vue
Miscellaneous
1 84 (10.71%) Cloud Native
2 48 (6.12%) Distributed Systems
3 45 (5.74%) Product Ownership
4 33 (4.21%) Management Information System
5 23 (2.93%) Mobile App
6 17 (2.17%) Enterprise Software
7 16 (2.04%) IoT
8 14 (1.79%) Credit Derivative
9 12 (1.53%) Client/Server
10 11 (1.40%) Tandem
11 10 (1.28%) Public Cloud
11 10 (1.28%) Reinsurance
11 10 (1.28%) Robotics
12 9 (1.15%) Algorithms
13 8 (1.02%) Greenfield Project
13 8 (1.02%) Hybrid Cloud
13 8 (1.02%) SCADA
14 6 (0.77%) Embedded Systems
14 6 (0.77%) Enterprise Cloud
14 6 (0.77%) Virtual Team
Operating Systems
1 52 (6.63%) Linux
2 14 (1.79%) Ubuntu
3 10 (1.28%) Windows
4 4 (0.51%) VMS
5 2 (0.26%) Android
5 2 (0.26%) Apple iOS
5 2 (0.26%) Red Hat Enterprise Linux
6 1 (0.13%) Unix
6 1 (0.13%) Windows 10
6 1 (0.13%) Windows Server
6 1 (0.13%) Windows Server 2012
6 1 (0.13%) Windows Server 2016
6 1 (0.13%) Windows Server 2019
Processes & Methodologies
1 401 (51.15%) DevOps
2 396 (50.51%) CI/CD
3 376 (47.96%) Agile
4 275 (35.08%) Software Engineering
5 220 (28.06%) Microservices
6 134 (17.09%) Full-Stack Development
7 133 (16.96%) Problem-Solving
8 123 (15.69%) Infrastructure as Code
8 123 (15.69%) Site Reliability Engineering
9 115 (14.67%) Asset Management
10 111 (14.16%) Analytics
10 111 (14.16%) Data Engineering
11 108 (13.78%) Containerisation
12 103 (13.14%) Mentoring
13 100 (12.76%) Open Source
14 98 (12.50%) Scrum
15 95 (12.12%) Event-Driven
16 87 (11.10%) Event-Driven Architecture
16 87 (11.10%) TDD
17 80 (10.20%) Test Automation
Programming Languages
1 363 (46.30%) Python
2 247 (31.51%) Java
3 218 (27.81%) JavaScript
4 182 (23.21%) SQL
5 160 (20.41%) TypeScript
6 117 (14.92%) C#
7 108 (13.78%) Go
8 30 (3.83%) PHP
9 27 (3.44%) Shell Script
10 24 (3.06%) Bash
11 22 (2.81%) PowerShell
12 20 (2.55%) C++
13 15 (1.91%) C
13 15 (1.91%) Scala
14 14 (1.79%) Bicep
15 13 (1.66%) R
16 7 (0.89%) Groovy
17 6 (0.77%) Ladder Logic
18 5 (0.64%) Perl
18 5 (0.64%) Ruby
Qualifications
1 106 (13.52%) Security Cleared
2 92 (11.73%) Degree
3 75 (9.57%) SC Cleared
4 57 (7.27%) Computer Science Degree
5 50 (6.38%) AWS Certification
6 26 (3.32%) AWS Certified Solutions Architect
7 11 (1.40%) DBS Check
7 11 (1.40%) Master's Degree
8 10 (1.28%) DV Cleared
9 9 (1.15%) Azure Certification
10 8 (1.02%) Numerate Degree
11 6 (0.77%) Microsoft Certification
11 6 (0.77%) TOGAF Certification
12 4 (0.51%) AWS Certified Developer
13 3 (0.38%) AWS Certified SysOps Administrator
13 3 (0.38%) PhD
14 2 (0.26%) (ISC)2 CCSP
14 2 (0.26%) BPSS Clearance
14 2 (0.26%) Cisco Certification
14 2 (0.26%) ISTQB
Quality Assurance & Compliance
1 43 (5.48%) QA
2 25 (3.19%) GDPR
3 23 (2.93%) SLA
4 17 (2.17%) HIPAA
5 16 (2.04%) Data Quality
6 11 (1.40%) ISO/IEC 27001
7 8 (1.02%) Accessibility
7 8 (1.02%) NIST
8 5 (0.64%) SOC 2
9 4 (0.51%) GMP
10 3 (0.38%) PCI DSS
11 2 (0.26%) NCSC
12 1 (0.13%) Cyber Essentials
12 1 (0.13%) Sarbanes-Oxley
12 1 (0.13%) WCAG
System Software
1 294 (37.50%) Docker
2 21 (2.68%) Active Directory
3 12 (1.53%) Virtual Machines
4 11 (1.40%) Virtual Desktop
5 2 (0.26%) VMware Infrastructure
6 1 (0.13%) HDFS
6 1 (0.13%) Slurm Workload Manager
Systems Management
1 287 (36.61%) Kubernetes
2 238 (30.36%) Terraform
3 50 (6.38%) Ansible
4 34 (4.34%) Prometheus
5 27 (3.44%) Grafana
6 19 (2.42%) Kibana
7 7 (0.89%) Nessus
7 7 (0.89%) Proxmox
8 6 (0.77%) Microsoft Intune
8 6 (0.77%) Progress Chef
8 6 (0.77%) Single Sign-On
9 5 (0.64%) Packer
10 4 (0.51%) Argo
10 4 (0.51%) Puppet
11 3 (0.38%) Nagios
12 1 (0.13%) Active Directory Federation Services
12 1 (0.13%) Bugsnag
12 1 (0.13%) logstash
12 1 (0.13%) SCCM
Vendors
1 99 (12.63%) Microsoft
2 35 (4.46%) Databricks
3 33 (4.21%) Google
4 25 (3.19%) Splunk
5 20 (2.55%) ServiceNow
6 18 (2.30%) Dynatrace
7 17 (2.17%) IBM
8 16 (2.04%) Salesforce
9 15 (1.91%) Informatica
9 15 (1.91%) MuleSoft
10 13 (1.66%) Oracle
11 7 (0.89%) Juniper
12 6 (0.77%) Siemens
12 6 (0.77%) VMware
13 5 (0.64%) SimCorp
14 4 (0.51%) Okta
15 3 (0.38%) Atlassian
15 3 (0.38%) OpenAI
15 3 (0.38%) SAP
16 2 (0.26%) Solace