Waterfall Jobs in England

Waterfall Model
UK > England

The table below provides summary statistics for permanent job vacancies advertised in England requiring Waterfall skills. It includes a benchmarking guide to the annual salaries offered in vacancies that cited Waterfall over the 6 months leading up to 2 June 2025, comparing them to the same period in the previous two years.

6 months to
2 Jun 2025
Same period 2024 Same period 2023
Rank 212 266 168
Rank change year-on-year +54 -98 +7
Permanent jobs citing Waterfall 772 951 1,883
As % of all permanent jobs advertised in England 1.56% 1.05% 2.24%
As % of the Processes & Methodologies category 1.67% 1.25% 2.34%
Number of salaries quoted 527 774 1,211
10th Percentile £49,146 £37,500 £42,500
25th Percentile £55,000 £46,250 £50,000
Median annual salary (50th Percentile) £65,000 £55,000 £61,000
Median % change year-on-year +18.18% -9.84% +1.67%
75th Percentile £73,000 £73,750 £77,500
90th Percentile £87,500 £86,250 £88,750
UK median annual salary £65,000 £55,000 £60,000
% change year-on-year +18.18% -8.33% +4.35%

All Process and Methodology Skills
England

Waterfall falls under the Processes and Methodologies category. For comparison with the information above, the following table provides summary statistics for all permanent job vacancies requiring process or methodology skills in England.

Permanent vacancies with a requirement for process or methodology skills 46,345 76,069 80,347
As % of all permanent jobs advertised in England 93.95% 83.60% 95.49%
Number of salaries quoted 23,070 55,107 48,708
10th Percentile £29,000 £29,000 £34,324
25th Percentile £41,250 £40,000 £46,000
Median annual salary (50th Percentile) £57,500 £55,000 £62,500
Median % change year-on-year +4.55% -12.00% +4.17%
75th Percentile £75,000 £72,500 £82,500
90th Percentile £97,500 £93,250 £102,500
UK median annual salary £56,000 £55,000 £60,800
% change year-on-year +1.82% -9.54% +1.33%

Waterfall
Job Vacancy Trend in England

Job postings citing Waterfall as a proportion of all IT jobs advertised in England.
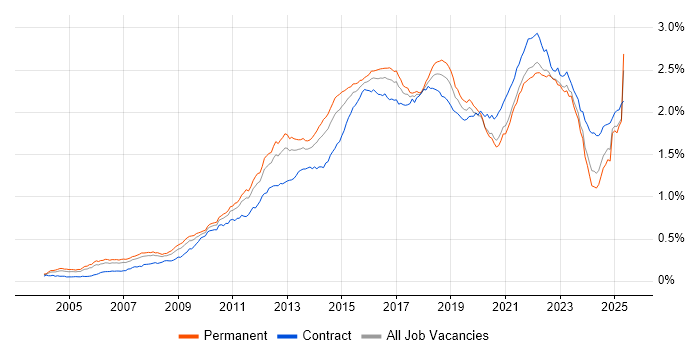
Job vacancy trend for Waterfall in England

Waterfall
Salary Trend in England

3-month moving average salary quoted in jobs citing Waterfall in England.

Salary trend for Waterfall in England

Waterfall
Salary Histogram in England

Salary distribution for jobs citing Waterfall in England over the 6 months to 2 June 2025.

Salary histogram for Waterfall in England

Waterfall
Job Locations in England

The table below looks at the demand and provides a guide to the median salaries quoted in IT jobs citing Waterfall within the England region over the 6 months to 2 June 2025. The 'Rank Change' column provides an indication of the change in demand within each location based on the same 6 month period last year.

Location Rank Change
on Same Period
Last Year
Matching
Permanent
IT Job Ads
Median Salary
Past 6 Months
Median Salary
% Change
on Same Period
Last Year
Live
Jobs
South East +139 303 £65,000 +20.37% 732
London +61 163 £67,500 +1.89% 395
Midlands +38 147 £58,250 +7.87% 540
North of England -41 99 £54,793 +1.47% 609
West Midlands +57 98 £57,500 +4.55% 283
North West 0 66 £54,793 +6.22% 272
East Midlands +21 49 £60,000 +11.11% 225
South West +74 39 £60,000 +11.63% 321
Yorkshire -5 25 £56,250 -10.00% 269
East of England -16 20 £70,000 +27.27% 400
North East +24 8 £56,250 +7.14% 71
Waterfall
UK

Waterfall
Co-occurring Skills and Capabilities in England by Category

The follow tables expand on the table above by listing co-occurrences grouped by category. The same employment type, locality and period is covered with up to 20 co-occurrences shown in each of the following categories:

Application Platforms
1 34 (4.40%) Confluence
2 16 (2.07%) Appian
3 6 (0.78%) Apache Spark
4 5 (0.65%) SharePoint
5 4 (0.52%) Apache
6 2 (0.26%) Apache Airflow
7 1 (0.13%) CICS
7 1 (0.13%) CMS
7 1 (0.13%) ColdFusion
7 1 (0.13%) Microsoft Exchange
7 1 (0.13%) OpenEdge
Applications
1 33 (4.27%) Microsoft Project
2 21 (2.72%) MS Visio
3 18 (2.33%) Microsoft Excel
3 18 (2.33%) Microsoft Office
4 12 (1.55%) Microsoft PowerPoint
5 10 (1.30%) Trello
6 1 (0.13%) Spreadsheet
Business Applications
1 7 (0.91%) Dynamics CRM
2 3 (0.39%) Oracle ERP
3 2 (0.26%) Adobe Campaign
3 2 (0.26%) Maximo
3 2 (0.26%) Salesforce CRM
3 2 (0.26%) SAP S/4HANA
3 2 (0.26%) Siebel CRM
4 1 (0.13%) Elite 3E
4 1 (0.13%) Lorenzo
4 1 (0.13%) Oracle EBS
4 1 (0.13%) Oracle EBS R12
4 1 (0.13%) SAP MDG
4 1 (0.13%) SystmOne
Cloud Services
1 89 (11.53%) Azure
2 51 (6.61%) AWS
3 43 (5.57%) Azure DevOps
3 43 (5.57%) Power Platform
3 43 (5.57%) SaaS
4 31 (4.02%) PaaS
5 29 (3.76%) IaaS
6 25 (3.24%) Azure Service Bus
7 24 (3.11%) Power Automate
8 20 (2.59%) Dynamics 365
9 17 (2.20%) Azure AI
9 17 (2.20%) Microsoft 365
10 15 (1.94%) Azure ExpressRoute
10 15 (1.94%) Azure Key Vault
10 15 (1.94%) Azure Monitor
10 15 (1.94%) Entra ID
10 15 (1.94%) GitHub
11 13 (1.68%) GCP
12 11 (1.42%) Amazon S3
12 11 (1.42%) Serverless
Communications & Networking
1 26 (3.37%) WAN
2 23 (2.98%) Firewall
2 23 (2.98%) SD-WAN
3 16 (2.07%) DNS
4 15 (1.94%) VPN
5 8 (1.04%) 5G
6 5 (0.65%) Network Security
7 4 (0.52%) Wireless
8 2 (0.26%) Broadband
8 2 (0.26%) Ethernet
9 1 (0.13%) Cisco ISE
9 1 (0.13%) DHCP
9 1 (0.13%) DWDM
9 1 (0.13%) GPON
9 1 (0.13%) IPv4
9 1 (0.13%) IPv6
9 1 (0.13%) Modbus
9 1 (0.13%) MPLS
Database & Business Intelligence
1 34 (4.40%) Power BI
2 18 (2.33%) Data Lake
3 17 (2.20%) MySQL
4 11 (1.42%) SQL Server
5 10 (1.30%) PostgreSQL
5 10 (1.30%) Relational Database
5 10 (1.30%) Tableau
6 8 (1.04%) Data Warehouse
7 5 (0.65%) SQL Server Integration Services
8 4 (0.52%) Amazon Redshift
8 4 (0.52%) RDBMS
9 3 (0.39%) Oracle Database
10 2 (0.26%) Apache Hive
10 2 (0.26%) Azure SQL Data Warehouse
10 2 (0.26%) Azure SQL Database
10 2 (0.26%) Big Data
10 2 (0.26%) Data Mining
10 2 (0.26%) DB2
10 2 (0.26%) OLTP
11 1 (0.13%) Apache Cassandra
Development Applications
1 102 (13.21%) JIRA
2 25 (3.24%) Git
3 21 (2.72%) eggPlant
4 18 (2.33%) Rational DOORS
5 8 (1.04%) Selenium
6 7 (0.91%) Postman
7 6 (0.78%) Jenkins
8 4 (0.52%) Visual Studio
8 4 (0.52%) Visual Studio Code
9 3 (0.39%) JMeter
9 3 (0.39%) SoapUI
9 3 (0.39%) Subversion
10 2 (0.26%) HP UFT
10 2 (0.26%) LoadRunner
10 2 (0.26%) TestNG
11 1 (0.13%) Bugzilla
11 1 (0.13%) Cypress.io
11 1 (0.13%) Oracle APEX
11 1 (0.13%) Oracle Forms
11 1 (0.13%) Team Foundation Server
General
1 156 (20.21%) Social Skills
2 128 (16.58%) Finance
3 73 (9.46%) Analytical Skills
4 26 (3.37%) Retail
5 25 (3.24%) Organisational Skills
6 22 (2.85%) Law
7 20 (2.59%) Banking
7 20 (2.59%) Manufacturing
8 18 (2.33%) Inclusion and Diversity
8 18 (2.33%) Presentation Skills
9 13 (1.68%) Influencing Skills
10 11 (1.42%) Public Sector
11 10 (1.30%) Electronics
11 10 (1.30%) Marketing
12 8 (1.04%) Legal
13 6 (0.78%) Front Office
13 6 (0.78%) Telecoms
14 5 (0.65%) French Language
14 5 (0.65%) Publishing
14 5 (0.65%) Retail Banking
Job Titles
1 188 (24.35%) Senior
2 158 (20.47%) Principal Engineer
3 128 (16.58%) Project Manager
4 117 (15.16%) Software Engineer
5 110 (14.25%) Architect
6 98 (12.69%) Analyst
7 80 (10.36%) Principal Software Engineer
8 64 (8.29%) Software Architect
9 53 (6.87%) Business Analyst
10 46 (5.96%) Test Engineer
11 42 (5.44%) Senior Software Test Engineer
11 42 (5.44%) Senior Test Engineer
11 42 (5.44%) Software Test Engineer
12 40 (5.18%) Lead
13 36 (4.66%) Senior Manager
14 33 (4.27%) Senior Software Engineer
15 32 (4.15%) Senior Analyst
16 31 (4.02%) Senior Project Manager
17 28 (3.63%) Test Analyst
18 26 (3.37%) Developer
Libraries, Frameworks & Software Standards
1 68 (8.81%) Middleware
2 21 (2.72%) .NET
3 10 (1.30%) CSS
3 10 (1.30%) HTML
3 10 (1.30%) React
4 9 (1.17%) AngularJS
5 8 (1.04%) .NET Framework
5 8 (1.04%) RESTful
5 8 (1.04%) XML
6 7 (0.91%) ASP.NET Web API
6 7 (0.91%) JSON
6 7 (0.91%) REST
6 7 (0.91%) SOAP
7 6 (0.78%) Bootstrap
7 6 (0.78%) Tailwind CSS
8 4 (0.52%) Kafka
8 4 (0.52%) NgRx
8 4 (0.52%) RxJS
9 3 (0.39%) ASP.NET
9 3 (0.39%) Web Services
Miscellaneous
1 26 (3.37%) Product Ownership
2 20 (2.59%) Management Information System
3 19 (2.46%) Data Centre
4 17 (2.20%) NHS
5 11 (1.42%) Self-Motivation
6 10 (1.30%) Virtual Team
7 9 (1.17%) PMI
8 8 (1.04%) Self-Driving Car
9 7 (0.91%) Cloud Native
10 6 (0.78%) Analytical Mindset
10 6 (0.78%) Social Media
11 5 (0.65%) Client/Server
11 5 (0.65%) Driving Licence
11 5 (0.65%) Greenfield Project
11 5 (0.65%) Legacy Systems
12 4 (0.52%) Legacy Applications
12 4 (0.52%) Marketing Technology
12 4 (0.52%) Reinsurance
13 3 (0.39%) Autonomous Agent
13 3 (0.39%) Onboarding
Operating Systems
1 12 (1.55%) Windows
2 6 (0.78%) Windows Vista
3 3 (0.39%) Linux
4 2 (0.26%) Android
4 2 (0.26%) Apple iOS
4 2 (0.26%) Windows Server
4 2 (0.26%) Windows Server 2019
5 1 (0.13%) AIX
5 1 (0.13%) CentOS
5 1 (0.13%) Debian
5 1 (0.13%) Unix
5 1 (0.13%) zOS
Processes & Methodologies
1 751 (97.28%) Agile
2 250 (32.38%) UML
3 247 (31.99%) Software Engineering
4 243 (31.48%) Computer Science
5 227 (29.40%) Project Management
6 216 (27.98%) SDLC
7 192 (24.87%) Configuration Management
8 176 (22.80%) Software Testing
9 154 (19.95%) Continuous Improvement
10 143 (18.52%) Project Delivery
11 130 (16.84%) DevOps
12 119 (15.41%) Mentoring
13 117 (15.16%) Stakeholder Management
14 115 (14.90%) Scrum
15 96 (12.44%) Test Automation
16 88 (11.40%) Problem-Solving
17 80 (10.36%) PRINCE2
18 68 (8.81%) Roadmaps
19 66 (8.55%) Open Source
20 64 (8.29%) Design Patterns
Programming Languages
1 85 (11.01%) Ada
2 57 (7.38%) SQL
3 36 (4.66%) Ada 95
4 26 (3.37%) Python
5 25 (3.24%) C#
5 25 (3.24%) JavaScript
6 18 (2.33%) Java
6 18 (2.33%) PowerShell
7 15 (1.94%) Bicep
8 9 (1.17%) C++
8 9 (1.17%) R
9 7 (0.91%) C
10 6 (0.78%) TypeScript
11 5 (0.65%) Bash
11 5 (0.65%) T-SQL
12 2 (0.26%) Go
13 1 (0.13%) ActionScript
13 1 (0.13%) ActionScript 2.0
13 1 (0.13%) PHP
13 1 (0.13%) VB.NET
Qualifications
1 406 (52.59%) Degree
2 297 (38.47%) BPSS Clearance
3 162 (20.98%) Chartered Engineer
4 74 (9.59%) Computer Science Degree
5 69 (8.94%) PMP
6 48 (6.22%) PMI Certification
7 30 (3.89%) Security Cleared
8 25 (3.24%) Azure Certification
9 24 (3.11%) DBS Check
10 22 (2.85%) SC Cleared
11 16 (2.07%) PRINCE2 Practitioner
12 13 (1.68%) ISTQB
13 6 (0.78%) Microsoft Certification
14 5 (0.65%) DV Cleared
14 5 (0.65%) ISEB
14 5 (0.65%) Master's Degree
15 4 (0.52%) CBAP
16 3 (0.39%) CISSP
16 3 (0.39%) IIBA
16 3 (0.39%) ITIL Certification
Quality Assurance & Compliance
1 172 (22.28%) ISO/IEC 12207
2 57 (7.38%) QA
3 43 (5.57%) PMO
4 13 (1.68%) Data Quality
5 7 (0.91%) ISO/IEC 27001
6 5 (0.65%) NCSC
7 4 (0.52%) GDPR
8 3 (0.39%) NIST
9 2 (0.26%) HIPAA
9 2 (0.26%) MiFID
10 1 (0.13%) Accessibility
10 1 (0.13%) Cyber Essentials
10 1 (0.13%) DICOM
10 1 (0.13%) HL7
10 1 (0.13%) ISO 9001
10 1 (0.13%) P3O
10 1 (0.13%) PCI DSS
10 1 (0.13%) SLA
10 1 (0.13%) SNOMED CT
System Software
1 15 (1.94%) Virtual Machines
2 6 (0.78%) Embedded Firmware
2 6 (0.78%) Firmware
3 2 (0.26%) Active Directory
3 2 (0.26%) Docker
4 1 (0.13%) Terminal Server
4 1 (0.13%) VMware ESXi
4 1 (0.13%) VMware Infrastructure
Systems Management
1 15 (1.94%) Single Sign-On
2 3 (0.39%) Microsoft Intune
2 3 (0.39%) SCOM
3 2 (0.26%) Ansible
3 2 (0.26%) HP Quality Center
3 2 (0.26%) SCCM
4 1 (0.13%) CA Service Virtualization
4 1 (0.13%) Kubernetes
4 1 (0.13%) Terraform
4 1 (0.13%) vCenter Server
Vendors
1 89 (11.53%) Siemens
2 73 (9.46%) Microsoft
3 29 (3.76%) Atlassian
4 28 (3.63%) IBM
5 22 (2.85%) Salesforce
6 21 (2.72%) Keysight
7 19 (2.46%) Databricks
8 15 (1.94%) Meraki
9 12 (1.55%) Oracle
10 11 (1.42%) Google
11 9 (1.17%) Cisco
12 8 (1.04%) SAP
12 8 (1.04%) ServiceNow
13 4 (0.52%) Siebel
14 3 (0.39%) VMware
15 2 (0.26%) Adobe
15 2 (0.26%) Facebook
15 2 (0.26%) Guidewire
15 2 (0.26%) Marketo
15 2 (0.26%) Planview