PropTech Jobs in England

PropTech (Property Technology)
UK > England

The table below looks at the prevalence of the term PropTech in permanent job vacancies advertised in England. Included is a benchmarking guide to the salaries offered in vacancies that have cited PropTech over the 6 months to 27 April 2024 with a comparison to the same period over the previous 2 years.

6 months to
27 Apr 2024
Same period 2023 Same period 2022
Rank 752 876 890
Rank change year-on-year +124 +14 -131
Permanent jobs citing PropTech 88 77 248
As % of all permanent jobs advertised in England 0.10% 0.083% 0.19%
As % of the Miscellaneous category 0.30% 0.19% 0.41%
Number of salaries quoted 82 68 111
10th Percentile £47,500 £50,125 £46,250
25th Percentile £52,500 £56,250 £51,406
Median annual salary (50th Percentile) £65,400 £72,500 £65,000
Median % change year-on-year -9.79% +11.54% -16.13%
75th Percentile £87,500 £91,250 £76,250
90th Percentile £102,875 £105,000 £85,000
UK median annual salary £65,400 £72,500 £65,000
% change year-on-year -9.79% +11.54% -13.33%

All Generic Skills
England

PropTech is in the General and Transferable Skills category. The following table is for comparison with the above and provides summary statistics for all permanent job vacancies advertised in England with a requirement for generic IT skills.

Permanent vacancies with a requirement for generic IT skills 29,443 40,387 60,488
As % of all permanent jobs advertised in England 34.72% 43.32% 46.27%
Number of salaries quoted 20,757 21,802 30,475
10th Percentile £28,000 £35,422 £34,500
25th Percentile £38,000 £46,650 £46,250
Median annual salary (50th Percentile) £55,000 £65,000 £62,500
Median % change year-on-year -15.38% +4.00% +4.17%
75th Percentile £75,000 £87,500 £85,000
90th Percentile £98,474 £110,000 £105,000
UK median annual salary £55,000 £65,000 £62,500
% change year-on-year -15.38% +4.00% +4.17%

PropTech
Job Vacancy Trend in England

Job postings citing PropTech as a proportion of all IT jobs advertised in England.
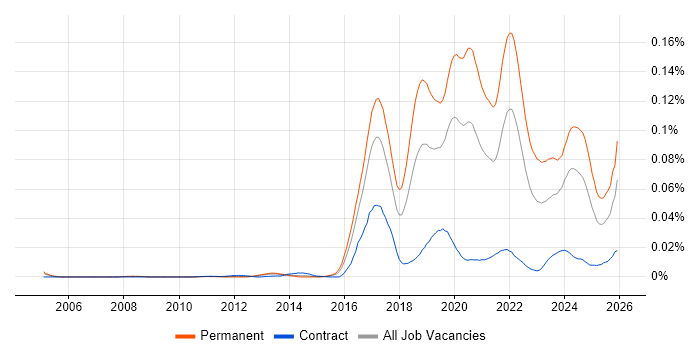
Job vacancy trend for PropTech in England

PropTech
Salary Trend in England

3-month moving average salary quoted in jobs citing PropTech in England.

Salary trend for PropTech in England

PropTech
Salary Histogram in England

Salary distribution for jobs citing PropTech in England over the 6 months to 27 April 2024.

Salary histogram for PropTech in England

PropTech
Job Locations in England

The table below looks at the demand and provides a guide to the median salaries quoted in IT jobs citing PropTech within the England region over the 6 months to 27 April 2024. The 'Rank Change' column provides an indication of the change in demand within each location based on the same 6 month period last year.

Location Rank Change
on Same Period
Last Year
Matching
Permanent
IT Job Ads
Median Salary
Past 6 Months
Median Salary
% Change
on Same Period
Last Year
Live
Jobs
London +130 49 £72,500 -3.33% 24
North of England +61 15 £55,000 +4.76% 7
North West +21 11 £55,000 +4.76% 6
South East +36 10 £87,500 +34.62% 4
Midlands +4 9 £65,050 -11.50% 4
West Midlands +20 6 £65,050 -5.04% 4
South West +2 5 £65,050 +18.27%
Yorkshire - 4 £65,050 - 1
East Midlands -12 3 £65,050 -27.72%
PropTech
UK

PropTech
Co-occurring Skills and Capabilities in England by Category

The follow tables expand on the table above by listing co-occurrences grouped by category. The same employment type, locality and period is covered with up to 20 co-occurrences shown in each of the following categories:

Application Platforms
1 2 (2.27%) nginx
2 1 (1.14%) Apache Airflow
2 1 (1.14%) CMS
2 1 (1.14%) SharePoint
Applications
1 2 (2.27%) Microsoft Excel
2 1 (1.14%) Microsoft Office
2 1 (1.14%) Microsoft PowerPoint
2 1 (1.14%) MS Visio
Business Applications
1 1 (1.14%) Maximo
Cloud Services
1 24 (27.27%) AWS
2 16 (18.18%) GCP
3 7 (7.95%) Azure
3 7 (7.95%) Cloud Computing
4 5 (5.68%) SaaS
5 3 (3.41%) Power Platform
6 2 (2.27%) Amazon CloudWatch
6 2 (2.27%) Amazon EC2
6 2 (2.27%) Amazon GuardDuty
6 2 (2.27%) Amazon S3
6 2 (2.27%) AWS CloudFormation
6 2 (2.27%) AWS CloudTrail
6 2 (2.27%) AWS Lambda
6 2 (2.27%) Azure Data Factory
6 2 (2.27%) Azure Synapse Analytics
6 2 (2.27%) dbt
6 2 (2.27%) Kong
6 2 (2.27%) Serverless
6 2 (2.27%) Virtual Private Cloud
7 1 (1.14%) Amazon ECS
Communications & Networking
1 11 (12.50%) Wi-Fi
2 6 (6.82%) WAN
3 5 (5.68%) Software-Defined Networking
3 5 (5.68%) Wireless
4 2 (2.27%) DNS
4 2 (2.27%) HTTP
4 2 (2.27%) TCP/IP
5 1 (1.14%) Firewall
5 1 (1.14%) LAN
5 1 (1.14%) Network Security
5 1 (1.14%) VPN
Database & Business Intelligence
1 16 (18.18%) MySQL
2 15 (17.05%) CouchDB
2 15 (17.05%) Elasticsearch
3 3 (3.41%) Power BI
4 2 (2.27%) Amazon RDS
4 2 (2.27%) Looker
4 2 (2.27%) SQL Server
5 1 (1.14%) BigQuery
5 1 (1.14%) Data Lake
5 1 (1.14%) Data Warehouse
5 1 (1.14%) Oracle Reports
5 1 (1.14%) SQL Server Integration Services
5 1 (1.14%) Tableau
Development Applications
1 8 (9.09%) Gradle
2 6 (6.82%) JUnit
2 6 (6.82%) Mockito
3 1 (1.14%) SoapUI
3 1 (1.14%) Team Foundation Server
3 1 (1.14%) Visual Studio
General
1 61 (69.32%) Social Skills
2 12 (13.64%) Inclusion and Diversity
3 6 (6.82%) Organisational Skills
4 5 (5.68%) Finance
5 3 (3.41%) Analytical Skills
5 3 (3.41%) Local Government
5 3 (3.41%) Retail
6 2 (2.27%) Legal
7 1 (1.14%) Influencing Skills
7 1 (1.14%) Presentation Skills
Job Titles
1 30 (34.09%) Senior
2 29 (32.95%) Developer
3 17 (19.32%) Senior Developer
4 13 (14.77%) Lead
5 11 (12.50%) Java Developer
6 10 (11.36%) Architect
6 10 (11.36%) PHP Developer
6 10 (11.36%) Senior PHP Developer
7 8 (9.09%) Technical Architect
8 7 (7.95%) Senior Architect
8 7 (7.95%) Senior Technical Architect
8 7 (7.95%) Software Engineer
9 6 (6.82%) Agile Development Manager
9 6 (6.82%) Development Manager
9 6 (6.82%) Java Development Manager
9 6 (6.82%) Java Engineer
9 6 (6.82%) Java Software Engineer
9 6 (6.82%) Lead Software Engineer
9 6 (6.82%) Software Development Manager
9 6 (6.82%) Software Manager
Libraries, Frameworks & Software Standards
1 15 (17.05%) Kafka
1 15 (17.05%) Spring Boot
2 10 (11.36%) Laravel
3 8 (9.09%) Hibernate
4 7 (7.95%) Spring
5 6 (6.82%) Android Jetpack
5 6 (6.82%) Jetpack Compose
6 4 (4.55%) Cocoa
6 4 (4.55%) Cocoa Touch
6 4 (4.55%) Core Animation
6 4 (4.55%) Core Data
7 2 (2.27%) .NET
7 2 (2.27%) ARM Templates
7 2 (2.27%) Next.js
7 2 (2.27%) PySpark
7 2 (2.27%) React
7 2 (2.27%) RESTful
8 1 (1.14%) CSS
8 1 (1.14%) HTML
8 1 (1.14%) NestJS
Miscellaneous
1 34 (38.64%) Client/Server
2 20 (22.73%) Product Ownership
3 7 (7.95%) Onboarding
4 5 (5.68%) Public Cloud
5 4 (4.55%) Animation
6 3 (3.41%) Data Centre
7 2 (2.27%) Distributed Systems
7 2 (2.27%) Greenfield Project
7 2 (2.27%) Hybrid Cloud
8 1 (1.14%) Analytical Mindset
8 1 (1.14%) IoT
8 1 (1.14%) Self-Motivation
Operating Systems
1 10 (11.36%) Android
1 10 (11.36%) Apple iOS
2 2 (2.27%) Linux
3 1 (1.14%) Windows
Processes & Methodologies
1 51 (57.95%) Problem-Solving
2 47 (53.41%) Agile
3 37 (42.05%) TDD
4 30 (34.09%) Mentoring
5 27 (30.68%) Software Engineering
6 21 (23.86%) Continuous Improvement
7 17 (19.32%) Decision-Making
8 16 (18.18%) Roadmaps
9 15 (17.05%) E-Commerce
9 15 (17.05%) Microservices
10 12 (13.64%) Service Delivery
10 12 (13.64%) User Research
11 11 (12.50%) Infrastructure as Code
12 10 (11.36%) Stakeholder Management
12 10 (11.36%) Technical Architecture
13 9 (10.23%) OOP
13 9 (10.23%) Supplier Management
14 7 (7.95%) Project Management
14 7 (7.95%) Technical Debt
15 6 (6.82%) CI/CD
Programming Languages
1 26 (29.55%) Java
2 19 (21.59%) SQL
3 12 (13.64%) Python
4 10 (11.36%) PHP
5 6 (6.82%) Kotlin
6 4 (4.55%) Bash
6 4 (4.55%) Swift
7 2 (2.27%) Bicep
7 2 (2.27%) C#
7 2 (2.27%) Go
7 2 (2.27%) JavaScript
7 2 (2.27%) TypeScript
8 1 (1.14%) T-SQL
Qualifications
1 5 (5.68%) CCIE
1 5 (5.68%) Cisco Certification
2 3 (3.41%) APMG
2 3 (3.41%) CITP
3 2 (2.27%) AWS Certification
4 1 (1.14%) Degree
4 1 (1.14%) Numerate Degree
Quality Assurance & Compliance
1 15 (17.05%) QA
2 3 (3.41%) PMO
3 2 (2.27%) ISO/IEC 27001
3 2 (2.27%) NIST
4 1 (1.14%) SLA
System Software
1 19 (21.59%) Docker
Systems Management
1 18 (20.45%) Kubernetes
2 10 (11.36%) Terraform
3 1 (1.14%) Cisco Prime
Vendors
1 6 (6.82%) Cisco
1 6 (6.82%) Google
2 5 (5.68%) Meraki
2 5 (5.68%) Palo Alto
3 3 (3.41%) Databricks
3 3 (3.41%) Microsoft
4 2 (2.27%) F5
5 1 (1.14%) Oracle
5 1 (1.14%) SolarWinds