Software Developer Jobs in England

Software Developer
UK > England

The median Software Developer salary in England is £57,500 per year, according to job vacancies posted during the 6 months leading to 2 May 2025.

The table below provides salary benchmarking and summary statistics, comparing them to the same period in the previous two years.

6 months to
2 May 2025
Same period 2024 Same period 2023
Rank 165 145 194
Rank change year-on-year -20 +49 -45
Permanent jobs requiring a Software Developer 852 1,726 1,783
As % of all permanent jobs advertised in England 1.85% 2.03% 1.93%
As % of the Job Titles category 2.05% 2.14% 2.10%
Number of salaries quoted 318 1,503 1,396
10th Percentile £41,000 £35,000 £38,625
25th Percentile £46,250 £41,250 £46,244
Median annual salary (50th Percentile) £57,500 £53,500 £57,500
Median % change year-on-year +7.48% -6.96% +4.55%
75th Percentile £80,000 £68,750 £77,500
90th Percentile £122,500 £91,934 £95,000
UK median annual salary £56,000 £52,500 £55,000
% change year-on-year +6.67% -4.55% -

All Permanent IT Job Vacancies
England

For comparison with the information above, the following table provides summary statistics for all permanent IT job vacancies in England. Most job vacancies include a discernible job title that can be normalized. As such, the figures in the second row provide an indication of the number of permanent jobs in our overall sample.

Permanent vacancies in England with a recognized job title 41,555 80,517 84,778
% of permanent jobs with a recognized job title 90.29% 94.48% 91.54%
Number of salaries quoted 24,558 60,256 53,687
10th Percentile £30,000 £28,500 £32,626
25th Percentile £42,415 £38,250 £45,000
Median annual salary (50th Percentile) £57,500 £54,000 £60,775
Median % change year-on-year +6.48% -11.15% +1.29%
75th Percentile £75,000 £71,991 £82,500
90th Percentile £97,500 £91,250 £100,000
UK median annual salary £57,500 £52,900 £60,000
% change year-on-year +8.70% -11.83% -

Software Developer
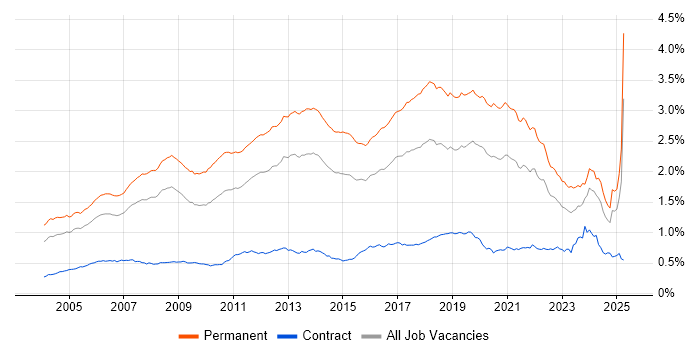
Job Vacancy Trend in England

Job postings that featured Software Developer in the job title as a proportion of all IT jobs advertised in England.

Job vacancy trend for Software Developer in England

Software Developer
Salary Trend in England

3-month moving average salary quoted in jobs citing Software Developer in England.

Salary trend for Software Developer in England

Software Developer
Salary Histogram in England

Salary distribution for jobs citing Software Developer in England over the 6 months to 2 May 2025.

Salary histogram for Software Developer in England

Software Developer
Job Locations in England

The table below looks at the demand and provides a guide to the median salaries quoted in IT jobs citing Software Developer within the England region over the 6 months to 2 May 2025. The 'Rank Change' column provides an indication of the change in demand within each location based on the same 6 month period last year.

Location Rank Change
on Same Period
Last Year
Matching
Permanent
IT Job Ads
Median Salary
Past 6 Months
Median Salary
% Change
on Same Period
Last Year
Live
Jobs
North of England +61 462 £41,000 -17.17% 115
North West +60 431 £41,000 -18.00% 76
London -12 116 £110,000 +29.41% 73
South East -44 111 £55,283 -7.86% 103
Midlands -98 57 £56,250 +18.42% 91
South West -37 54 £60,000 +20.00% 41
East of England -42 41 £53,000 +6.00% 57
West Midlands -66 36 £60,000 +20.00% 49
Yorkshire -8 25 £49,500 +4.21% 27
East Midlands -28 21 £55,000 +25.00% 41
North East +18 6 £81,250 +80.56% 14
Software Developer
UK

Software Developer Skill Set
Top 30 Co-occurring Skills and Capabilities in England

For the 6 months to 2 May 2025, Software Developer job roles required the following skills and capabilities in order of popularity. The figures indicate the absolute number co-occurrences and as a proportion of all permanent job ads across the England region featuring Software Developer in the job title.

1 594 (69.72%) Agile
2 554 (65.02%) Java
3 545 (63.97%) Python
4 493 (57.86%) C++
5 490 (57.51%) OOP
6 484 (56.81%) Docker
7 481 (56.46%) OO
8 468 (54.93%) Mathematics
9 467 (54.81%) Design Patterns
10 465 (54.58%) Linux
11 462 (54.23%) Security Cleared
12 457 (53.64%) Finance
13 456 (53.52%) Analytical Skills
14 455 (53.40%) DV Cleared
15 454 (53.29%) Android
15 454 (53.29%) Line Management
16 453 (53.17%) Go
16 453 (53.17%) Android Development
17 448 (52.58%) Inclusion and Diversity
18 446 (52.35%) Ansible
18 446 (52.35%) Cyberattack
19 397 (46.60%) VPN
19 397 (46.60%) DNS
20 220 (25.82%) C#
21 207 (24.30%) .NET
22 164 (19.25%) Software Engineering
23 145 (17.02%) Azure
23 145 (17.02%) AWS
24 144 (16.90%) JavaScript
25 134 (15.73%) SQL

Software Developer Skill Set
Co-occurring Skills and Capabilities in England by Category

The follow tables expand on the table above by listing co-occurrences grouped by category. The same employment type, locality and period is covered with up to 20 co-occurrences shown in each of the following categories:

Application Platforms
1 33 (3.87%) Apache
2 32 (3.76%) Apache Airflow
3 9 (1.06%) SharePoint
4 4 (0.47%) NServiceBus
5 3 (0.35%) CMS
5 3 (0.35%) OpenEdge
6 2 (0.23%) Confluence
6 2 (0.23%) WordPress
7 1 (0.12%) DNN
7 1 (0.12%) Ethereum
7 1 (0.12%) Headless CMS
7 1 (0.12%) Kentico
7 1 (0.12%) Microsoft Exchange
7 1 (0.12%) Sitecore CMS
7 1 (0.12%) Sitefinity
7 1 (0.12%) Umbraco
Applications
1 7 (0.82%) Revit
2 6 (0.70%) Chatbot
3 3 (0.35%) Microsoft Excel
3 3 (0.35%) Microsoft Office
4 2 (0.23%) Trello
5 1 (0.12%) AutoCAD
Business Applications
1 6 (0.70%) Magento
2 5 (0.59%) Infor CloudSuite
2 5 (0.59%) Infor CloudSuite Industrial (formerly SyteLine)
2 5 (0.59%) Shopify
3 3 (0.35%) Orchestrade
4 2 (0.23%) Dynamics GP
4 2 (0.23%) SAP Business One
5 1 (0.12%) Dynamics CRM
5 1 (0.12%) Teamcenter
Cloud Services
1 145 (17.02%) AWS
1 145 (17.02%) Azure
2 49 (5.75%) Amazon EKS
2 49 (5.75%) AWS CloudFormation
3 34 (3.99%) Serverless
4 32 (3.76%) dbt
4 32 (3.76%) Snowflake
5 28 (3.29%) Power Platform
6 26 (3.05%) AWS Lambda
6 26 (3.05%) Azure DevOps
7 24 (2.82%) GitHub
8 13 (1.53%) SaaS
9 10 (1.17%) GCP
10 9 (1.06%) GitHub Actions
11 6 (0.70%) Amazon S3
12 5 (0.59%) Azure Functions
12 5 (0.59%) Azure Service Bus
12 5 (0.59%) BigCommerce
12 5 (0.59%) Power Automate
13 4 (0.47%) PowerApps
Communications & Networking
1 397 (46.60%) DNS
1 397 (46.60%) VPN
2 7 (0.82%) TCP/IP
3 6 (0.70%) Ethernet
4 4 (0.47%) 3GPP
4 4 (0.47%) 5G
5 3 (0.35%) Multicast
6 2 (0.23%) Wireless
7 1 (0.12%) Bluetooth
7 1 (0.12%) HTTPS
7 1 (0.12%) MQTT
7 1 (0.12%) Network Security
Database & Business Intelligence
1 130 (15.26%) SQL Server
2 55 (6.46%) Elasticsearch
3 32 (3.76%) Amazon Athena
3 32 (3.76%) Apache Arrow
3 32 (3.76%) Apache Iceberg
3 32 (3.76%) Dremio
4 28 (3.29%) NoSQL
5 27 (3.17%) MySQL
6 22 (2.58%) DynamoDB
7 16 (1.88%) MongoDB
7 16 (1.88%) Power BI
8 13 (1.53%) PostgreSQL
9 12 (1.41%) Relational Database
10 7 (0.82%) SQL Server Reporting Services
11 4 (0.47%) Data Lake
12 3 (0.35%) Azure SQL Database
12 3 (0.35%) Crystal Reports
12 3 (0.35%) MS Access
12 3 (0.35%) RDBMS
13 2 (0.23%) SAP HANA
Development Applications
1 39 (4.58%) Git
2 14 (1.64%) JIRA
2 14 (1.64%) MagicDraw
3 8 (0.94%) Visual Studio
4 6 (0.70%) Gradle
4 6 (0.70%) Maven
4 6 (0.70%) Octopus Deploy
4 6 (0.70%) TeamCity
5 4 (0.47%) Cypress.io
5 4 (0.47%) Jenkins
5 4 (0.47%) Selenium
6 3 (0.35%) Bitbucket
6 3 (0.35%) GitLab
6 3 (0.35%) Subversion
7 2 (0.23%) CircleCI
7 2 (0.23%) Gatling
7 2 (0.23%) GDB
7 2 (0.23%) JMeter
7 2 (0.23%) NUnit
7 2 (0.23%) REST Assured
General
1 457 (53.64%) Finance
2 456 (53.52%) Analytical Skills
3 448 (52.58%) Inclusion and Diversity
4 81 (9.51%) Social Skills
5 52 (6.10%) Banking
6 39 (4.58%) Investment Banking
7 38 (4.46%) Front Office
8 20 (2.35%) Tech for Good
9 17 (2.00%) Manufacturing
10 16 (1.88%) Law
11 14 (1.64%) Retail
12 12 (1.41%) Organisational Skills
13 11 (1.29%) Electronics
14 10 (1.17%) Health Technology
14 10 (1.17%) Publishing
15 8 (0.94%) Social Housing
16 6 (0.70%) Games
17 5 (0.59%) Telecoms
18 4 (0.47%) Automotive
18 4 (0.47%) Presentation Skills
Libraries, Frameworks & Software Standards
1 207 (24.30%) .NET
2 95 (11.15%) Node.js
3 87 (10.21%) React
4 55 (6.46%) ASP.NET
5 51 (5.99%) .NET Core
6 49 (5.75%) Pandas
7 48 (5.63%) HTML
8 44 (5.16%) .NET Framework
9 42 (4.93%) AngularJS
10 32 (3.76%) PySpark
11 30 (3.52%) CSS
12 29 (3.40%) RESTful
13 24 (2.82%) XML
14 22 (2.58%) Entity Framework
15 21 (2.46%) GraphQL
16 18 (2.11%) WPF
17 13 (1.53%) Web Services
18 12 (1.41%) HTML5
18 12 (1.41%) REST
19 11 (1.29%) ASP.NET MVC
Miscellaneous
1 446 (52.35%) Cyberattack
2 39 (4.58%) Foreign Exchange (FX)
3 36 (4.23%) Derivative
4 35 (4.11%) Fixed Income
4 35 (4.11%) Hedge funds
5 32 (3.76%) Equities
6 27 (3.17%) Management Information System
7 22 (2.58%) Algorithms
8 15 (1.76%) Cloud Native
8 15 (1.76%) Legacy Systems
9 14 (1.64%) Self-Motivation
10 12 (1.41%) Greenfield Project
11 11 (1.29%) Data Structures
11 11 (1.29%) Enterprise Software
11 11 (1.29%) IoT
12 7 (0.82%) Mobile App
12 7 (0.82%) Product Ownership
12 7 (0.82%) Smart Home
13 6 (0.70%) Distributed Systems
13 6 (0.70%) Mobile Games
Operating Systems
1 465 (54.58%) Linux
2 454 (53.29%) Android
3 15 (1.76%) Windows
4 5 (0.59%) Apple iOS
4 5 (0.59%) Debian
5 2 (0.23%) Mac OS
5 2 (0.23%) Unix
Processes & Methodologies
1 594 (69.72%) Agile
2 490 (57.51%) OOP
3 481 (56.46%) OO
4 468 (54.93%) Mathematics
5 467 (54.81%) Design Patterns
6 454 (53.29%) Line Management
7 453 (53.17%) Android Development
8 164 (19.25%) Software Engineering
9 99 (11.62%) CI/CD
10 95 (11.15%) Problem-Solving
11 74 (8.69%) Computer Science
12 69 (8.10%) Secure Coding
13 68 (7.98%) Kanban
14 63 (7.39%) Containerisation
15 61 (7.16%) Collaborative Working
16 57 (6.69%) Full-Stack Development
17 55 (6.46%) OWASP
18 52 (6.10%) Test Automation
19 49 (5.75%) DevOps
19 49 (5.75%) Statistics
Programming Languages
1 554 (65.02%) Java
2 545 (63.97%) Python
3 493 (57.86%) C++
4 453 (53.17%) Go
5 220 (25.82%) C#
6 144 (16.90%) JavaScript
7 134 (15.73%) SQL
8 92 (10.80%) TypeScript
9 56 (6.57%) Rust
10 11 (1.29%) VB.NET
11 10 (1.17%) C
11 10 (1.17%) PHP
12 9 (1.06%) Kotlin
13 8 (0.94%) Delphi
14 7 (0.82%) XAML
15 5 (0.59%) PowerShell
16 4 (0.47%) T-SQL
17 2 (0.23%) Fortran
17 2 (0.23%) Haskell
17 2 (0.23%) Ruby
Qualifications
1 462 (54.23%) Security Cleared
2 455 (53.40%) DV Cleared
3 127 (14.91%) Degree
4 45 (5.28%) Computer Science Degree
5 14 (1.64%) BPSS Clearance
6 10 (1.17%) PhD
7 8 (0.94%) Master's Degree
7 8 (0.94%) SC Cleared
8 6 (0.70%) AWS Certification
8 6 (0.70%) AWS Certified Solutions Architect
9 3 (0.35%) Numerate Degree
10 1 (0.12%) DBS Check
Quality Assurance & Compliance
1 26 (3.05%) QA
2 4 (0.47%) Accessibility
2 4 (0.47%) NCSC
3 1 (0.12%) GDPR
3 1 (0.12%) HL7
3 1 (0.12%) IEC 62304
3 1 (0.12%) ISO 13485
System Software
1 484 (56.81%) Docker
2 2 (0.23%) Active Directory
3 1 (0.12%) Firmware
Systems Management
1 446 (52.35%) Ansible
2 80 (9.39%) Kubernetes
3 49 (5.75%) Terraform
4 6 (0.70%) Argo
4 6 (0.70%) Prometheus
5 1 (0.12%) Grafana
5 1 (0.12%) Kibana
Vendors
1 40 (4.69%) Microsoft
2 39 (4.58%) Oracle
3 7 (0.82%) Google
4 6 (0.70%) New Relic
4 6 (0.70%) PayPal
5 5 (0.59%) Infor
6 4 (0.47%) Databricks
7 2 (0.23%) SAP
8 1 (0.12%) Atlassian
8 1 (0.12%) Barracuda Networks
8 1 (0.12%) Cisco
8 1 (0.12%) Intel
8 1 (0.12%) MuleSoft
8 1 (0.12%) Progress
8 1 (0.12%) Sitecore
8 1 (0.12%) Telerik
8 1 (0.12%) WooCommerce
8 1 (0.12%) Xamarin