Infrastructure as Code Jobs in England

Infrastructure as Code (IaC, Infra as Code)
UK > England

The table below provides summary statistics for permanent job vacancies advertised in England requiring Infrastructure as Code skills. It includes a benchmarking guide to the annual salaries offered in vacancies that cited Infrastructure as Code over the 6 months leading up to 12 July 2025, comparing them to the same period in the previous two years.

6 months to
12 Jul 2025
Same period 2024 Same period 2023
Rank 149 163 97
Rank change year-on-year +14 -66 -4
Permanent jobs citing Infrastructure as Code 1,171 1,537 2,511
As % of all permanent jobs advertised in England 2.23% 1.71% 3.31%
As % of the Processes & Methodologies category 2.47% 2.06% 3.47%
Number of salaries quoted 654 1,160 1,664
10th Percentile £52,500 £47,500 £48,750
25th Percentile £62,500 £57,500 £58,750
Median annual salary (50th Percentile) £77,500 £70,000 £75,000
Median % change year-on-year +10.71% -6.67% +0.55%
75th Percentile £96,250 £87,500 £93,750
90th Percentile £110,000 £105,000 £109,865
UK median annual salary £77,500 £70,000 £75,000
% change year-on-year +10.71% -6.67% +3.45%

All Process and Methodology Skills
England

Infrastructure as Code falls under the Processes and Methodologies category. For comparison with the information above, the following table provides summary statistics for all permanent job vacancies requiring process or methodology skills in England.

Permanent vacancies with a requirement for process or methodology skills 47,411 74,454 72,431
As % of all permanent jobs advertised in England 90.35% 82.68% 95.47%
Number of salaries quoted 25,113 52,266 47,291
10th Percentile £28,500 £29,750 £33,750
25th Percentile £39,750 £40,000 £45,000
Median annual salary (50th Percentile) £55,000 £55,000 £62,500
Median % change year-on-year - -12.00% +4.17%
75th Percentile £75,000 £73,750 £81,500
90th Percentile £97,500 £93,750 £102,500
UK median annual salary £55,000 £55,000 £60,249
% change year-on-year - -8.71% +0.42%

Infrastructure as Code
Job Vacancy Trend in England

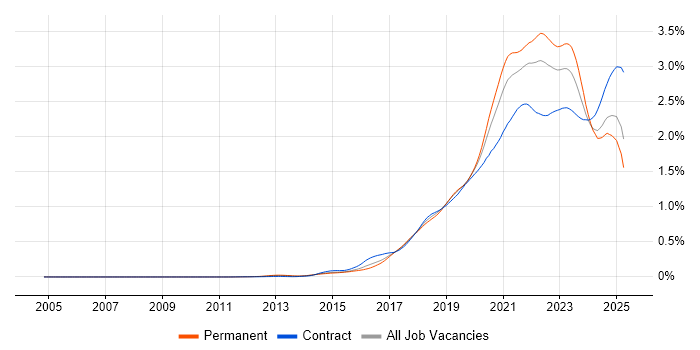
Job postings citing Infrastructure as Code as a proportion of all IT jobs advertised in England.

Job vacancy trend for Infrastructure as Code in England

Infrastructure as Code
Salary Trend in England

3-month moving average salary quoted in jobs citing Infrastructure as Code in England.

Salary trend for Infrastructure as Code in England

Infrastructure as Code
Salary Histogram in England

Salary distribution for jobs citing Infrastructure as Code in England over the 6 months to 12 July 2025.

Salary histogram for Infrastructure as Code in England

Infrastructure as Code
Job Locations in England

The table below looks at the demand and provides a guide to the median salaries quoted in IT jobs citing Infrastructure as Code within the England region over the 6 months to 12 July 2025. The 'Rank Change' column provides an indication of the change in demand within each location based on the same 6 month period last year.

Location Rank Change
on Same Period
Last Year
Matching
Permanent
IT Job Ads
Median Salary
Past 6 Months
Median Salary
% Change
on Same Period
Last Year
Live
Jobs
London +64 577 £90,000 +2.86% 428
North of England -61 160 £70,000 +11.50% 200
South East +44 142 £77,500 +29.17% 186
North West -63 98 £72,500 +11.54% 110
Midlands -12 64 £65,000 - 93
East of England +44 55 £62,500 -7.41% 61
South West -14 55 £70,000 - 94
Yorkshire -10 53 £70,000 +16.67% 70
West Midlands +8 44 £65,000 -7.14% 66
East Midlands +6 20 £65,000 +13.04% 26
North East +10 9 £65,000 +3.53% 20
Infrastructure as Code
UK

Infrastructure as Code
Co-occurring Skills and Capabilities in England by Category

The follow tables expand on the table above by listing co-occurrences grouped by category. The same employment type, locality and period is covered with up to 20 co-occurrences shown in each of the following categories:

Application Platforms
1 32 (2.73%) Apache Spark
2 23 (1.96%) SharePoint
3 22 (1.88%) Apache Airflow
4 21 (1.79%) Apache
5 19 (1.62%) Confluence
6 12 (1.02%) nginx
7 10 (0.85%) Microsoft Exchange
8 7 (0.60%) Appian
9 5 (0.43%) IIS
9 5 (0.43%) OpenStack
10 4 (0.34%) IBM Domino
10 4 (0.34%) Traefik
11 3 (0.26%) CMS
11 3 (0.26%) WordPress
12 1 (0.085%) CICS
12 1 (0.085%) Headless CMS
12 1 (0.085%) SAS
Applications
1 6 (0.51%) Microsoft Office
2 5 (0.43%) Microsoft Excel
2 5 (0.43%) Microsoft PowerPoint
3 4 (0.34%) Adobe XD
3 4 (0.34%) Sketch
4 3 (0.26%) MS Visio
5 2 (0.17%) Simulink
6 1 (0.085%) Microsoft Project
Business Applications
1 19 (1.62%) Dynamics CRM
2 4 (0.34%) Payment Gateway
Cloud Services
1 762 (65.07%) AWS
2 564 (48.16%) Azure
3 234 (19.98%) Pulumi
4 210 (17.93%) GCP
5 171 (14.60%) Azure DevOps
6 137 (11.70%) Serverless
7 135 (11.53%) AWS CloudFormation
8 130 (11.10%) GitHub
9 98 (8.37%) AWS Lambda
10 97 (8.28%) SaaS
11 86 (7.34%) Amazon S3
12 83 (7.09%) PaaS
13 75 (6.40%) Entra ID
14 73 (6.23%) Amazon EC2
15 71 (6.06%) Amazon EKS
15 71 (6.06%) Azure Monitor
16 66 (5.64%) GitHub Actions
17 64 (5.47%) IaaS
18 53 (4.53%) Microsoft 365
19 47 (4.01%) Amazon CloudWatch
Communications & Networking
1 215 (18.36%) Broadband
2 88 (7.51%) Firewall
3 67 (5.72%) DNS
4 62 (5.29%) VPN
5 53 (4.53%) WAN
6 39 (3.33%) Network Security
7 29 (2.48%) LAN
8 27 (2.31%) SD-WAN
9 13 (1.11%) DHCP
9 13 (1.11%) TCP/IP
10 11 (0.94%) SAN
11 10 (0.85%) Internet
11 10 (0.85%) Kerberos
12 7 (0.60%) NAS
12 7 (0.60%) Reverse Proxy
12 7 (0.60%) Wi-Fi
13 6 (0.51%) VLAN
14 5 (0.43%) BGP
15 4 (0.34%) ICMP
15 4 (0.34%) OSPF
Database & Business Intelligence
1 270 (23.06%) NoSQL
2 227 (19.39%) Relational Database
3 216 (18.45%) RDBMS
4 54 (4.61%) SQL Server
5 47 (4.01%) Data Lake
6 44 (3.76%) Amazon RDS
7 41 (3.50%) DynamoDB
8 34 (2.90%) Big Data
9 33 (2.82%) MySQL
10 27 (2.31%) Power BI
11 21 (1.79%) Data Warehouse
11 21 (1.79%) PostgreSQL
12 20 (1.71%) Amazon Athena
13 16 (1.37%) MongoDB
14 15 (1.28%) Hadoop
15 14 (1.20%) Amazon Redshift
16 12 (1.02%) BigQuery
17 10 (0.85%) Tableau
18 9 (0.77%) Azure SQL Database
19 8 (0.68%) Amazon Aurora
Development Applications
1 215 (18.36%) Jaeger
2 128 (10.93%) Jenkins
3 121 (10.33%) Git
4 117 (9.99%) GitLab
5 34 (2.90%) SonarQube
6 33 (2.82%) JIRA
7 31 (2.65%) Sonatype Nexus
8 25 (2.13%) JUnit
9 21 (1.79%) CircleCI
10 19 (1.62%) Maven
10 19 (1.62%) TeamCity
11 17 (1.45%) Cucumber
12 16 (1.37%) Bitbucket
13 14 (1.20%) Mockito
13 14 (1.20%) Octopus Deploy
14 11 (0.94%) Selenium
15 10 (0.85%) IntelliJ
16 9 (0.77%) Spinnaker
17 8 (0.68%) Robot Framework
18 7 (0.60%) Snyk
General
1 312 (26.64%) Inclusion and Diversity
2 291 (24.85%) Finance
3 287 (24.51%) Social Skills
4 99 (8.45%) Law
5 96 (8.20%) Banking
6 51 (4.36%) Analytical Skills
7 35 (2.99%) Marketing
8 31 (2.65%) Public Sector
9 23 (1.96%) Retail
10 21 (1.79%) Advertising
10 21 (1.79%) Back Office
10 21 (1.79%) Legal
11 16 (1.37%) Telecoms
12 15 (1.28%) Automotive
13 11 (0.94%) Investment Banking
14 10 (0.85%) Front Office
15 9 (0.77%) Financial Institution
15 9 (0.77%) Presentation Skills
16 5 (0.43%) Electronics
16 5 (0.43%) Manufacturing
Job Titles
1 374 (31.94%) Lead
2 224 (19.13%) Team Leader
3 181 (15.46%) Senior
4 157 (13.41%) Cloud Engineer
5 137 (11.70%) DevOps Engineer
6 118 (10.08%) Architect
7 93 (7.94%) Azure Engineer
8 91 (7.77%) Platform Engineer
9 90 (7.69%) Software Engineer
10 68 (5.81%) AWS Engineer
11 65 (5.55%) Cloud Architect
12 64 (5.47%) Developer
13 56 (4.78%) Infrastructure Engineer
14 51 (4.36%) Data Engineer
15 47 (4.01%) Senior Cloud Engineer
16 44 (3.76%) Python Engineer
17 43 (3.67%) AWS DevOps
18 41 (3.50%) Senior DevOps
19 34 (2.90%) Site Reliability Engineer
20 31 (2.65%) Cloud Infrastructure Engineer
Libraries, Frameworks & Software Standards
1 251 (21.43%) Elastic Stack
2 218 (18.62%) OpenTelemetry
3 96 (8.20%) .NET
4 73 (6.23%) Kafka
5 60 (5.12%) React
6 58 (4.95%) ARM Templates
7 55 (4.70%) REST
8 47 (4.01%) Spring
9 42 (3.59%) Spring Boot
10 40 (3.42%) RESTful
11 34 (2.90%) YAML
12 31 (2.65%) Node.js
13 27 (2.31%) .NET Core
14 25 (2.13%) .NET Framework
15 18 (1.54%) AngularJS
16 17 (1.45%) OAuth
17 16 (1.37%) AWS CDK
17 16 (1.37%) gRPC
18 15 (1.28%) GraphQL
18 15 (1.28%) Loki
Miscellaneous
1 193 (16.48%) Cloud Native
2 88 (7.51%) Public Cloud
3 58 (4.95%) Hybrid Cloud
4 50 (4.27%) Management Information System
5 42 (3.59%) Data Centre
6 40 (3.42%) Product Ownership
7 39 (3.33%) Distributed Systems
8 25 (2.13%) Legacy Systems
9 23 (1.96%) Greenfield Project
10 21 (1.79%) Onboarding
11 19 (1.62%) Enterprise Software
11 19 (1.62%) Private Cloud
12 17 (1.45%) NHS
13 16 (1.37%) Distributed Architecture
14 15 (1.28%) Data Structures
14 15 (1.28%) Hedge funds
14 15 (1.28%) PKI
15 14 (1.20%) Virtual Team
16 12 (1.02%) Security Posture
17 11 (0.94%) Algorithms
Operating Systems
1 400 (34.16%) Linux
2 235 (20.07%) Unix
3 103 (8.80%) Windows
4 58 (4.95%) Windows Server
5 29 (2.48%) Red Hat Enterprise Linux
6 8 (0.68%) Ubuntu
6 8 (0.68%) VMS
7 7 (0.60%) Android
7 7 (0.60%) Apple iOS
7 7 (0.60%) CentOS
7 7 (0.60%) Debian
7 7 (0.60%) Windows Server 2019
8 4 (0.34%) Mac OS
9 2 (0.17%) AIX
9 2 (0.17%) Windows 10
9 2 (0.17%) Windows Server 2016
10 1 (0.085%) Amazon Linux
10 1 (0.085%) Solaris
10 1 (0.085%) zOS
Processes & Methodologies
1 834 (71.22%) DevOps
2 656 (56.02%) CI/CD
3 506 (43.21%) Agile
4 477 (40.73%) Containerisation
5 362 (30.91%) Mentoring
6 333 (28.44%) Roadmaps
7 306 (26.13%) High Availability
8 276 (23.57%) Continuous Integration
9 269 (22.97%) Performance Optimisation
10 254 (21.69%) Resource Management
11 249 (21.26%) Cost Optimisation
12 242 (20.67%) Task Automation
13 236 (20.15%) Product Management
14 231 (19.73%) GitOps
15 215 (18.36%) Budget Control
16 209 (17.85%) Software Engineering
17 191 (16.31%) Problem-Solving
18 163 (13.92%) Platform Engineering
19 160 (13.66%) Microservices
20 139 (11.87%) Analytics
Programming Languages
1 627 (53.54%) Python
2 358 (30.57%) Bash
3 354 (30.23%) Java
4 303 (25.88%) Go
5 293 (25.02%) JavaScript
6 195 (16.65%) PowerShell
7 165 (14.09%) SQL
8 72 (6.15%) C#
9 69 (5.89%) Bicep
10 49 (4.18%) TypeScript
11 20 (1.71%) Scala
12 15 (1.28%) C++
12 15 (1.28%) Ruby
12 15 (1.28%) Shell Script
13 11 (0.94%) R
14 9 (0.77%) PHP
14 9 (0.77%) Rust
15 8 (0.68%) Kusto Query Language
16 6 (0.51%) Kotlin
17 5 (0.43%) Perl
Qualifications
1 305 (26.05%) AWS Certification
2 114 (9.74%) Degree
3 113 (9.65%) Azure Certification
4 104 (8.88%) Security Cleared
5 77 (6.58%) Computer Science Degree
6 73 (6.23%) SC Cleared
7 37 (3.16%) AWS Certified Solutions Architect
8 36 (3.07%) Master's Degree
9 33 (2.82%) DV Cleared
10 30 (2.56%) Microsoft Certification
11 15 (1.28%) DBS Check
12 11 (0.94%) Cisco Certification
12 11 (0.94%) CISSP
13 8 (0.68%) CCNP
14 6 (0.51%) CCNA
15 5 (0.43%) CISM
15 5 (0.43%) ISTQB
16 4 (0.34%) AWS Certified Developer
17 3 (0.26%) AWS Certified Cloud Practitioner
17 3 (0.26%) Network+ Certification
Quality Assurance & Compliance
1 69 (5.89%) GDPR
2 43 (3.67%) QA
3 38 (3.25%) ISO/IEC 27001
4 30 (2.56%) HIPAA
5 18 (1.54%) NIST
5 18 (1.54%) SOC 2
6 13 (1.11%) Data Quality
7 12 (1.02%) PCI DSS
8 9 (0.77%) California Consumer Privacy Act
9 6 (0.51%) Cyber Essentials
9 6 (0.51%) SLA
10 4 (0.34%) Sarbanes-Oxley
11 3 (0.26%) Accessibility
12 2 (0.17%) Cyber Essentials PLUS
13 1 (0.085%) NCSC
System Software
1 500 (42.70%) Docker
2 57 (4.87%) VMware Infrastructure
3 56 (4.78%) Virtual Machines
4 55 (4.70%) Active Directory
5 18 (1.54%) Hyper-V
6 15 (1.28%) vSphere
7 12 (1.02%) Virtual Desktop
7 12 (1.02%) VMware ESXi
8 5 (0.43%) zsh
9 4 (0.34%) NFS
10 3 (0.26%) LXC
11 2 (0.17%) HDFS
11 2 (0.17%) KVM
11 2 (0.17%) Terminal Server
11 2 (0.17%) vCloud
11 2 (0.17%) VMware NSX
11 2 (0.17%) Xen
12 1 (0.085%) Firmware
12 1 (0.085%) XenApp
12 1 (0.085%) XenDesktop
Systems Management
1 868 (74.12%) Terraform
2 628 (53.63%) Kubernetes
3 475 (40.56%) Ansible
4 318 (27.16%) Prometheus
5 223 (19.04%) Argo
6 216 (18.45%) Kustomize
7 111 (9.48%) Grafana
8 32 (2.73%) Puppet
9 28 (2.39%) Single Sign-On
10 24 (2.05%) Progress Chef
11 21 (1.79%) Microsoft Intune
12 14 (1.20%) Istio
13 12 (1.02%) SCCM
14 8 (0.68%) Salt
15 7 (0.60%) HAProxy
16 6 (0.51%) Docker Swarm
16 6 (0.51%) Podman
17 5 (0.43%) Failover Clustering
17 5 (0.43%) QRadar
18 4 (0.34%) Kibana
Vendors
1 303 (25.88%) Google
2 192 (16.40%) Microsoft
3 76 (6.49%) VMware
4 69 (5.89%) Databricks
5 50 (4.27%) Cisco
6 31 (2.65%) Splunk
7 26 (2.22%) Red Hat
8 24 (2.05%) Palo Alto
9 22 (1.88%) SolarWinds
10 21 (1.79%) Meraki
11 16 (1.37%) Siebel
12 15 (1.28%) Fortinet
12 15 (1.28%) IBM
13 14 (1.20%) Aruba
13 14 (1.20%) Oracle
14 13 (1.11%) Citrix
14 13 (1.11%) Mellanox
14 13 (1.11%) NVIDIA
15 9 (0.77%) Atlassian
15 9 (0.77%) ServiceNow