Data Migration Jobs in England

Data Migration
UK > England

The table below provides summary statistics for permanent job vacancies advertised in England requiring Data Migration skills. It includes a benchmarking guide to the annual salaries offered in vacancies that cited Data Migration over the 6 months leading up to 28 May 2025, comparing them to the same period in the previous two years.

6 months to
28 May 2025
Same period 2024 Same period 2023
Rank 320 357 353
Rank change year-on-year +37 -4 +84
Permanent jobs citing Data Migration 445 637 805
As % of all permanent jobs advertised in England 0.92% 0.72% 0.92%
As % of the Processes & Methodologies category 0.98% 0.86% 0.97%
Number of salaries quoted 299 419 499
10th Percentile £38,750 £40,000 £38,500
25th Percentile £50,625 £42,500 £52,500
Median annual salary (50th Percentile) £62,500 £57,500 £65,000
Median % change year-on-year +8.70% -11.54% +8.33%
75th Percentile £82,500 £77,500 £77,500
90th Percentile £108,750 £99,000 £97,500
UK median annual salary £62,500 £57,500 £65,000
% change year-on-year +8.70% -11.54% +8.33%

All Process and Methodology Skills
England

Data Migration falls under the Processes and Methodologies category. For comparison with the information above, the following table provides summary statistics for all permanent job vacancies requiring process or methodology skills in England.

Permanent vacancies with a requirement for process or methodology skills 45,477 74,482 83,229
As % of all permanent jobs advertised in England 94.01% 84.24% 95.56%
Number of salaries quoted 22,533 54,432 49,691
10th Percentile £29,625 £29,000 £34,375
25th Percentile £41,250 £40,000 £46,105
Median annual salary (50th Percentile) £57,500 £55,000 £62,500
Median % change year-on-year +4.55% -12.00% +4.17%
75th Percentile £75,000 £72,500 £82,500
90th Percentile £98,695 £93,750 £102,500
UK median annual salary £57,500 £55,000 £61,000
% change year-on-year +4.55% -9.84% +1.67%

Data Migration
Job Vacancy Trend in England

Job postings citing Data Migration as a proportion of all IT jobs advertised in England.
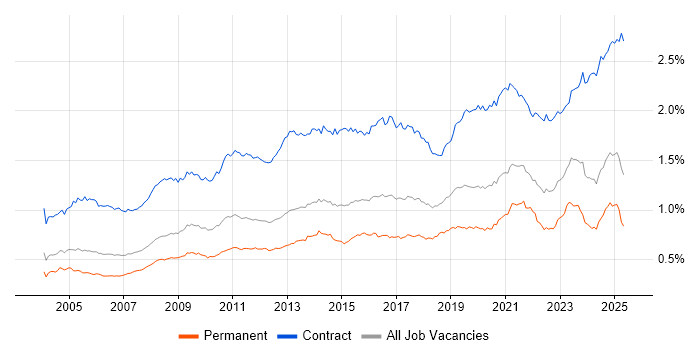
Job vacancy trend for Data Migration in England

Data Migration
Salary Trend in England

3-month moving average salary quoted in jobs citing Data Migration in England.

Salary trend for Data Migration in England

Data Migration
Salary Histogram in England

Salary distribution for jobs citing Data Migration in England over the 6 months to 28 May 2025.

Salary histogram for Data Migration in England

Data Migration
Job Locations in England

The table below looks at the demand and provides a guide to the median salaries quoted in IT jobs citing Data Migration within the England region over the 6 months to 28 May 2025. The 'Rank Change' column provides an indication of the change in demand within each location based on the same 6 month period last year.

Location Rank Change
on Same Period
Last Year
Matching
Permanent
IT Job Ads
Median Salary
Past 6 Months
Median Salary
% Change
on Same Period
Last Year
Live
Jobs
London +70 165 £67,500 -10.00% 318
North of England -7 83 £60,000 +33.33% 501
South East +67 78 £60,000 +17.65% 589
Midlands +42 74 £60,000 +20.00% 437
North West -24 66 £61,250 +36.11% 245
West Midlands +64 61 £60,000 +20.00% 235
Yorkshire +44 17 £58,750 +30.56% 205
East of England +19 15 £58,750 +17.50% 326
East Midlands +24 12 £60,000 +60.00% 175
South West +93 11 £63,204 +20.39% 273
Data Migration
UK

Data Migration
Co-occurring Skills and Capabilities in England by Category

The follow tables expand on the table above by listing co-occurrences grouped by category. The same employment type, locality and period is covered with up to 20 co-occurrences shown in each of the following categories:

Application Platforms
1 12 (2.70%) Apache Spark
2 10 (2.25%) Apache
3 6 (1.35%) Apache Airflow
4 4 (0.90%) Oracle Workflow
4 4 (0.90%) SharePoint
5 3 (0.67%) CMS
5 3 (0.67%) OpenEdge
6 2 (0.45%) Confluence
7 1 (0.22%) Microsoft Exchange
7 1 (0.22%) NetWeaver
7 1 (0.22%) Umbraco
Applications
1 11 (2.47%) Microsoft Office
2 10 (2.25%) Microsoft Excel
3 2 (0.45%) Oracle Smart View
3 2 (0.45%) Spreadsheet
4 1 (0.22%) Microsoft PowerPoint
4 1 (0.22%) Microsoft Project
4 1 (0.22%) MS Visio
Business Applications
1 67 (15.06%) NetSuite
2 23 (5.17%) Oracle EBS
3 21 (4.72%) Oracle ERP
4 20 (4.49%) Dynamics CRM
5 13 (2.92%) SAP S/4HANA
6 9 (2.02%) Shopify
7 8 (1.80%) Dynamics AX
8 6 (1.35%) Oracle Cash Management
8 6 (1.35%) Oracle General Ledger
8 6 (1.35%) Oracle Payables
8 6 (1.35%) Oracle Receivables
9 4 (0.90%) Oracle Assets
9 4 (0.90%) Oracle Financials
10 2 (0.45%) Oracle Procure-to-Pay
10 2 (0.45%) SAP EWM
10 2 (0.45%) SAP WM
11 1 (0.22%) Dynamics NAV
11 1 (0.22%) Infor M3
11 1 (0.22%) Oracle Applications
11 1 (0.22%) Oracle Payroll
Cloud Services
1 115 (25.84%) Azure
2 70 (15.73%) AWS
3 51 (11.46%) Dynamics 365
4 46 (10.34%) Power Platform
5 43 (9.66%) GCP
6 30 (6.74%) Azure DevOps
7 21 (4.72%) Snowflake
8 20 (4.49%) OCI
9 12 (2.70%) SaaS
10 11 (2.47%) Amazon S3
10 11 (2.47%) Azure Data Factory
10 11 (2.47%) Microsoft 365
10 11 (2.47%) Serverless
11 10 (2.25%) AWS Lambda
11 10 (2.25%) PowerApps
12 9 (2.02%) Azure Synapse Analytics
13 8 (1.80%) Cloud Composer
13 8 (1.80%) GitHub
14 7 (1.57%) dbt
14 7 (1.57%) Power Automate
Communications & Networking
1 4 (0.90%) Firewall
2 3 (0.67%) SD-WAN
2 3 (0.67%) WAN
2 3 (0.67%) Wi-Fi
3 2 (0.45%) LAN
3 2 (0.45%) VoIP
3 2 (0.45%) WebEx
4 1 (0.22%) DHCP
4 1 (0.22%) DNS
Database & Business Intelligence
1 43 (9.66%) SQL Server
2 35 (7.87%) Data Lake
3 28 (6.29%) Data Warehouse
4 26 (5.84%) Power BI
5 25 (5.62%) Metadata
6 24 (5.39%) Oracle ODI
7 20 (4.49%) Tableau
8 16 (3.60%) Amazon Redshift
9 14 (3.15%) BigQuery
9 14 (3.15%) Relational Database
10 11 (2.47%) PostgreSQL
11 10 (2.25%) SQL Server Integration Services
12 8 (1.80%) MySQL
12 8 (1.80%) NoSQL
13 6 (1.35%) Big Data
13 6 (1.35%) RDBMS
13 6 (1.35%) SQL Server Reporting Services
14 5 (1.12%) Electronic Patient Records
15 4 (0.90%) Azure SQL Database
15 4 (0.90%) Oracle Database
Development Applications
1 7 (1.57%) Git
1 7 (1.57%) JIRA
2 2 (0.45%) ERwin
2 2 (0.45%) Jenkins
2 2 (0.45%) Visual Studio
2 2 (0.45%) Visual Studio Code
3 1 (0.22%) Bitbucket
3 1 (0.22%) GitLab
3 1 (0.22%) SQL Server Management Studio (SSMS)
General
1 201 (45.17%) Finance
2 195 (43.82%) Social Skills
3 153 (34.38%) Analytical Skills
4 59 (13.26%) Organisational Skills
5 41 (9.21%) Law
6 37 (8.31%) Banking
7 30 (6.74%) Inclusion and Diversity
8 21 (4.72%) Financial Institution
8 21 (4.72%) Retail Banking
9 19 (4.27%) Marketing
10 17 (3.82%) Retail
11 14 (3.15%) Public Sector
12 12 (2.70%) Presentation Skills
13 11 (2.47%) Documentation Skills
14 10 (2.25%) Influencing Skills
14 10 (2.25%) Manufacturing
15 9 (2.02%) Local Government
16 6 (1.35%) General Ledger
17 5 (1.12%) Health Technology
17 5 (1.12%) Legal
Job Titles
1 104 (23.37%) Consultant
2 67 (15.06%) Architect
3 65 (14.61%) Analyst
3 65 (14.61%) Functional Consultant
4 54 (12.13%) NetSuite Consultant
5 44 (9.89%) Developer
6 38 (8.54%) Lead
7 37 (8.31%) Data Architect
8 34 (7.64%) Senior
8 34 (7.64%) Technical Consultant
9 28 (6.29%) Data Engineer
10 26 (5.84%) Data Analyst
11 20 (4.49%) Dynamics 365 Consultant
11 20 (4.49%) Solutions Architect
12 19 (4.27%) Administrator
12 19 (4.27%) Data Consultant
12 19 (4.27%) Project Manager
12 19 (4.27%) Senior Data Engineer
13 18 (4.04%) Business Analyst
14 17 (3.82%) Support Analyst
Libraries, Frameworks & Software Standards
1 32 (7.19%) .NET
2 28 (6.29%) Oracle Fusion
3 26 (5.84%) SOAP
4 21 (4.72%) HTML
5 19 (4.27%) XML
6 11 (2.47%) Lightning Web Components
6 11 (2.47%) REST
7 10 (2.25%) React
7 10 (2.25%) Restlet
8 9 (2.02%) .NET Framework
8 9 (2.02%) CSS
8 9 (2.02%) RESTful
9 7 (1.57%) JSON
10 6 (1.35%) ASP.NET
11 5 (1.12%) ASP.NET Web API
11 5 (1.12%) Middleware
11 5 (1.12%) Visualforce
12 4 (0.90%) ADO
12 4 (0.90%) Dask
12 4 (0.90%) Polars
Miscellaneous
1 62 (13.93%) Legacy Systems
2 37 (8.31%) Data Structures
3 16 (3.60%) Analytical Mindset
4 15 (3.37%) Management Information System
5 14 (3.15%) Product Ownership
6 10 (2.25%) NHS
7 8 (1.80%) Hybrid Cloud
8 6 (1.35%) Greenfield Project
8 6 (1.35%) Onboarding
9 4 (0.90%) Enterprise Software
9 4 (0.90%) PropTech
9 4 (0.90%) Self-Motivation
10 3 (0.67%) Data Centre
10 3 (0.67%) Low-Code
11 2 (0.45%) Cloud Native
11 2 (0.45%) Data Protection Act
11 2 (0.45%) Distributed Architecture
11 2 (0.45%) Reference Data
11 2 (0.45%) Replication
11 2 (0.45%) Video Conferencing
Operating Systems
1 14 (3.15%) Linux
2 6 (1.35%) Windows
3 2 (0.45%) Android
3 2 (0.45%) Apple iOS
3 2 (0.45%) Mac OS
3 2 (0.45%) Unix
3 2 (0.45%) Windows 10
3 2 (0.45%) Windows Server
Processes & Methodologies
1 445 (100.00%) Migration
2 181 (40.67%) Problem-Solving
3 157 (35.28%) ERP
4 103 (23.15%) Agile
5 91 (20.45%) Data Modelling
6 89 (20.00%) CRM
7 88 (19.78%) Project Management
8 83 (18.65%) ETL
9 81 (18.20%) Data Management
10 68 (15.28%) Analytics
10 68 (15.28%) Requirements Gathering
11 56 (12.58%) Data Cleansing
12 55 (12.36%) Collaborative Working
13 51 (11.46%) Stakeholder Management
14 50 (11.24%) Validation
15 45 (10.11%) DevOps
16 43 (9.66%) Business Intelligence
17 42 (9.44%) Data Architecture
18 41 (9.21%) Data Strategy
19 40 (8.99%) Data Engineering
Programming Languages
1 134 (30.11%) SQL
2 43 (9.66%) Python
3 36 (8.09%) C#
4 34 (7.64%) JavaScript
5 33 (7.42%) PL/SQL
6 15 (3.37%) Java
7 13 (2.92%) X++
8 11 (2.47%) T-SQL
9 9 (2.02%) Apex Code
10 4 (0.90%) PowerShell
11 3 (0.67%) Progress 4GL
11 3 (0.67%) TypeScript
12 2 (0.45%) Bicep
12 2 (0.45%) Go
12 2 (0.45%) Groovy
12 2 (0.45%) PHP
12 2 (0.45%) Shell Script
12 2 (0.45%) SPARQL
13 1 (0.22%) Bash
13 1 (0.22%) C++
Qualifications
1 47 (10.56%) Degree
2 26 (5.84%) Azure Certification
3 25 (5.62%) AWS Certification
4 23 (5.17%) Security Cleared
5 21 (4.72%) Microsoft Certification
6 17 (3.82%) Computer Science Degree
7 16 (3.60%) SC Cleared
8 9 (2.02%) PMI Certification
8 9 (2.02%) PMP
9 8 (1.80%) DBS Check
10 6 (1.35%) TOGAF Certification
11 3 (0.67%) ACCA
11 3 (0.67%) MCP
12 2 (0.45%) CIMA
12 2 (0.45%) CTC Cleared
12 2 (0.45%) DV Cleared
12 2 (0.45%) ITIL Foundation Certificate
12 2 (0.45%) SAP Certification
12 2 (0.45%) SnowPro
13 1 (0.22%) AWS Certified DevOps Engineer
Quality Assurance & Compliance
1 65 (14.61%) Data Quality
2 21 (4.72%) QA
3 8 (1.80%) ISO 9001
4 6 (1.35%) Accessibility
5 2 (0.45%) Cyber Essentials
5 2 (0.45%) Dublin Core
5 2 (0.45%) GDPR
5 2 (0.45%) GRC
5 2 (0.45%) ISO/IEC 27001
5 2 (0.45%) PCI DSS
5 2 (0.45%) PMO
6 1 (0.22%) COBIT
6 1 (0.22%) DICOM
6 1 (0.22%) GMP
6 1 (0.22%) HIPAA
6 1 (0.22%) NIST
System Software
1 6 (1.35%) Docker
2 4 (0.90%) Active Directory
3 1 (0.22%) Virtual Machines
Systems Management
1 10 (2.25%) Kubernetes
2 5 (1.12%) Terraform
3 2 (0.45%) SCCM
4 1 (0.22%) Ansible
4 1 (0.22%) Backup Exec
4 1 (0.22%) Oracle RMAN
4 1 (0.22%) Progress Chef
4 1 (0.22%) Puppet
Vendors
1 121 (27.19%) Microsoft
2 66 (14.83%) Oracle
3 29 (6.52%) Salesforce
4 20 (4.49%) SAP
5 17 (3.82%) Google
6 12 (2.70%) Databricks
7 8 (1.80%) IBM
7 8 (1.80%) IFS
8 7 (1.57%) Informatica
8 7 (1.57%) MuleSoft
8 7 (1.57%) Red Hat
9 5 (1.12%) PeopleSoft
10 4 (0.90%) Dell
10 4 (0.90%) ServiceNow
11 3 (0.67%) Intel
11 3 (0.67%) Progress
11 3 (0.67%) StreamSets
11 3 (0.67%) Talend
12 2 (0.45%) Cerner
13 1 (0.22%) Epicor