Cloud Security Jobs in England

Cloud Security
UK > England

The table below provides summary statistics for permanent job vacancies advertised in England requiring Cloud Security skills. It includes a benchmarking guide to the annual salaries offered in vacancies that cited Cloud Security over the 6 months leading up to 27 May 2025, comparing them to the same period in the previous two years.

6 months to
27 May 2025
Same period 2024 Same period 2023
Rank 229 320 170
Rank change year-on-year +91 -150 +154
Permanent jobs citing Cloud Security 684 755 1,927
As % of all permanent jobs advertised in England 1.42% 0.86% 2.21%
As % of the Processes & Methodologies category 1.51% 1.02% 2.31%
Number of salaries quoted 363 598 917
10th Percentile £46,250 £38,750 £42,874
25th Percentile £53,750 £47,125 £53,970
Median annual salary (50th Percentile) £70,000 £65,000 £75,000
Median % change year-on-year +7.69% -13.33% +7.14%
75th Percentile £85,000 £85,000 £95,000
90th Percentile £105,000 £100,355 £111,250
UK median annual salary £71,746 £65,000 £75,000
% change year-on-year +10.38% -13.33% +7.14%

All Process and Methodology Skills
England

Cloud Security falls under the Processes and Methodologies category. For comparison with the information above, the following table provides summary statistics for all permanent job vacancies requiring process or methodology skills in England.

Permanent vacancies with a requirement for process or methodology skills 45,377 74,348 83,355
As % of all permanent jobs advertised in England 94.05% 84.31% 95.58%
Number of salaries quoted 22,410 54,380 49,711
10th Percentile £29,750 £29,000 £34,452
25th Percentile £41,250 £40,000 £46,105
Median annual salary (50th Percentile) £57,500 £55,000 £62,500
Median % change year-on-year +4.55% -12.00% +4.17%
75th Percentile £75,000 £72,500 £82,500
90th Percentile £98,750 £93,750 £102,500
UK median annual salary £57,500 £55,000 £61,000
% change year-on-year +4.55% -9.84% +1.67%

Cloud Security
Job Vacancy Trend in England

Job postings citing Cloud Security as a proportion of all IT jobs advertised in England.
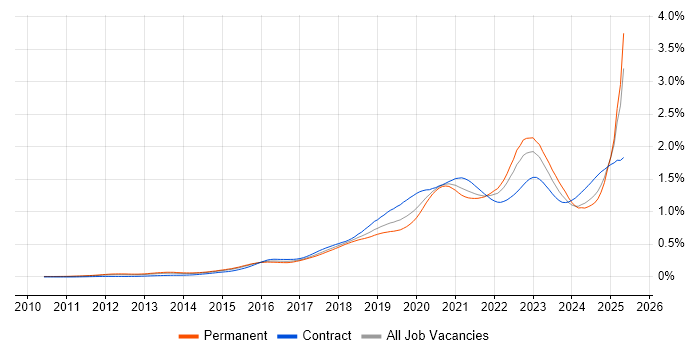
Job vacancy trend for Cloud Security in England

Cloud Security
Salary Trend in England

3-month moving average salary quoted in jobs citing Cloud Security in England.

Salary trend for Cloud Security in England

Cloud Security
Salary Histogram in England

Salary distribution for jobs citing Cloud Security in England over the 6 months to 27 May 2025.

Salary histogram for Cloud Security in England

Cloud Security
Job Locations in England

The table below looks at the demand and provides a guide to the median salaries quoted in IT jobs citing Cloud Security within the England region over the 6 months to 27 May 2025. The 'Rank Change' column provides an indication of the change in demand within each location based on the same 6 month period last year.

Location Rank Change
on Same Period
Last Year
Matching
Permanent
IT Job Ads
Median Salary
Past 6 Months
Median Salary
% Change
on Same Period
Last Year
Live
Jobs
North of England +74 249 £70,000 +33.33% 518
North West +81 224 £74,870 +49.74% 237
London +41 216 £75,000 -6.25% 504
South East +70 94 £65,000 +30.00% 710
Midlands +32 41 £72,500 +11.54% 452
South West +78 39 £72,500 +21.80% 296
West Midlands +56 38 £72,500 -3.33% 247
East of England +40 22 £69,000 -4.83% 377
Yorkshire +20 19 £62,500 +4.17% 216
North East +25 6 £70,000 +64.71% 65
East Midlands +18 3 £80,000 +32.23% 176
Cloud Security
UK

Cloud Security
Co-occurring Skills and Capabilities in England by Category

The follow tables expand on the table above by listing co-occurrences grouped by category. The same employment type, locality and period is covered with up to 20 co-occurrences shown in each of the following categories:

Application Platforms
1 18 (2.63%) Microsoft Exchange
2 17 (2.49%) Confluence
3 9 (1.32%) Apache Spark
3 9 (1.32%) SharePoint
4 6 (0.88%) IIS
5 5 (0.73%) Apache
6 4 (0.58%) nginx
7 2 (0.29%) Oracle Workflow
Applications
1 6 (0.88%) Microsoft Office
2 5 (0.73%) Mozilla Thunderbird
3 3 (0.44%) Microsoft Project
3 3 (0.44%) MS Visio
4 2 (0.29%) Microsoft Excel
4 2 (0.29%) Oracle Smart View
4 2 (0.29%) Spreadsheet
5 1 (0.15%) Microsoft PowerPoint
Business Applications
1 2 (0.29%) Endur
1 2 (0.29%) Oracle Assets
1 2 (0.29%) Oracle Cash Management
1 2 (0.29%) Oracle ERP
1 2 (0.29%) Oracle Financials
1 2 (0.29%) Oracle General Ledger
1 2 (0.29%) Oracle Payables
1 2 (0.29%) Oracle Receivables
1 2 (0.29%) Shopify
2 1 (0.15%) Dynamics CRM
Cloud Services
1 451 (65.94%) Azure
2 430 (62.87%) AWS
3 277 (40.50%) GCP
4 72 (10.53%) SaaS
5 61 (8.92%) Microsoft 365
6 50 (7.31%) Serverless
7 46 (6.73%) PaaS
8 39 (5.70%) Entra ID
9 34 (4.97%) AWS KMS
9 34 (4.97%) Azure DevOps
10 32 (4.68%) AWS Lambda
10 32 (4.68%) IaaS
11 31 (4.53%) Amazon S3
11 31 (4.53%) Virtual Private Cloud
12 27 (3.95%) Amazon EC2
13 24 (3.51%) AWS CloudFormation
14 23 (3.36%) Amazon CloudWatch
14 23 (3.36%) Azure Sentinel
15 20 (2.92%) Power Platform
16 19 (2.78%) GitHub
Communications & Networking
1 124 (18.13%) Firewall
2 65 (9.50%) Network Security
3 41 (5.99%) VPN
4 28 (4.09%) DNS
5 26 (3.80%) WAN
6 18 (2.63%) SD-WAN
7 17 (2.49%) Wi-Fi
8 16 (2.34%) TCP/IP
8 16 (2.34%) Wireless
9 15 (2.19%) BGP
9 15 (2.19%) Intrusion Detection
10 14 (2.05%) Cisco ASA
10 14 (2.05%) MPLS
10 14 (2.05%) OSPF
10 14 (2.05%) WLAN
11 13 (1.90%) LAN
12 12 (1.75%) DHCP
13 10 (1.46%) Cisco Firepower
13 10 (1.46%) IPsec
13 10 (1.46%) SSL
Database & Business Intelligence
1 22 (3.22%) Amazon RDS
1 22 (3.22%) SQL Server
2 11 (1.61%) Big Data
3 8 (1.17%) Data Lake
4 7 (1.02%) MySQL
5 6 (0.88%) Power BI
6 5 (0.73%) Data Warehouse
7 4 (0.58%) Amazon Redshift
7 4 (0.58%) Delta Lake
7 4 (0.58%) DynamoDB
7 4 (0.58%) PostgreSQL
8 3 (0.44%) Amazon Aurora
8 3 (0.44%) Hadoop
8 3 (0.44%) MongoDB
9 2 (0.29%) Elasticsearch
9 2 (0.29%) NoSQL
10 1 (0.15%) BigQuery
10 1 (0.15%) Looker
10 1 (0.15%) SQL Server Reporting Services
10 1 (0.15%) Tableau
Development Applications
1 43 (6.29%) Jenkins
2 41 (5.99%) Git
3 20 (2.92%) JIRA
4 16 (2.34%) Vagrant
5 9 (1.32%) GitLab
6 5 (0.73%) Postman
6 5 (0.73%) Sonatype Nexus
7 4 (0.58%) JMeter
7 4 (0.58%) Locust
7 4 (0.58%) Robot Framework
7 4 (0.58%) Selenium
8 3 (0.44%) Bitbucket Server
9 2 (0.29%) Cypress.io
9 2 (0.29%) Octopus Deploy
9 2 (0.29%) Vite
9 2 (0.29%) webpack
10 1 (0.15%) Bitbucket
10 1 (0.15%) Burp Suite
10 1 (0.15%) SoapUI
10 1 (0.15%) Team Foundation Server
General
1 190 (27.78%) Inclusion and Diversity
2 159 (23.25%) Social Skills
3 118 (17.25%) Finance
4 48 (7.02%) Law
5 44 (6.43%) Analytical Skills
6 28 (4.09%) Banking
6 28 (4.09%) Public Sector
7 26 (3.80%) Legal
8 23 (3.36%) Retail
9 22 (3.22%) Telecoms
10 16 (2.34%) Influencing Skills
11 11 (1.61%) Presentation Skills
12 9 (1.32%) Games
13 8 (1.17%) Automotive
13 8 (1.17%) Manufacturing
13 8 (1.17%) Organisational Skills
14 7 (1.02%) Marketing
15 6 (0.88%) Aviation
16 5 (0.73%) Back Office
16 5 (0.73%) Documentation Skills
Job Titles
1 279 (40.79%) Senior
2 210 (30.70%) Software Engineer
3 201 (29.39%) Senior Software Engineer
4 124 (18.13%) Cloud Engineer
5 96 (14.04%) Security Engineer
6 80 (11.70%) Architect
7 59 (8.63%) Lead
8 49 (7.16%) Infrastructure Engineer
9 43 (6.29%) Azure Engineer
9 43 (6.29%) Senior Cloud Engineer
10 41 (5.99%) Cloud Security Engineer
11 39 (5.70%) Cloud Architect
12 38 (5.56%) Security Architect
13 34 (4.97%) AWS Architect
13 34 (4.97%) AWS Engineer
14 28 (4.09%) Security Manager
15 24 (3.51%) Analyst
15 24 (3.51%) Senior Security Engineer
16 22 (3.22%) DevOps Engineer
17 21 (3.07%) Cloud Infrastructure Engineer
Libraries, Frameworks & Software Standards
1 211 (30.85%) Node.js
2 194 (28.36%) .NET
3 25 (3.65%) REST
4 22 (3.22%) Kafka
5 19 (2.78%) Web Services
6 16 (2.34%) Elastic Stack
7 12 (1.75%) React
8 11 (1.61%) YAML
9 8 (1.17%) AngularJS
9 8 (1.17%) ARM Templates
9 8 (1.17%) PyTorch
9 8 (1.17%) TensorFlow
10 7 (1.02%) OAuth
11 6 (0.88%) Hugging Face
11 6 (0.88%) LangChain
12 5 (0.73%) AWS CDK
12 5 (0.73%) SailPoint
12 5 (0.73%) SAML
12 5 (0.73%) Spring
12 5 (0.73%) Spring Boot
Miscellaneous
1 188 (27.49%) Self-Motivation
2 181 (26.46%) Cyberattack
3 178 (26.02%) Linux Command Line
4 89 (13.01%) Management Information System
5 83 (12.13%) Security Posture
6 57 (8.33%) Cloud Native
7 42 (6.14%) Public Cloud
8 28 (4.09%) Cloud Security Posture
9 21 (3.07%) Data Centre
10 17 (2.49%) Cyber Threat
11 16 (2.34%) Product Ownership
12 15 (2.19%) PKI
12 15 (2.19%) Security Operations Centre
13 14 (2.05%) Algorithms
13 14 (2.05%) Hybrid Cloud
14 12 (1.75%) Replication
15 9 (1.32%) Cyber Defence
15 9 (1.32%) Team-Oriented Environment
16 8 (1.17%) Enterprise Cloud
16 8 (1.17%) Social Media
Operating Systems
1 247 (36.11%) Linux
2 94 (13.74%) Windows
3 28 (4.09%) Windows Server
4 20 (2.92%) VMS
5 10 (1.46%) Android
5 10 (1.46%) Apple iOS
6 8 (1.17%) Amazon Linux
6 8 (1.17%) Red Hat Enterprise Linux
6 8 (1.17%) Windows Vista
7 7 (1.02%) Windows Server 2016
8 5 (0.73%) Ubuntu
8 5 (0.73%) Unix
8 5 (0.73%) Windows Server 2019
9 4 (0.58%) Windows 10
10 3 (0.44%) Mac OS
Processes & Methodologies
1 267 (39.04%) Agile
2 250 (36.55%) Software Engineering
3 242 (35.38%) Mentoring
4 220 (32.16%) Microservices
5 205 (29.97%) Machine Learning
6 200 (29.24%) Scrum
7 191 (27.92%) User Experience
8 184 (26.90%) Data Engineering
9 183 (26.75%) Site Reliability Engineering
10 151 (22.08%) DevOps
11 144 (21.05%) CI/CD
12 132 (19.30%) Cybersecurity
13 120 (17.54%) Infrastructure as Code
14 92 (13.45%) Incident Response
14 92 (13.45%) Information Security
15 79 (11.55%) Problem-Solving
16 75 (10.96%) Computer Science
17 73 (10.67%) Security Architecture
18 68 (9.94%) SIEM
19 66 (9.65%) Continuous Improvement
Programming Languages
1 333 (48.68%) Python
2 234 (34.21%) Java
3 200 (29.24%) Go
4 188 (27.49%) JavaScript
5 181 (26.46%) C++
5 181 (26.46%) Rust
6 65 (9.50%) PowerShell
7 34 (4.97%) TypeScript
8 30 (4.39%) SQL
9 26 (3.80%) Bash
10 15 (2.19%) Groovy
11 12 (1.75%) Bicep
11 12 (1.75%) Perl
12 10 (1.46%) C#
13 4 (0.58%) Kusto Query Language
13 4 (0.58%) Ruby
14 3 (0.44%) PHP
14 3 (0.44%) R
14 3 (0.44%) Shell Script
15 2 (0.29%) C
Qualifications
1 263 (38.45%) Security Cleared
2 236 (34.50%) AWS Certification
3 215 (31.43%) AWS Certified Solutions Architect
4 188 (27.49%) DV Cleared
5 178 (26.02%) AWS Certified Developer
6 108 (15.79%) Degree
7 83 (12.13%) CISSP
8 75 (10.96%) SC Cleared
9 48 (7.02%) CISM
9 48 (7.02%) Computer Science Degree
10 36 (5.26%) Azure Certification
11 27 (3.95%) (ISC)2 CCSP
12 26 (3.80%) Cisco Certification
13 23 (3.36%) CISA
14 22 (3.22%) CEH
15 21 (3.07%) Master's Degree
16 20 (2.92%) Microsoft Certification
17 14 (2.05%) CCSP
18 12 (1.75%) CCSK
18 12 (1.75%) GIAC
Quality Assurance & Compliance
1 99 (14.47%) ISO/IEC 27001
2 89 (13.01%) NIST
3 85 (12.43%) GDPR
4 31 (4.53%) HIPAA
5 29 (4.24%) PCI DSS
6 21 (3.07%) Cyber Essentials
7 19 (2.78%) SOC 2
8 15 (2.19%) Cyber Essentials PLUS
8 15 (2.19%) GRC
9 14 (2.05%) Accessibility
10 11 (1.61%) NCSC
11 7 (1.02%) QA
12 5 (0.73%) NIST 800
13 4 (0.58%) California Consumer Privacy Act
13 4 (0.58%) Sarbanes-Oxley
14 3 (0.44%) COBIT
14 3 (0.44%) ISO/IEC 27002 (supersedes ISO/IEC 17799)
15 2 (0.29%) SLA
16 1 (0.15%) ISO/IEC 27005
16 1 (0.15%) SOC 1
System Software
1 62 (9.06%) Docker
2 57 (8.33%) Active Directory
3 14 (2.05%) Virtual Machines
4 13 (1.90%) VMware Infrastructure
5 9 (1.32%) DFS Replication
6 7 (1.02%) Hyper-V
7 5 (0.73%) Firmware
7 5 (0.73%) VMware ESXi
8 4 (0.58%) Virtual Desktop
9 2 (0.29%) Dovecot
9 2 (0.29%) Postfix
9 2 (0.29%) Squid
9 2 (0.29%) vSphere
10 1 (0.15%) VMware Server
Systems Management
1 141 (20.61%) Terraform
2 103 (15.06%) Kubernetes
3 44 (6.43%) Ansible
4 40 (5.85%) Grafana
4 40 (5.85%) Prometheus
5 28 (4.09%) Microsoft Intune
6 11 (1.61%) CASB
6 11 (1.61%) QRadar
6 11 (1.61%) Single Sign-On
7 10 (1.46%) SCCM
8 8 (1.17%) Progress Chef
9 7 (1.02%) Nessus
10 6 (0.88%) ArcSight ESM
11 5 (0.73%) Active Directory Federation Services
11 5 (0.73%) HP Fortify
11 5 (0.73%) Jamf Pro
11 5 (0.73%) Proxmox
12 4 (0.58%) Istio
12 4 (0.58%) ZENworks
13 3 (0.44%) RSA Archer
Vendors
1 148 (21.64%) Microsoft
2 44 (6.43%) Google
3 38 (5.56%) Cisco
4 21 (3.07%) Ping Identity
5 19 (2.78%) VMware
6 18 (2.63%) Splunk
7 17 (2.49%) Meraki
7 17 (2.49%) ServiceNow
8 14 (2.05%) Juniper
9 13 (1.90%) CheckPoint
9 13 (1.90%) SolarWinds
10 12 (1.75%) Dynatrace
11 10 (1.46%) Infoblox
12 9 (1.32%) Databricks
13 8 (1.17%) Palo Alto
14 7 (1.02%) Fortinet
15 6 (0.88%) ArcSight
15 6 (0.88%) CyberArk
15 6 (0.88%) McAfee
15 6 (0.88%) Oracle