Google Analytics Job Trends in England

Google Analytics (GA)
UK > England

The table below provides summary statistics and salary benchmarking for jobs advertised in England requiring Google Analytics skills. It covers permanent job vacancies from the 6 months leading up to 16 November 2025, with comparisons to the same periods in the previous two years.

6 months to
16 Nov 2025
Same period 2024 Same period 2023
Rank 403 546 492
Rank change year-on-year +143 -54 +31
Permanent jobs citing Google Analytics 226 169 206
As % of all permanent jobs in England 0.49% 0.28% 0.43%
As % of the Cloud Services category 1.43% 0.84% 1.00%
Number of salaries quoted 162 66 180
10th Percentile £27,250 £31,875 £24,660
25th Percentile £31,000 £36,250 £36,250
Median annual salary (50th Percentile) £40,000 £47,500 £42,500
Median % change year-on-year -15.79% +11.76% -15.00%
75th Percentile £49,688 £61,250 £58,750
90th Percentile £67,500 £70,625 £69,000
UK median annual salary £40,000 £45,000 £40,000
% change year-on-year -11.11% +12.50% -20.00%

All Cloud Skills
England

Google Analytics falls under the Cloud Services category. For comparison with the information above, the following table provides summary statistics for all permanent job vacancies requiring cloud computing skills in England.

Permanent vacancies with a requirement for cloud computing skills 15,838 20,066 20,614
As % of all permanent jobs advertised in England 34.62% 33.04% 43.32%
Number of salaries quoted 10,366 12,162 17,246
10th Percentile £28,750 £36,250 £32,750
25th Percentile £37,500 £47,500 £46,000
Median annual salary (50th Percentile) £57,500 £65,000 £62,500
Median % change year-on-year -11.54% +4.00% -3.85%
75th Percentile £80,000 £83,750 £82,500
90th Percentile £100,000 £102,725 £101,185
UK median annual salary £57,500 £65,000 £62,500
% change year-on-year -11.54% +4.00% -

Google Analytics
Job Vacancy Trend in England

Historical trend showing the proportion of permanent IT job postings citing Google Analytics relative to all permanent IT jobs advertised in England.
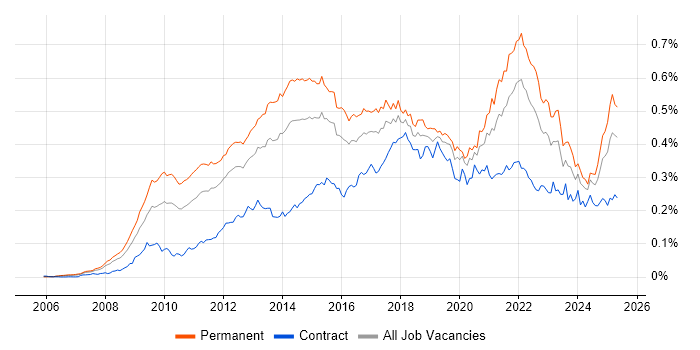
Google Analytics job vacancy trend in England

Google Analytics
Salary Trend in England

Salary distribution trend for jobs in England citing Google Analytics.

Salary distribution trend for jobs in England citing Google Analytics

Google Analytics
Salary Histogram in England

Salary distribution for jobs citing Google Analytics in England over the 6 months to 16 November 2025.

Salary histogram for Google Analytics in England

Google Analytics
Job Locations in England

The table below looks at the demand and provides a guide to the median salaries quoted in IT jobs citing Google Analytics within the England region over the 6 months to 16 November 2025. The 'Rank Change' column provides an indication of the change in demand within each location based on the same 6 month period last year.

Location Rank Change
on Same Period
Last Year
Matching
Permanent
IT Job Ads
Median Salary
Past 6 Months
Median Salary
% Change
on Same Period
Last Year
Live
Jobs
London +66 69 £50,000 +0.87% 96
South East +65 63 £40,000 -5.88% 44
East of England +38 33 £28,500 +3.64% 12
North of England +40 27 £31,500 -35.38% 26
North West +47 25 £31,500 -33.68% 19
Midlands +63 21 £42,500 +13.33% 12
West Midlands +53 12 £33,875 -9.67% 5
East Midlands +34 10 £42,500 - 7
South West +30 10 £35,000 -6.67% 9
North East - 2 £53,100 - 1
Yorkshire +8 1 £31,500 -37.00% 6
Google Analytics
UK

Google Analytics
Co-Occurring Skills & Capabilities in England by Category

The following tables expand on the one above by listing co-occurrences grouped by category. They cover the same employment type, locality and period, with up to 20 co-occurrences shown in each category:

Application Platforms
1 29 (12.83%) CMS
2 27 (11.95%) WordPress
3 8 (3.54%) Headless CMS
4 4 (1.77%) Drupal
5 3 (1.33%) Apache Airflow
5 3 (1.33%) Confluence
5 3 (1.33%) Joomla!
5 3 (1.33%) Umbraco
6 2 (0.88%) Apache
7 1 (0.44%) Adobe Experience Manager
7 1 (0.44%) nginx
Applications
1 34 (15.04%) Microsoft Excel
2 24 (10.62%) Photoshop
3 14 (6.19%) Adobe XD
4 12 (5.31%) Adobe Creative Suite
4 12 (5.31%) Microsoft Office
5 8 (3.54%) Adobe Premiere
6 7 (3.10%) MadCap Flare
7 5 (2.21%) Adobe Illustrator
7 5 (2.21%) Spreadsheet
8 4 (1.77%) InDesign
8 4 (1.77%) SketchUp
9 3 (1.33%) Trello
10 1 (0.44%) Chatbot
10 1 (0.44%) Notion
Business Applications
1 37 (16.37%) Shopify
2 15 (6.64%) Magento
3 2 (0.88%) OpenCart
3 2 (0.88%) Payment Gateway
4 1 (0.44%) Dynamics CRM
4 1 (0.44%) Dynamics GP
4 1 (0.44%) Sprinklr
Cloud Services
1 46 (20.35%) Google Ads
2 25 (11.06%) Google Tag Manager
3 20 (8.85%) Figma
4 19 (8.41%) Power Platform
5 15 (6.64%) AWS
5 15 (6.64%) Google Sheets
6 12 (5.31%) Azure
7 11 (4.87%) GitHub
7 11 (4.87%) MailChimp
8 10 (4.42%) Google Docs
9 9 (3.98%) Amazon S3
9 9 (3.98%) AWS Lambda
9 9 (3.98%) Contentsquare
9 9 (3.98%) GCP
9 9 (3.98%) Google Data Studio
9 9 (3.98%) Serverless
10 8 (3.54%) Amazon ECS
10 8 (3.54%) Amazon SQS
10 8 (3.54%) Vercel
11 6 (2.65%) SaaS
Communications & Networking
1 5 (2.21%) VPN
2 1 (0.44%) Internet
2 1 (0.44%) SMS
Database & Business Intelligence
1 19 (8.41%) Power BI
2 16 (7.08%) Looker
3 11 (4.87%) Tableau
4 8 (3.54%) NoSQL
5 7 (3.10%) Metadata
6 5 (2.21%) BigQuery
6 5 (2.21%) Mixpanel
6 5 (2.21%) MySQL
7 3 (1.33%) Azure SQL Database
7 3 (1.33%) Power Query
8 2 (0.88%) Amazon Redshift
9 1 (0.44%) Amazon Athena
9 1 (0.44%) Amazon RDS
9 1 (0.44%) Data Lake
9 1 (0.44%) Data Warehouse
9 1 (0.44%) Redis
9 1 (0.44%) Redshift Spectrum
9 1 (0.44%) Snowflake Schema
9 1 (0.44%) SQL Server
Development Applications
1 12 (5.31%) JIRA
2 10 (4.42%) Axure RP
2 10 (4.42%) Balsamiq
3 9 (3.98%) Cypress.io
4 4 (1.77%) Git
5 3 (1.33%) Visual Studio
5 3 (1.33%) Visual Website Optimizer
6 1 (0.44%) Bazaar
6 1 (0.44%) GCC
6 1 (0.44%) Jenkins
6 1 (0.44%) Pivotal Tracker
6 1 (0.44%) Postman
6 1 (0.44%) Selenium
6 1 (0.44%) SQL Server Management Studio (SSMS)
6 1 (0.44%) Visual Studio Code
6 1 (0.44%) WebDriver
General
1 159 (70.35%) Marketing
2 90 (39.82%) Social Skills
3 81 (35.84%) Analytical Skills
4 26 (11.50%) Retail
5 25 (11.06%) Advertising
6 24 (10.62%) Inclusion and Diversity
7 22 (9.73%) Finance
8 17 (7.52%) Public Sector
9 10 (4.42%) Law
9 10 (4.42%) Presentation Skills
10 9 (3.98%) Organisational Skills
11 8 (3.54%) Games
12 6 (2.65%) Publishing
13 5 (2.21%) Spanish Language
14 3 (1.33%) French Language
14 3 (1.33%) German Language
14 3 (1.33%) Legal
15 2 (0.88%) Financial Institution
15 2 (0.88%) Italian Language
15 2 (0.88%) Mandarin Language
Job Titles
1 21 (9.29%) Analyst
2 19 (8.41%) Senior
3 17 (7.52%) Marketing Executive
4 16 (7.08%) E-Commerce Specialist
5 13 (5.75%) Developer
5 13 (5.75%) SEO Manager
6 12 (5.31%) SEO Specialist
7 11 (4.87%) Lead
8 10 (4.42%) E-Commerce Executive
8 10 (4.42%) Marketing Manager
8 10 (4.42%) SEO Executive
9 9 (3.98%) Designer
9 9 (3.98%) Performance Analyst
9 9 (3.98%) Senior Developer
10 8 (3.54%) Full-Stack Developer
10 8 (3.54%) Senior Full-Stack Developer
10 8 (3.54%) UX Designer
11 7 (3.10%) Author
11 7 (3.10%) E-Commerce Manager
11 7 (3.10%) Technical Author
Libraries, Frameworks & Software Standards
1 45 (19.91%) HTML
2 31 (13.72%) CSS
3 12 (5.31%) Next.js
4 9 (3.98%) GraphQL
4 9 (3.98%) Playwright
5 8 (3.54%) Express.js
5 8 (3.54%) Jest
5 8 (3.54%) Node.js
5 8 (3.54%) React
5 8 (3.54%) RESTful
5 8 (3.54%) Tailwind CSS
5 8 (3.54%) Vitest
6 3 (1.33%) JSON
7 2 (0.88%) DOM
8 1 (0.44%) Kafka
8 1 (0.44%) LAMP
8 1 (0.44%) Laravel
8 1 (0.44%) Memcached
8 1 (0.44%) REST
8 1 (0.44%) SOAP
Miscellaneous
1 52 (23.01%) Social Media
2 21 (9.29%) Algorithms
3 20 (8.85%) Blog
4 18 (7.96%) Self-Motivation
5 17 (7.52%) Analytical Mindset
5 17 (7.52%) Product Ownership
6 8 (3.54%) Driving Licence
7 6 (2.65%) Web Conferencing
8 5 (2.21%) Photography
8 5 (2.21%) Podcast
9 4 (1.77%) Data Structures
10 3 (1.33%) Digital Media
10 3 (1.33%) Graphic Design
10 3 (1.33%) Mobile App
10 3 (1.33%) PropTech
10 3 (1.33%) Video Editing
11 2 (0.88%) FMCG
11 2 (0.88%) Marketing Technology
11 2 (0.88%) Onboarding
12 1 (0.44%) Online Games
Operating Systems
1 1 (0.44%) Linux
Processes & Methodologies
1 226 (100.00%) Analytics
2 136 (60.18%) SEO
3 99 (43.81%) Digital Marketing
4 96 (42.48%) E-Commerce
5 75 (33.19%) User Experience
6 54 (23.89%) Actionable Insight
7 44 (19.47%) Agile
8 35 (15.49%) Marketing Strategy
9 30 (13.27%) UX Design
10 29 (12.83%) Pay per click
10 29 (12.83%) Problem-Solving
11 27 (11.95%) B2B
11 27 (11.95%) Competitor Analysis
12 26 (11.50%) A/B Testing
12 26 (11.50%) Data Analysis
13 25 (11.06%) Decision-Making
13 25 (11.06%) Mentoring
14 23 (10.18%) CRM
15 22 (9.73%) Content Strategy
15 22 (9.73%) Paid Search
Programming Languages
1 34 (15.04%) JavaScript
2 32 (14.16%) SQL
3 19 (8.41%) Python
4 9 (3.98%) TypeScript
5 5 (2.21%) PHP
6 1 (0.44%) R
Qualifications
1 31 (13.72%) Degree
2 11 (4.87%) SC Cleared
2 11 (4.87%) Security Cleared
3 3 (1.33%) BPSS Clearance
4 1 (0.44%) A+ Certification
4 1 (0.44%) Master's Degree
4 1 (0.44%) PhD
Quality Assurance & Compliance
1 25 (11.06%) Accessibility
2 11 (4.87%) WCAG
3 6 (2.65%) GDPR
4 4 (1.77%) Data Quality
5 3 (1.33%) Actionable Recommendations
6 2 (0.88%) QA
7 1 (0.44%) California Consumer Privacy Act
System Software
1 2 (0.88%) Docker
Systems Management
1 1 (0.44%) Terraform
Vendors
1 217 (96.02%) Google
2 42 (18.58%) Microsoft
3 31 (13.72%) Adobe
4 28 (12.39%) Screaming Frog
5 26 (11.50%) Ahrefs
6 17 (7.52%) HubSpot
7 15 (6.64%) Hotjar
8 12 (5.31%) Facebook
9 11 (4.87%) Apple
10 9 (3.98%) Salesforce
11 8 (3.54%) Instagram
12 6 (2.65%) TikTok
13 5 (2.21%) Sage
13 5 (2.21%) WooCommerce
14 4 (1.77%) Hootsuite
14 4 (1.77%) YouTube
15 2 (0.88%) Brandwatch
15 2 (0.88%) Criteo
15 2 (0.88%) Pardot
16 1 (0.44%) Salesforce Marketing Cloud