React Jobs in England

React.js
UK > England

The table below provides summary statistics for permanent job vacancies advertised in England requiring React skills. It includes a benchmarking guide to the annual salaries offered in vacancies that cited React over the 6 months leading up to 23 October 2024, comparing them to the same period in the previous two years.

6 months to
23 Oct 2024
Same period 2023 Same period 2022
Rank 49 49 25
Rank change year-on-year 0 -24 -7
Permanent jobs citing React 2,848 2,837 11,109
As % of all permanent jobs advertised in England 4.26% 5.44% 9.25%
As % of the Libraries, Frameworks & Software Standards category 22.11% 20.31% 27.16%
Number of salaries quoted 1,673 2,385 5,674
10th Percentile £42,500 £43,750 £43,750
25th Percentile £52,500 £55,000 £51,250
Median annual salary (50th Percentile) £67,500 £70,000 £70,000
Median % change year-on-year -3.57% - +7.69%
75th Percentile £88,750 £93,750 £87,500
90th Percentile £108,750 £115,000 £110,000
UK median annual salary £67,500 £70,000 £67,500
% change year-on-year -3.57% +3.70% +8.00%

All Software Libraries and Frameworks
England

React falls under the Software Libraries and Frameworks category. For comparison with the information above, the following table provides summary statistics for all permanent job vacancies requiring technical specification, industry standards, software libraries and framework skills in England.

Permanent vacancies with a requirement for technical specification, industry standards, software libraries and framework skills 12,882 13,966 40,901
As % of all permanent jobs advertised in England 19.28% 26.79% 34.06%
Number of salaries quoted 7,689 11,015 22,686
10th Percentile £40,000 £41,250 £40,000
25th Percentile £48,750 £51,250 £48,750
Median annual salary (50th Percentile) £65,000 £67,500 £65,000
Median % change year-on-year -3.70% +3.85% +8.33%
75th Percentile £85,000 £86,250 £85,000
90th Percentile £112,500 £107,500 £105,000
UK median annual salary £65,000 £65,351 £65,000
% change year-on-year -0.54% +0.54% +8.33%

React
Job Vacancy Trend in England

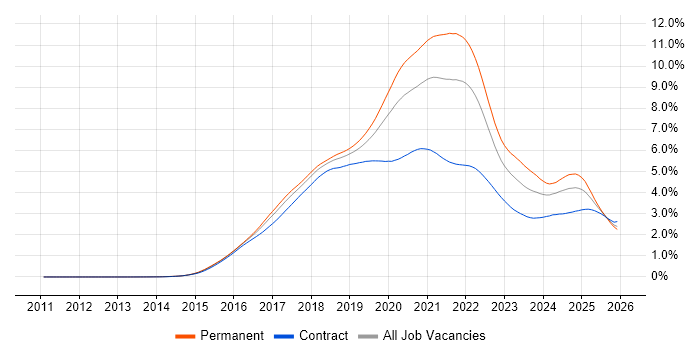
Job postings citing React as a proportion of all IT jobs advertised in England.

Job vacancy trend for React in England

React
Salary Trend in England

3-month moving average salary quoted in jobs citing React in England.

Salary trend for React in England

React
Salary Histogram in England

Salary distribution for jobs citing React in England over the 6 months to 23 October 2024.

Salary histogram for React in England

React
Job Locations in England

The table below looks at the demand and provides a guide to the median salaries quoted in IT jobs citing React within the England region over the 6 months to 23 October 2024. The 'Rank Change' column provides an indication of the change in demand within each location based on the same 6 month period last year.

Location Rank Change
on Same Period
Last Year
Matching
Permanent
IT Job Ads
Median Salary
Past 6 Months
Median Salary
% Change
on Same Period
Last Year
Live
Jobs
London -4 1,085 £85,000 - 304
South East -2 523 £65,000 -3.70% 115
North of England -3 464 £57,750 -3.75% 137
South West +27 290 £57,500 - 67
North West -26 255 £60,000 - 88
Midlands -27 235 £60,000 - 74
East of England +26 216 £65,000 - 53
Yorkshire +13 144 £55,000 -8.33% 35
West Midlands -4 132 £65,000 +13.04% 49
East Midlands -38 102 £50,000 -23.08% 25
North East +14 65 £70,000 +33.33% 15
React
UK

React
Co-occurring Skills and Capabilities in England by Category

The follow tables expand on the table above by listing co-occurrences grouped by category. The same employment type, locality and period is covered with up to 20 co-occurrences shown in each of the following categories:

Application Platforms
1 135 (4.74%) Apache
2 110 (3.86%) Apache Airflow
3 61 (2.14%) CMS
4 41 (1.44%) nginx
5 31 (1.09%) Apache Spark
6 30 (1.05%) WordPress
7 27 (0.95%) Confluence
8 15 (0.53%) Headless CMS
9 13 (0.46%) Umbraco
10 12 (0.42%) SharePoint
11 6 (0.21%) IIS
11 6 (0.21%) NServiceBus
12 5 (0.18%) Strapi
12 5 (0.18%) Tomcat
13 4 (0.14%) OpenStack
13 4 (0.14%) Sitecore CMS
14 3 (0.11%) Apache Solr
14 3 (0.11%) Drupal
14 3 (0.11%) JBoss
15 2 (0.070%) ArcGIS
Applications
1 8 (0.28%) Photoshop
2 7 (0.25%) MadCap Flare
2 7 (0.25%) RoboHelp
3 4 (0.14%) Microsoft Office
4 3 (0.11%) Chatbot
5 2 (0.070%) Adobe Creative Suite
5 2 (0.070%) Adobe XD
5 2 (0.070%) InDesign
5 2 (0.070%) Spreadsheet
6 1 (0.035%) Microsoft Excel
6 1 (0.035%) Revit
6 1 (0.035%) S-PLUS
Business Applications
1 30 (1.05%) Ripple
2 13 (0.46%) Shopify
3 7 (0.25%) Magento
4 6 (0.21%) Payment Gateway
4 6 (0.21%) SDL Web 8
5 4 (0.14%) Dynamics CRM
6 3 (0.11%) SAP S/4HANA
7 2 (0.070%) Dynamics GP
8 1 (0.035%) Avolution ABACUS
8 1 (0.035%) R3 Corda
8 1 (0.035%) ReMetrica
8 1 (0.035%) Salesforce CRM
8 1 (0.035%) TRIRIGA
Cloud Services
1 1,273 (44.70%) AWS
2 787 (27.63%) Azure
3 403 (14.15%) Serverless
4 367 (12.89%) GCP
5 311 (10.92%) GitHub
6 254 (8.92%) AWS Lambda
7 236 (8.29%) Amazon S3
8 215 (7.55%) Amazon SQS
9 198 (6.95%) Amazon Kinesis
10 177 (6.21%) Azure DevOps
11 163 (5.72%) SaaS
12 71 (2.49%) GitHub Actions
13 61 (2.14%) IBM Cloud
14 49 (1.72%) Microsoft Copilot
15 47 (1.65%) dbt
16 37 (1.30%) PaaS
17 32 (1.12%) Azure Service Bus
18 29 (1.02%) Azure Functions
19 27 (0.95%) Azure Cosmos DB
20 26 (0.91%) Azure Logic Apps
Communications & Networking
1 24 (0.84%) HTTP
2 11 (0.39%) Broadband
3 8 (0.28%) HTTPS
4 5 (0.18%) AMQP
4 5 (0.18%) DNS
5 4 (0.14%) TCP/IP
6 3 (0.11%) FTP
6 3 (0.11%) MQTT
6 3 (0.11%) RS-232
6 3 (0.11%) RS-485
6 3 (0.11%) SSL
6 3 (0.11%) VPN
6 3 (0.11%) Wireless
6 3 (0.11%) Wireshark
7 2 (0.070%) Internet
7 2 (0.070%) SMS
8 1 (0.035%) 3GPP
8 1 (0.035%) DAB
Database & Business Intelligence
1 493 (17.31%) PostgreSQL
2 329 (11.55%) SQL Server
3 241 (8.46%) NoSQL
4 231 (8.11%) Redis
5 227 (7.97%) DynamoDB
5 227 (7.97%) MySQL
6 157 (5.51%) MongoDB
7 97 (3.41%) Relational Database
8 96 (3.37%) Apache Ignite
9 41 (1.44%) Elasticsearch
10 40 (1.40%) DB2
11 36 (1.26%) Big Data
12 26 (0.91%) SQL Server Reporting Services
13 23 (0.81%) Amazon Athena
14 22 (0.77%) Apache Arrow
14 22 (0.77%) Azure SQL Database
14 22 (0.77%) Dremio
15 21 (0.74%) Hadoop
16 18 (0.63%) GIS
17 14 (0.49%) Power BI
Development Applications
1 432 (15.17%) Git
2 316 (11.10%) Jenkins
3 107 (3.76%) Cypress.io
4 99 (3.48%) GitLab
5 98 (3.44%) JIRA
6 63 (2.21%) Selenium
7 60 (2.11%) webpack
8 40 (1.40%) Visual Studio
9 38 (1.33%) TeamCity
10 31 (1.09%) CircleCI
11 29 (1.02%) Bitbucket
12 20 (0.70%) SoapUI
13 18 (0.63%) Babel
13 18 (0.63%) PHPUnit
14 17 (0.60%) Maven
15 13 (0.46%) Mocha
16 11 (0.39%) NUnit
17 10 (0.35%) Gradle
17 10 (0.35%) JUnit
17 10 (0.35%) Moq
General
1 420 (14.75%) Finance
2 399 (14.01%) Social Skills
3 302 (10.60%) Inclusion and Diversity
4 275 (9.66%) Marketing
5 219 (7.69%) Advertising
6 175 (6.14%) Front Office
7 137 (4.81%) Public Sector
8 114 (4.00%) Banking
9 100 (3.51%) Games
10 98 (3.44%) Analytical Skills
11 87 (3.05%) Law
12 80 (2.81%) Retail
13 71 (2.49%) Legal
14 48 (1.69%) Organisational Skills
14 48 (1.69%) Tech for Good
15 32 (1.12%) Manufacturing
16 30 (1.05%) Financial Institution
17 26 (0.91%) Health Technology
18 23 (0.81%) Automotive
19 19 (0.67%) Telecoms
Job Titles
1 1,450 (50.91%) Developer
2 895 (31.43%) Software Engineer
3 694 (24.37%) Senior
4 365 (12.82%) Senior Developer
5 303 (10.64%) Lead
6 294 (10.32%) Full-Stack Developer
7 285 (10.01%) React Developer
8 274 (9.62%) Full-Stack Engineer
9 272 (9.55%) Front-End Developer (Client-Side Developer)
10 232 (8.15%) .NET Developer
11 225 (7.90%) Senior Software Engineer
12 167 (5.86%) Developer/Software Engineer
13 146 (5.13%) Software Developer
14 134 (4.71%) C# Developer
15 125 (4.39%) Python Developer
16 112 (3.93%) PHP Developer
17 100 (3.51%) Front-End Engineer (Client-Side Engineer)
18 95 (3.34%) Python Engineer
19 94 (3.30%) UI Engineer
20 87 (3.05%) Architect
Libraries, Frameworks & Software Standards
1 992 (34.83%) AngularJS
2 896 (31.46%) Node.js
3 717 (25.18%) .NET
4 697 (24.47%) CSS
5 669 (23.49%) HTML
6 447 (15.70%) Vue
7 431 (15.13%) REST
8 282 (9.90%) Tailwind CSS
9 272 (9.55%) ASP.NET
10 247 (8.67%) RESTful
11 246 (8.64%) .NET Core
12 245 (8.60%) Redux
13 234 (8.22%) GraphQL
14 198 (6.95%) .NET Framework
15 166 (5.83%) Next.js
16 152 (5.34%) jQuery
17 148 (5.20%) Spring
18 136 (4.78%) Jest
19 135 (4.74%) Django
20 134 (4.71%) Laravel
Miscellaneous
1 210 (7.37%) Blog
2 198 (6.95%) Digital Media
3 153 (5.37%) Greenfield Project
4 143 (5.02%) Fixed Income
5 126 (4.42%) Cloud Native
6 103 (3.62%) Blockchain
7 86 (3.02%) Mobile App
8 79 (2.77%) Algorithms
9 74 (2.60%) Product Ownership
10 71 (2.49%) Self-Motivation
11 68 (2.39%) Data Structures
12 61 (2.14%) Hybrid Cloud
13 52 (1.83%) NHS
14 50 (1.76%) Public Cloud
15 49 (1.72%) Hedge funds
16 43 (1.51%) Distributed Systems
17 37 (1.30%) Private Cloud
18 36 (1.26%) Equities
19 35 (1.23%) IoT
20 34 (1.19%) NFT
Operating Systems
1 160 (5.62%) Linux
2 80 (2.81%) Windows
3 71 (2.49%) Android
4 59 (2.07%) Apple iOS
5 13 (0.46%) Unix
6 8 (0.28%) CentOS
6 8 (0.28%) Red Hat Enterprise Linux
7 6 (0.21%) Ubuntu
8 5 (0.18%) Debian
9 2 (0.070%) Rocky
9 2 (0.070%) VMS
9 2 (0.070%) Windows Server
10 1 (0.035%) AIX
10 1 (0.035%) Mac OS
Processes & Methodologies
1 1,319 (46.31%) Agile
2 1,295 (45.47%) Software Engineering
3 1,228 (43.12%) Full-Stack Development
4 539 (18.93%) User Experience
5 508 (17.84%) CI/CD
6 481 (16.89%) Front End Development
7 475 (16.68%) DevOps
8 435 (15.27%) Scrum
9 433 (15.20%) Problem-Solving
10 416 (14.61%) Microservices
11 378 (13.27%) Artificial Intelligence
12 330 (11.59%) E-Commerce
13 306 (10.74%) Mentoring
14 278 (9.76%) TDD
15 276 (9.69%) Web Development
16 255 (8.95%) Computer Science
17 251 (8.81%) Continuous Delivery
18 247 (8.67%) Fintech
18 247 (8.67%) OO
19 206 (7.23%) MVC
Programming Languages
1 1,697 (59.59%) JavaScript
2 1,453 (51.02%) TypeScript
3 816 (28.65%) C#
4 679 (23.84%) Python
5 571 (20.05%) SQL
6 508 (17.84%) Java
7 286 (10.04%) PHP
8 75 (2.63%) Rust
9 63 (2.21%) C++
10 49 (1.72%) Kotlin
11 44 (1.54%) Ruby
12 35 (1.23%) Solidity
13 34 (1.19%) Go
14 29 (1.02%) T-SQL
15 28 (0.98%) Bash
16 26 (0.91%) Scala
17 24 (0.84%) C
18 19 (0.67%) PowerShell
19 13 (0.46%) Bicep
20 12 (0.42%) Clojure
Qualifications
1 321 (11.27%) Degree
2 165 (5.79%) Security Cleared
3 129 (4.53%) Computer Science Degree
4 86 (3.02%) SC Cleared
5 41 (1.44%) DV Cleared
6 33 (1.16%) Master's Degree
7 19 (0.67%) DBS Check
8 6 (0.21%) PMI Certification
9 5 (0.18%) PMP
10 3 (0.11%) Microsoft Certification
11 2 (0.070%) Azure Certification
12 1 (0.035%) AWS Certification
12 1 (0.035%) AWS Certified Developer
12 1 (0.035%) CEH
12 1 (0.035%) CIPD
12 1 (0.035%) CISSP
12 1 (0.035%) Numerate Degree
12 1 (0.035%) PhD
12 1 (0.035%) Server+ Certification
Quality Assurance & Compliance
1 137 (4.81%) QA
2 83 (2.91%) Accessibility
3 26 (0.91%) WCAG
4 10 (0.35%) GDPR
5 7 (0.25%) MiFID
5 7 (0.25%) WAI
6 6 (0.21%) SLA
7 4 (0.14%) Data Quality
7 4 (0.14%) EMIR
8 2 (0.070%) California Consumer Privacy Act
8 2 (0.070%) ISO/IEC 27001
8 2 (0.070%) Software Quality Assurance
9 1 (0.035%) ISO 9001
9 1 (0.035%) NCSC
9 1 (0.035%) NIST
System Software
1 698 (24.51%) Docker
2 10 (0.35%) Active Directory
3 3 (0.11%) Virtual Desktop
4 1 (0.035%) Firmware
4 1 (0.035%) Varnish
Systems Management
1 646 (22.68%) Kubernetes
2 159 (5.58%) Terraform
3 22 (0.77%) Ansible
4 21 (0.74%) Puppet
5 18 (0.63%) Consul
6 17 (0.60%) Packer
7 13 (0.46%) Istio
8 12 (0.42%) Progress Chef
9 10 (0.35%) Grafana
10 8 (0.28%) Kibana
10 8 (0.28%) Prometheus
11 6 (0.21%) Argo
12 4 (0.14%) Single Sign-On
13 3 (0.11%) Active Directory Federation Services
13 3 (0.11%) Nagios
14 2 (0.070%) logstash
14 2 (0.070%) MIIS
15 1 (0.035%) Rancher
Vendors
1 186 (6.53%) Microsoft
2 158 (5.55%) Google
3 75 (2.63%) Red Hat
4 63 (2.21%) IBM
5 49 (1.72%) TikTok
6 36 (1.26%) Oracle
7 23 (0.81%) OpenAI
8 18 (0.63%) Adobe
9 14 (0.49%) Atlassian
9 14 (0.49%) Salesforce
10 12 (0.42%) F5
11 10 (0.35%) Bloomberg
11 10 (0.35%) Sitecore
12 8 (0.28%) Zend
13 7 (0.25%) New Relic
14 6 (0.21%) SAP
15 5 (0.18%) Cognizant
15 5 (0.18%) SaltStack
15 5 (0.18%) Xamarin
16 4 (0.14%) Splunk