Systems Analysis Jobs in London

Systems Analysis
England > London

The table below provides summary statistics for permanent job vacancies advertised in London requiring Systems Analysis skills. It includes a benchmarking guide to the annual salaries offered in vacancies that cited Systems Analysis over the 6 months leading up to 30 May 2025, comparing them to the same period in the previous two years.

6 months to
30 May 2025
Same period 2024 Same period 2023
Rank 350 446 516
Rank change year-on-year +96 +70 +243
Permanent jobs citing Systems Analysis 43 61 92
As % of all permanent jobs advertised in London 0.34% 0.25% 0.28%
As % of the Processes & Methodologies category 0.35% 0.28% 0.29%
Number of salaries quoted 34 53 69
10th Percentile £57,500 £47,000 £50,000
25th Percentile £69,976 £77,500 £57,500
Median annual salary (50th Percentile) £75,000 £85,000 £70,000
Median % change year-on-year -11.76% +21.43% -1.75%
75th Percentile £83,125 £107,500 £85,000
90th Percentile £93,125 - £96,000
England median annual salary £61,000 £62,500 £65,000
% change year-on-year -2.40% -3.85% +13.04%

All Process and Methodology Skills
London

Systems Analysis falls under the Processes and Methodologies category. For comparison with the information above, the following table provides summary statistics for all permanent job vacancies requiring process or methodology skills in London.

Permanent vacancies with a requirement for process or methodology skills 12,216 21,652 31,243
As % of all permanent jobs advertised in London 96.26% 90.32% 95.32%
Number of salaries quoted 6,929 15,871 22,511
10th Percentile £41,700 £37,500 £42,789
25th Percentile £55,500 £51,250 £55,000
Median annual salary (50th Percentile) £75,000 £70,000 £75,000
Median % change year-on-year +7.14% -6.67% +7.14%
75th Percentile £100,000 £95,000 £95,000
90th Percentile £122,500 £115,000 £115,055
England median annual salary £57,500 £55,000 £62,500
% change year-on-year +4.55% -12.00% +4.17%

Systems Analysis
Job Vacancy Trend in London

Job postings citing Systems Analysis as a proportion of all IT jobs advertised in London.
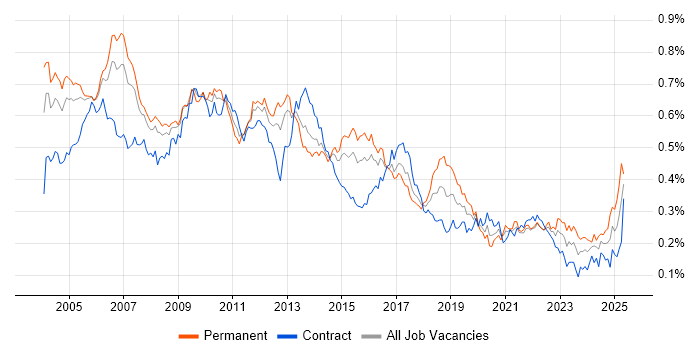
Job vacancy trend for Systems Analysis in London

Systems Analysis
Salary Trend in London

3-month moving average salary quoted in jobs citing Systems Analysis in London.

Salary trend for Systems Analysis in London

Systems Analysis
Salary Histogram in London

Salary distribution for jobs citing Systems Analysis in London over the 6 months to 30 May 2025.

Salary histogram for Systems Analysis in London

Systems Analysis
Job Locations in London

The table below looks at the demand and provides a guide to the median salaries quoted in IT jobs citing Systems Analysis within the London region over the 6 months to 30 May 2025. The 'Rank Change' column provides an indication of the change in demand within each location based on the same 6 month period last year.

Location Rank Change
on Same Period
Last Year
Matching
Permanent
IT Job Ads
Median Salary
Past 6 Months
Median Salary
% Change
on Same Period
Last Year
Live
Jobs
Central London +28 24 £75,000 -28.57% 1
Systems Analysis
England

Systems Analysis
Co-occurring Skills and Capabilities in London by Category

The follow tables expand on the table above by listing co-occurrences grouped by category. The same employment type, locality and period is covered with up to 20 co-occurrences shown in each of the following categories:

Application Platforms
1 11 (25.58%) SharePoint
2 3 (6.98%) Skype for Business
3 2 (4.65%) Apache
3 2 (4.65%) Confluence
Applications
1 10 (23.26%) Microsoft Excel
2 6 (13.95%) Microsoft Project
3 4 (9.30%) Microsoft Office
3 4 (9.30%) MS Visio
4 1 (2.33%) Microsoft PowerPoint
Business Applications
1 4 (9.30%) Salesforce CRM
2 2 (4.65%) SimCorp Dimension
Cloud Services
1 6 (13.95%) Azure
2 4 (9.30%) Salesforce Sales Cloud
2 4 (9.30%) Salesforce Service Cloud
3 3 (6.98%) Amazon CloudWatch
3 3 (6.98%) AWS
4 2 (4.65%) Amazon Kinesis
4 2 (4.65%) Amazon S3
4 2 (4.65%) Amazon SQS
4 2 (4.65%) AWS CloudFormation
4 2 (4.65%) AWS CloudTrail
4 2 (4.65%) AWS Lambda
4 2 (4.65%) AWS Step Functions
4 2 (4.65%) Cloud Computing
4 2 (4.65%) Serverless
5 1 (2.33%) Microsoft 365
Communications & Networking
1 3 (6.98%) Skype
Database & Business Intelligence
1 7 (16.28%) Data Warehouse
2 5 (11.63%) SQL Server
3 4 (9.30%) Enterprise Data Warehouse
4 2 (4.65%) Amazon Athena
4 2 (4.65%) Amazon Aurora
4 2 (4.65%) Amazon RDS
4 2 (4.65%) Amazon Redshift
4 2 (4.65%) Flink
5 1 (2.33%) Tableau
Development Applications
1 8 (18.60%) JIRA
2 5 (11.63%) Eclipse
3 4 (9.30%) Git
4 1 (2.33%) Jenkins
General
1 16 (37.21%) Finance
2 14 (32.56%) Social Skills
3 13 (30.23%) Analytical Skills
4 5 (11.63%) Inclusion and Diversity
5 4 (9.30%) General Ledger
5 4 (9.30%) Marketing
6 1 (2.33%) Law
6 1 (2.33%) Public Sector
Job Titles
1 33 (76.74%) Analyst
2 15 (34.88%) Business Analyst
3 13 (30.23%) Senior
4 11 (25.58%) Business Systems Analyst
4 11 (25.58%) Systems Analyst
5 10 (23.26%) Senior Analyst
6 7 (16.28%) Insurance Business Analyst
7 6 (13.95%) Technical Analyst
8 5 (11.63%) Developer
8 5 (11.63%) Senior Business Systems Analyst
8 5 (11.63%) Senior Systems Analyst
8 5 (11.63%) Technical Business Analyst
9 4 (9.30%) Applications Analyst
9 4 (9.30%) Insurance Systems Analyst
9 4 (9.30%) Salesforce Analyst
9 4 (9.30%) Senior Business Analyst
10 3 (6.98%) Senior Developer
11 2 (4.65%) Applications Specialist
11 2 (4.65%) Applications Support
11 2 (4.65%) Support Specialist
Libraries, Frameworks & Software Standards
1 10 (23.26%) RESTful
2 3 (6.98%) .NET
2 3 (6.98%) .NET Core
2 3 (6.98%) .NET Framework
2 3 (6.98%) AngularJS
2 3 (6.98%) ASP.NET Web API
2 3 (6.98%) CSS
2 3 (6.98%) HTML
2 3 (6.98%) HTML5
2 3 (6.98%) React
2 3 (6.98%) Sass
2 3 (6.98%) Vue
3 2 (4.65%) boto
3 2 (4.65%) GraphQL
3 2 (4.65%) Kafka
3 2 (4.65%) SAML
4 1 (2.33%) REST
4 1 (2.33%) SOAP
4 1 (2.33%) Spring
4 1 (2.33%) Spring Boot
Miscellaneous
1 6 (13.95%) Enterprise Software
2 3 (6.98%) Analytical Mindset
2 3 (6.98%) Management Information System
3 2 (4.65%) Onboarding
3 2 (4.65%) Public Cloud
4 1 (2.33%) CESG
4 1 (2.33%) Cloud Native
4 1 (2.33%) Data Centre
4 1 (2.33%) Renewable Energy
4 1 (2.33%) SCADA
4 1 (2.33%) Virtual Team
Operating Systems
1 2 (4.65%) Windows
Processes & Methodologies
1 16 (37.21%) Agile
2 13 (30.23%) Requirements Gathering
3 10 (23.26%) Business Analysis
3 10 (23.26%) DevOps
4 9 (20.93%) Document Management
4 9 (20.93%) User Acceptance Testing
4 9 (20.93%) User Stories
5 8 (18.60%) ITIL
5 8 (18.60%) Scrum
6 7 (16.28%) Acceptance Criteria
6 7 (16.28%) Data Modelling
6 7 (16.28%) Use Case
7 6 (13.95%) Continuous Improvement
7 6 (13.95%) Enterprise Architecture
8 5 (11.63%) Data Analysis
8 5 (11.63%) Process Improvement
9 4 (9.30%) Collaborative Working
9 4 (9.30%) CRM
9 4 (9.30%) ERP
9 4 (9.30%) Service Management
Programming Languages
1 18 (41.86%) SQL
2 8 (18.60%) Python
3 3 (6.98%) C#
3 3 (6.98%) JavaScript
3 3 (6.98%) TypeScript
4 1 (2.33%) Java
Qualifications
1 11 (25.58%) Degree
2 3 (6.98%) Security Cleared
3 1 (2.33%) CESG Certified Professional
3 1 (2.33%) CISM
3 1 (2.33%) CISSP
3 1 (2.33%) ISACA
Quality Assurance & Compliance
1 6 (13.95%) QA
2 1 (2.33%) COBIT
2 1 (2.33%) NIST
2 1 (2.33%) Solvency II
System Software
1 1 (2.33%) Docker
Systems Management
1 2 (4.65%) Single Sign-On
2 1 (2.33%) Grafana
2 1 (2.33%) Kubernetes
2 1 (2.33%) Prometheus
2 1 (2.33%) Terraform
Vendors
1 5 (11.63%) Microsoft
1 5 (11.63%) ServiceNow
2 4 (9.30%) Guidewire
2 4 (9.30%) Pardot
2 4 (9.30%) Salesforce
3 2 (4.65%) Okta
3 2 (4.65%) SimCorp
4 1 (2.33%) Civica
4 1 (2.33%) Facebook
4 1 (2.33%) Proofpoint
4 1 (2.33%) Rapid7
4 1 (2.33%) Trend Micro
4 1 (2.33%) YouTube
4 1 (2.33%) Zscaler