Use Case Jobs in London

Use Cases
England > London

The table below provides summary statistics for permanent job vacancies advertised in London requiring Use Case skills. It includes a benchmarking guide to the annual salaries offered in vacancies that cited Use Case over the 6 months leading up to 28 May 2025, comparing them to the same period in the previous two years.

6 months to
28 May 2025
Same period 2024 Same period 2023
Rank 225 212 199
Rank change year-on-year -13 -13 -1
Permanent jobs citing Use Case 177 358 606
As % of all permanent jobs advertised in London 1.41% 1.51% 1.83%
As % of the Processes & Methodologies category 1.47% 1.66% 1.92%
Number of salaries quoted 71 189 282
10th Percentile £62,500 £50,942 £52,500
25th Percentile £71,250 £62,500 £59,813
Median annual salary (50th Percentile) £80,000 £76,086 £70,000
Median % change year-on-year +5.14% +8.69% -6.67%
75th Percentile £91,875 £95,000 £87,500
90th Percentile £110,000 £115,000 £105,000
England median annual salary £62,250 £57,500 £65,000
% change year-on-year +8.26% -11.54% -3.70%

All Process and Methodology Skills
London

Use Case falls under the Processes and Methodologies category. For comparison with the information above, the following table provides summary statistics for all permanent job vacancies requiring process or methodology skills in London.

Permanent vacancies with a requirement for process or methodology skills 12,045 21,522 31,580
As % of all permanent jobs advertised in London 96.26% 90.48% 95.32%
Number of salaries quoted 6,842 15,847 22,804
10th Percentile £42,000 £37,500 £42,874
25th Percentile £56,250 £51,250 £55,000
Median annual salary (50th Percentile) £75,000 £70,000 £75,000
Median % change year-on-year +7.14% -6.67% +7.14%
75th Percentile £100,000 £95,000 £95,000
90th Percentile £125,000 £115,000 £115,000
England median annual salary £57,500 £55,000 £62,500
% change year-on-year +4.55% -12.00% +4.17%

Use Case
Job Vacancy Trend in London

Job postings citing Use Case as a proportion of all IT jobs advertised in London.
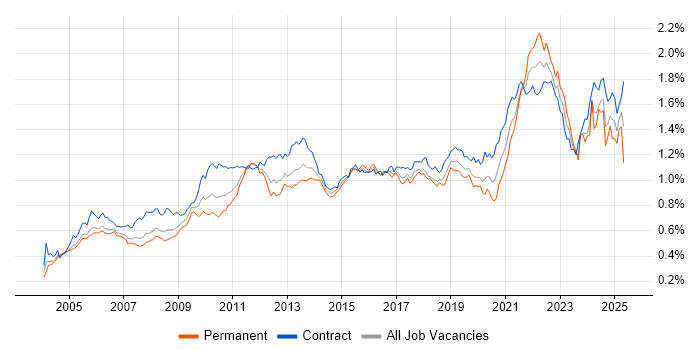
Job vacancy trend for Use Case in London

Use Case
Salary Trend in London

3-month moving average salary quoted in jobs citing Use Case in London.

Salary trend for Use Case in London

Use Case
Salary Histogram in London

Salary distribution for jobs citing Use Case in London over the 6 months to 28 May 2025.

Salary histogram for Use Case in London

Use Case
Job Locations in London

The table below looks at the demand and provides a guide to the median salaries quoted in IT jobs citing Use Case within the London region over the 6 months to 28 May 2025. The 'Rank Change' column provides an indication of the change in demand within each location based on the same 6 month period last year.

Location Rank Change
on Same Period
Last Year
Matching
Permanent
IT Job Ads
Median Salary
Past 6 Months
Median Salary
% Change
on Same Period
Last Year
Live
Jobs
Central London +36 37 £76,250 -7.58% 24
South London -21 6 - - 3
West London -14 5 - - 46
North London -11 4 - -
East London -17 3 - - 8
Use Case
England

Use Case
Co-occurring Skills and Capabilities in London by Category

The follow tables expand on the table above by listing co-occurrences grouped by category. The same employment type, locality and period is covered with up to 20 co-occurrences shown in each of the following categories:

Application Platforms
1 10 (5.65%) Apache Spark
2 5 (2.82%) Confluence
3 3 (1.69%) Apache
Applications
1 10 (5.65%) MS Visio
2 5 (2.82%) Microsoft Excel
3 4 (2.26%) Chatbot
4 2 (1.13%) Adobe XD
5 1 (0.56%) Microsoft Office
5 1 (0.56%) Microsoft PowerPoint
Business Applications
1 4 (2.26%) Remedy ITSM
2 2 (1.13%) Aladdin
2 2 (1.13%) Distributed Ledger
2 2 (1.13%) SAP S/4HANA
3 1 (0.56%) Dynamics CRM
3 1 (0.56%) Oracle Payroll
3 1 (0.56%) SAP CO
3 1 (0.56%) SAP FI
3 1 (0.56%) SAP FI/CO
3 1 (0.56%) SAP MM
3 1 (0.56%) SAP PS
3 1 (0.56%) Workday HCM
Cloud Services
1 50 (28.25%) AWS
2 43 (24.29%) Azure
3 25 (14.12%) Serverless
4 22 (12.43%) AWS Lambda
5 15 (8.47%) Microsoft Purview
6 14 (7.91%) Collibra
6 14 (7.91%) GCP
6 14 (7.91%) Power Platform
7 6 (3.39%) dbt
7 6 (3.39%) Google Analytics
7 6 (3.39%) SaaS
8 5 (2.82%) Amazon Bedrock
8 5 (2.82%) Azure AI
8 5 (2.82%) Snowflake
9 4 (2.26%) Azure DevOps
9 4 (2.26%) Azure Machine Learning
9 4 (2.26%) Azure Sentinel
10 3 (1.69%) Azure Data Factory
10 3 (1.69%) Azure Functions
10 3 (1.69%) Miro
Communications & Networking
1 22 (12.43%) Broadband
1 22 (12.43%) SSH
1 22 (12.43%) SSL
2 4 (2.26%) Firewall
3 1 (0.56%) 4G
3 1 (0.56%) 5G
3 1 (0.56%) DNS
3 1 (0.56%) Network Security
3 1 (0.56%) Radio Access Network
3 1 (0.56%) WAN
Database & Business Intelligence
1 14 (7.91%) Metadata
1 14 (7.91%) Power BI
2 11 (6.21%) Data Warehouse
2 11 (6.21%) Tableau
3 9 (5.08%) IBM InfoSphere
4 7 (3.95%) Amazon Redshift
4 7 (3.95%) NoSQL
5 6 (3.39%) Hadoop
6 5 (2.82%) Big Data
6 5 (2.82%) Relational Database
7 4 (2.26%) Apache Hive
7 4 (2.26%) Data Vault
7 4 (2.26%) Oracle Database
8 3 (1.69%) Data Lake
8 3 (1.69%) Delta Lake
8 3 (1.69%) Neo4j
8 3 (1.69%) Parquet
8 3 (1.69%) SQL Server Integration Services
9 2 (1.13%) Elasticsearch
10 1 (0.56%) DynamoDB
Development Applications
1 7 (3.95%) JIRA
2 6 (3.39%) Grunt
2 6 (3.39%) Jasmine
2 6 (3.39%) Mocha
2 6 (3.39%) webpack
3 5 (2.82%) Eclipse
4 2 (1.13%) Git
5 1 (0.56%) Selenium
5 1 (0.56%) Team Foundation Server
General
1 85 (48.02%) Social Skills
2 56 (31.64%) Finance
3 52 (29.38%) Analytical Skills
4 41 (23.16%) Law
5 37 (20.90%) Marketing
6 17 (9.60%) Presentation Skills
7 16 (9.04%) Banking
8 14 (7.91%) Inclusion and Diversity
9 11 (6.21%) Publishing
9 11 (6.21%) Retail
10 10 (5.65%) Retail Banking
11 7 (3.95%) Advertising
12 6 (3.39%) Brand Awareness
12 6 (3.39%) Legal
13 5 (2.82%) Financial Institution
14 4 (2.26%) Back Office
15 2 (1.13%) Organisational Skills
15 2 (1.13%) Public Sector
15 2 (1.13%) Telecoms
16 1 (0.56%) Czech Language
Job Titles
1 36 (20.34%) Analyst
2 34 (19.21%) Lead
3 32 (18.08%) Senior
4 23 (12.99%) Business Analyst
5 22 (12.43%) Cloud Engineer
5 22 (12.43%) DevOps Engineer
6 15 (8.47%) Architect
6 15 (8.47%) Senior Manager
7 11 (6.21%) Senior Analyst
8 9 (5.08%) Data Steward
8 9 (5.08%) Developer
9 8 (4.52%) Consultant
9 8 (4.52%) Data Engineer
9 8 (4.52%) Head of Business Intelligence
9 8 (4.52%) Senior Transformation Manager
9 8 (4.52%) Solutions Architect
9 8 (4.52%) Transformation Manager
10 7 (3.95%) Data Scientist
10 7 (3.95%) Lead Developer
10 7 (3.95%) Senior Data Scientist
Libraries, Frameworks & Software Standards
1 30 (16.95%) RESTful
2 22 (12.43%) Web Services
3 8 (4.52%) CSS
4 7 (3.95%) AngularJS
4 7 (3.95%) Kafka
5 6 (3.39%) Ajax
5 6 (3.39%) Bootstrap
5 6 (3.39%) Chai
5 6 (3.39%) Enzyme
5 6 (3.39%) Jest
5 6 (3.39%) LESS
5 6 (3.39%) MobX
5 6 (3.39%) OAuth
5 6 (3.39%) OAuth2
5 6 (3.39%) OpenID
5 6 (3.39%) React
5 6 (3.39%) Redux
5 6 (3.39%) Sass
5 6 (3.39%) Semantic UI
5 6 (3.39%) Vue
Miscellaneous
1 34 (19.21%) Management Information System
2 31 (17.51%) Onboarding
3 22 (12.43%) Cyber Threat
3 22 (12.43%) Cyberattack
3 22 (12.43%) PKI
4 12 (6.78%) Cloud Native
5 10 (5.65%) Product Ownership
6 6 (3.39%) Analytical Mindset
6 6 (3.39%) Derivative
6 6 (3.39%) Digital Media
6 6 (3.39%) Enterprise Software
6 6 (3.39%) Multi-touch
7 5 (2.82%) Algorithms
7 5 (2.82%) Reference Data
8 4 (2.26%) Foreign Exchange (FX)
9 3 (1.69%) CSOC
9 3 (1.69%) Virtual Team
10 2 (1.13%) Blockchain
10 2 (1.13%) Cyber Defence
10 2 (1.13%) Security Operations Centre
Operating Systems
1 4 (2.26%) Linux
2 3 (1.69%) Windows
3 2 (1.13%) Unix
4 1 (0.56%) Android
4 1 (0.56%) Apple iOS
4 1 (0.56%) Windows 10
4 1 (0.56%) Windows Server
Processes & Methodologies
1 62 (35.03%) Agile
2 53 (29.94%) Artificial Intelligence
3 48 (27.12%) Roadmaps
4 45 (25.42%) Analytics
5 41 (23.16%) DevOps
6 35 (19.77%) Data Modelling
7 32 (18.08%) Problem-Solving
8 31 (17.51%) Cybersecurity
9 30 (16.95%) Machine Learning
10 26 (14.69%) Data Science
10 26 (14.69%) User Stories
11 24 (13.56%) CI/CD
12 23 (12.99%) Business Intelligence
12 23 (12.99%) Data Governance
12 23 (12.99%) Decision-Making
12 23 (12.99%) Project Management
12 23 (12.99%) Stakeholder Management
13 22 (12.43%) Deployment Automation
13 22 (12.43%) Programme Delivery
13 22 (12.43%) Vulnerability Assessment
Programming Languages
1 55 (31.07%) Python
2 37 (20.90%) SQL
3 8 (4.52%) Java
3 8 (4.52%) JavaScript
4 6 (3.39%) TypeScript
5 5 (2.82%) C
5 5 (2.82%) C++
6 4 (2.26%) Apex Code
7 3 (1.69%) Cypher
7 3 (1.69%) T-SQL
8 2 (1.13%) Bash
8 2 (1.13%) Data Analysis Expressions
8 2 (1.13%) Scala
9 1 (0.56%) C#
9 1 (0.56%) Go
9 1 (0.56%) Kusto Query Language
9 1 (0.56%) Search Processing Language
9 1 (0.56%) SOQL
Qualifications
1 32 (18.08%) Degree
2 7 (3.95%) Computer Science Degree
2 7 (3.95%) SC Cleared
2 7 (3.95%) Security Cleared
3 5 (2.82%) Master's Degree
4 4 (2.26%) PhD
5 3 (1.69%) CBAP
6 2 (1.13%) CISSP
6 2 (1.13%) CompTIA Security+
6 2 (1.13%) GCFA
6 2 (1.13%) GCIA
6 2 (1.13%) GCIH
7 1 (0.56%) ACSA
7 1 (0.56%) ACSP
7 1 (0.56%) CASP
7 1 (0.56%) CCSP
7 1 (0.56%) Cisco Certification
7 1 (0.56%) CISM
7 1 (0.56%) ISSAP
7 1 (0.56%) PMI Certification
Quality Assurance & Compliance
1 25 (14.12%) NIST
2 22 (12.43%) ISO/IEC 27001
3 17 (9.60%) Data Quality
3 17 (9.60%) GDPR
4 15 (8.47%) Accessibility
5 3 (1.69%) HIPAA
6 2 (1.13%) MiFID
7 1 (0.56%) COBIT
7 1 (0.56%) Dodd-Frank
7 1 (0.56%) NCSC
7 1 (0.56%) PSD2
7 1 (0.56%) QA
System Software
1 24 (13.56%) Active Directory
2 8 (4.52%) Docker
3 1 (0.56%) zsh
Systems Management
1 24 (13.56%) Terraform
2 10 (5.65%) Kubernetes
3 3 (1.69%) QRadar
4 1 (0.56%) Ansible
4 1 (0.56%) Automic
4 1 (0.56%) Grafana
4 1 (0.56%) Kibana
4 1 (0.56%) logstash
4 1 (0.56%) Prometheus
4 1 (0.56%) SCCM
4 1 (0.56%) Single Sign-On
Vendors
1 31 (17.51%) Microsoft
2 22 (12.43%) Thales
3 16 (9.04%) Informatica
4 15 (8.47%) Databricks
5 10 (5.65%) IBM
6 8 (4.52%) Google
7 7 (3.95%) Salesforce
8 6 (3.39%) Yahoo!
9 5 (2.82%) OpenAI
9 5 (2.82%) Oracle
9 5 (2.82%) SAP
10 4 (2.26%) Foundry
10 4 (2.26%) Remedy
10 4 (2.26%) ServiceNow
10 4 (2.26%) Splunk
11 2 (1.13%) Adobe
11 2 (1.13%) Avaloq
11 2 (1.13%) Bloomberg
11 2 (1.13%) CyberArk
11 2 (1.13%) Talend