Data Analysis Jobs in London

Data Analysis
England > London

The table below provides summary statistics for permanent job vacancies advertised in London requiring Data Analysis skills. It includes a benchmarking guide to the annual salaries offered in vacancies that cited Data Analysis over the 6 months leading up to 28 May 2025, comparing them to the same period in the previous two years.

6 months to
28 May 2025
Same period 2024 Same period 2023
Rank 98 88 131
Rank change year-on-year -10 +43 -8
Permanent jobs citing Data Analysis 401 775 922
As % of all permanent jobs advertised in London 3.20% 3.26% 2.78%
As % of the Processes & Methodologies category 3.33% 3.60% 2.92%
Number of salaries quoted 224 477 566
10th Percentile £42,500 £34,341 £37,500
25th Percentile £52,500 £45,651 £46,563
Median annual salary (50th Percentile) £70,000 £60,000 £65,000
Median % change year-on-year +16.67% -7.69% +8.33%
75th Percentile £90,000 £75,000 £82,500
90th Percentile £109,250 £95,000 £100,000
England median annual salary £55,000 £52,500 £52,500
% change year-on-year +4.76% - -4.55%

All Process and Methodology Skills
London

Data Analysis falls under the Processes and Methodologies category. For comparison with the information above, the following table provides summary statistics for all permanent job vacancies requiring process or methodology skills in London.

Permanent vacancies with a requirement for process or methodology skills 12,045 21,522 31,580
As % of all permanent jobs advertised in London 96.26% 90.48% 95.32%
Number of salaries quoted 6,842 15,847 22,804
10th Percentile £42,000 £37,500 £42,874
25th Percentile £56,250 £51,250 £55,000
Median annual salary (50th Percentile) £75,000 £70,000 £75,000
Median % change year-on-year +7.14% -6.67% +7.14%
75th Percentile £100,000 £95,000 £95,000
90th Percentile £125,000 £115,000 £115,000
England median annual salary £57,500 £55,000 £62,500
% change year-on-year +4.55% -12.00% +4.17%

Data Analysis
Job Vacancy Trend in London

Job postings citing Data Analysis as a proportion of all IT jobs advertised in London.
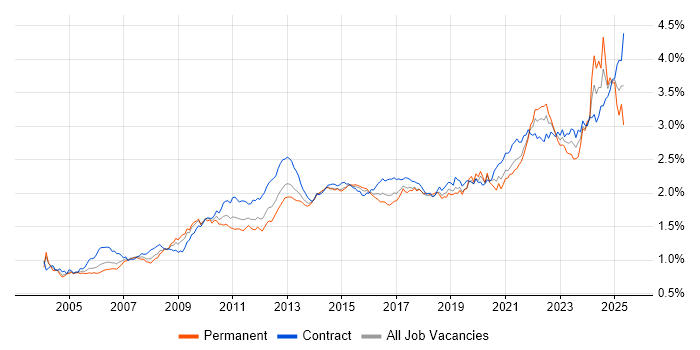
Job vacancy trend for Data Analysis in London

Data Analysis
Salary Trend in London

3-month moving average salary quoted in jobs citing Data Analysis in London.

Salary trend for Data Analysis in London

Data Analysis
Salary Histogram in London

Salary distribution for jobs citing Data Analysis in London over the 6 months to 28 May 2025.

Salary histogram for Data Analysis in London

Data Analysis
Job Locations in London

The table below looks at the demand and provides a guide to the median salaries quoted in IT jobs citing Data Analysis within the London region over the 6 months to 28 May 2025. The 'Rank Change' column provides an indication of the change in demand within each location based on the same 6 month period last year.

Location Rank Change
on Same Period
Last Year
Matching
Permanent
IT Job Ads
Median Salary
Past 6 Months
Median Salary
% Change
on Same Period
Last Year
Live
Jobs
Central London -19 74 £70,000 +27.27% 33
South London -16 10 £68,750 +78.39% 11
West London +28 9 £63,250 -17.86% 86
East London -14 5 £87,500 +90.22% 5
Data Analysis
England

Data Analysis
Co-occurring Skills and Capabilities in London by Category

The follow tables expand on the table above by listing co-occurrences grouped by category. The same employment type, locality and period is covered with up to 20 co-occurrences shown in each of the following categories:

Application Platforms
1 14 (3.49%) SharePoint
2 9 (2.24%) CMS
3 8 (2.00%) SAS
4 7 (1.75%) Confluence
5 3 (0.75%) nginx
6 2 (0.50%) Apache Spark
6 2 (0.50%) Microsoft Exchange
Applications
1 66 (16.46%) Microsoft Excel
2 26 (6.48%) Microsoft Office
3 7 (1.75%) SPSS
4 6 (1.50%) MS Visio
5 5 (1.25%) Microsoft PowerPoint
6 4 (1.00%) Photoshop
6 4 (1.00%) Spreadsheet
7 1 (0.25%) Adobe XD
7 1 (0.25%) Oracle Smart View
7 1 (0.25%) Sketch
7 1 (0.25%) SPSS Modeler
Business Applications
1 10 (2.49%) Dynamics CRM
2 8 (2.00%) Raiser’s Edge
3 3 (0.75%) Workday HCM
4 2 (0.50%) Endur
4 2 (0.50%) NetSuite
4 2 (0.50%) Oracle EBS
4 2 (0.50%) Oracle ERP
4 2 (0.50%) SAP Oil and Gas
5 1 (0.25%) Actimize
5 1 (0.25%) Cloudability
5 1 (0.25%) Elite 3E
5 1 (0.25%) Infor M3
5 1 (0.25%) Maximo
5 1 (0.25%) Oracle Applications
5 1 (0.25%) Oracle EBS R12
5 1 (0.25%) Oracle Procure-to-Pay
5 1 (0.25%) SAP CO
5 1 (0.25%) SAP ERP
5 1 (0.25%) SAP FI
5 1 (0.25%) SAP FI/CO
Cloud Services
1 118 (29.43%) Power Platform
2 65 (16.21%) Azure
3 38 (9.48%) AWS
4 23 (5.74%) Google Analytics
5 21 (5.24%) Azure Data Factory
6 17 (4.24%) Adobe Analytics
6 17 (4.24%) Azure DevOps
7 16 (3.99%) Microsoft Purview
8 15 (3.74%) Microsoft 365
8 15 (3.74%) SaaS
9 14 (3.49%) Dynamics 365
9 14 (3.49%) Power Automate
10 12 (2.99%) Azure Synapse Analytics
10 12 (2.99%) GCP
10 12 (2.99%) PowerApps
11 9 (2.24%) Azure Monitor
11 9 (2.24%) Collibra
11 9 (2.24%) Microsoft Copilot
12 8 (2.00%) Figma
13 7 (1.75%) Google Ads
Communications & Networking
1 11 (2.74%) Internet
2 6 (1.50%) Wi-Fi
3 1 (0.25%) Firewall
3 1 (0.25%) Intranet
Database & Business Intelligence
1 116 (28.93%) Power BI
2 55 (13.72%) Tableau
3 28 (6.98%) Data Warehouse
4 16 (3.99%) Power Query
5 13 (3.24%) SQL Server
6 12 (2.99%) SQL Server Integration Services
7 11 (2.74%) Metadata
8 10 (2.49%) Data Lake
8 10 (2.49%) MySQL
9 9 (2.24%) IBM InfoSphere
10 8 (2.00%) BusinessObjects
10 8 (2.00%) SQL Server Reporting Services
11 7 (1.75%) Relational Database
12 6 (1.50%) Enterprise Data Warehouse
12 6 (1.50%) Hadoop
13 5 (1.25%) Apache Hive
13 5 (1.25%) Looker
14 4 (1.00%) Big Data
14 4 (1.00%) KDB
14 4 (1.00%) PowerPivot
Development Applications
1 16 (3.99%) JIRA
2 6 (1.50%) GitLab
3 5 (1.25%) Git
4 4 (1.00%) SonarQube
4 4 (1.00%) Sonatype Nexus
5 2 (0.50%) Jenkins
5 2 (0.50%) Selenium
5 2 (0.50%) Visual Studio Team System
6 1 (0.25%) Axure RP
6 1 (0.25%) Katalon Studio
6 1 (0.25%) Spinnaker
6 1 (0.25%) Storybook
6 1 (0.25%) WaveMaker
General
1 207 (51.62%) Social Skills
2 146 (36.41%) Finance
3 125 (31.17%) Analytical Skills
4 52 (12.97%) Marketing
5 35 (8.73%) Banking
6 34 (8.48%) Presentation Skills
7 32 (7.98%) Law
8 22 (5.49%) Legal
9 21 (5.24%) Inclusion and Diversity
10 20 (4.99%) Retail
11 18 (4.49%) Advertising
11 18 (4.49%) Public Sector
12 13 (3.24%) Telecoms
13 11 (2.74%) Front Office
13 11 (2.74%) Influencing Skills
14 9 (2.24%) Documentation Skills
15 8 (2.00%) Publishing
16 7 (1.75%) Back Office
16 7 (1.75%) Games
16 7 (1.75%) Local Government
Job Titles
1 182 (45.39%) Analyst
2 71 (17.71%) Business Analyst
3 56 (13.97%) Data Analyst
4 46 (11.47%) Senior
5 36 (8.98%) Lead
6 30 (7.48%) Developer
7 26 (6.48%) Data Engineer
7 26 (6.48%) Senior Analyst
8 19 (4.74%) Data Insight Analyst
8 19 (4.74%) Insight Analyst
8 19 (4.74%) Insight Data Analyst
9 17 (4.24%) Financial Analyst
10 13 (3.24%) Senior Business Analyst
11 12 (2.99%) Azure Engineer
12 11 (2.74%) Senior Developer
13 10 (2.49%) Business Intelligence Analyst
13 10 (2.49%) Business Intelligence Developer
14 9 (2.24%) Data Steward
14 9 (2.24%) Technical Analyst
14 9 (2.24%) Technical Business Analyst
Libraries, Frameworks & Software Standards
1 17 (4.24%) PySpark
2 10 (2.49%) REST
3 8 (2.00%) CSS
4 7 (1.75%) HTML
5 6 (1.50%) .NET
5 6 (1.50%) Flask
5 6 (1.50%) Web Services
6 5 (1.25%) Django
6 5 (1.25%) EDI
6 5 (1.25%) JSON
6 5 (1.25%) SOAP
7 4 (1.00%) NumPy
7 4 (1.00%) Oracle Fusion
8 3 (0.75%) FIX Protocol
8 3 (0.75%) LEMP Stack
8 3 (0.75%) PyTorch
8 3 (0.75%) scikit-learn
8 3 (0.75%) TensorFlow
9 2 (0.50%) Lightning Web Components
9 2 (0.50%) XML
Miscellaneous
1 23 (5.74%) Self-Motivation
2 16 (3.99%) Management Information System
3 14 (3.49%) Product Ownership
4 13 (3.24%) Derivative
5 10 (2.49%) Legacy Systems
6 9 (2.24%) Algorithms
6 9 (2.24%) Social Media
7 7 (1.75%) Analytical Mindset
7 7 (1.75%) Data Structures
7 7 (1.75%) OTC Derivatives
7 7 (1.75%) Security Posture
7 7 (1.75%) Taxonomies
8 5 (1.25%) Distributed Computing
8 5 (1.25%) Onboarding
8 5 (1.25%) Pricing Data
9 4 (1.00%) Blog
9 4 (1.00%) Data Centre
9 4 (1.00%) NHS
10 3 (0.75%) Freedom of Information
10 3 (0.75%) Tandem
Operating Systems
1 8 (2.00%) Windows
2 6 (1.50%) Linux
Processes & Methodologies
1 140 (34.91%) Analytics
2 129 (32.17%) Problem-Solving
3 116 (28.93%) Business Intelligence
4 97 (24.19%) Visualisation
5 96 (23.94%) Decision-Making
6 68 (16.96%) Agile
7 61 (15.21%) Artificial Intelligence
8 60 (14.96%) Data Analytics
9 57 (14.21%) Data Modelling
9 57 (14.21%) Data Visualisation
10 52 (12.97%) Business Analysis
11 51 (12.72%) Continuous Improvement
12 45 (11.22%) User Experience
13 44 (10.97%) Actionable Insight
13 44 (10.97%) Project Management
14 43 (10.72%) Computer Science
14 43 (10.72%) Data Management
15 38 (9.48%) Mentoring
16 37 (9.23%) Data Science
16 37 (9.23%) Risk Management
Programming Languages
1 162 (40.40%) SQL
2 94 (23.44%) Python
3 20 (4.99%) JavaScript
4 18 (4.49%) R
5 13 (3.24%) Data Analysis Expressions
6 12 (2.99%) C#
7 11 (2.74%) PowerShell
8 6 (1.50%) Scala
9 5 (1.25%) Java
9 5 (1.25%) MATLAB
10 4 (1.00%) C++
10 4 (1.00%) Kusto Query Language
10 4 (1.00%) PHP
11 3 (0.75%) T-SQL
12 2 (0.50%) VBA
13 1 (0.25%) Kotlin
13 1 (0.25%) Perl
Qualifications
1 117 (29.18%) Degree
2 42 (10.47%) Master's Degree
3 23 (5.74%) Security Cleared
4 15 (3.74%) Azure Certification
5 12 (2.99%) Computer Science Degree
5 12 (2.99%) SC Cleared
6 10 (2.49%) DBS Check
7 9 (2.24%) MBA
8 8 (2.00%) AWS Certification
8 8 (2.00%) Microsoft Certification
9 7 (1.75%) AWS Certified Cloud Practitioner
9 7 (1.75%) CISM
9 7 (1.75%) CRISC
10 6 (1.50%) PhD
11 4 (1.00%) ACCA
11 4 (1.00%) CIMA
11 4 (1.00%) Numerate Degree
11 4 (1.00%) PMI Certification
12 3 (0.75%) CBAP
12 3 (0.75%) DV Cleared
Quality Assurance & Compliance
1 55 (13.72%) Data Quality
2 28 (6.98%) GDPR
3 18 (4.49%) Accessibility
4 13 (3.24%) ISO/IEC 27001
5 9 (2.24%) GRC
6 8 (2.00%) Actionable Recommendations
6 8 (2.00%) NIST
7 7 (1.75%) SOC 1
7 7 (1.75%) SOC 2
8 6 (1.50%) NIST 800
8 6 (1.50%) QA
9 4 (1.00%) COREP
9 4 (1.00%) SLA
10 3 (0.75%) EMIR
10 3 (0.75%) IFRS
10 3 (0.75%) MiFID
11 2 (0.50%) COBIT
12 1 (0.25%) Basel III
12 1 (0.25%) IFRS 9
12 1 (0.25%) Solvency II
System Software
1 14 (3.49%) Docker
2 3 (0.75%) Samba
3 1 (0.25%) Active Directory
3 1 (0.25%) Virtual Desktop
3 1 (0.25%) VMware Infrastructure
3 1 (0.25%) vSphere
Systems Management
1 19 (4.74%) Terraform
2 14 (3.49%) Kubernetes
3 9 (2.24%) Ansible
4 8 (2.00%) RSA Archer
5 2 (0.50%) Prometheus
6 1 (0.25%) Grafana
6 1 (0.25%) Puppet
6 1 (0.25%) vRealize
Vendors
1 106 (26.43%) Microsoft
2 42 (10.47%) Google
3 22 (5.49%) Adobe
4 19 (4.74%) Databricks
5 12 (2.99%) SAP
6 10 (2.49%) IBM
6 10 (2.49%) Informatica
7 9 (2.24%) Oracle
8 7 (1.75%) Omniture
9 6 (1.50%) HubSpot
9 6 (1.50%) ServiceNow
9 6 (1.50%) TikTok
10 5 (1.25%) Guidewire
10 5 (1.25%) Salesforce
10 5 (1.25%) Splunk
10 5 (1.25%) Vertica
11 4 (1.00%) Alteryx
11 4 (1.00%) Workday
12 3 (0.75%) Bloomberg
12 3 (0.75%) Cognos