Collaborative Working Jobs in London

Collaborative Working
England > London

The table below provides summary statistics for permanent job vacancies advertised in London requiring Collaborative Working skills. It includes a benchmarking guide to the annual salaries offered in vacancies that cited Collaborative Working over the 6 months leading up to 28 May 2025, comparing them to the same period in the previous two years.

6 months to
28 May 2025
Same period 2024 Same period 2023
Rank 82 106 141
Rank change year-on-year +24 +35 +1
Permanent jobs citing Collaborative Working 485 647 877
As % of all permanent jobs advertised in London 3.88% 2.72% 2.65%
As % of the Processes & Methodologies category 4.03% 3.01% 2.78%
Number of salaries quoted 214 493 544
10th Percentile £36,434 £35,802 £42,500
25th Percentile £50,188 £46,250 £55,000
Median annual salary (50th Percentile) £65,000 £67,500 £73,500
Median % change year-on-year -3.70% -8.16% +5.00%
75th Percentile £82,500 £81,250 £92,500
90th Percentile £95,000 £105,000 £120,000
England median annual salary £55,000 £50,000 £60,000
% change year-on-year +10.00% -16.67% -

All Process and Methodology Skills
London

Collaborative Working falls under the Processes and Methodologies category. For comparison with the information above, the following table provides summary statistics for all permanent job vacancies requiring process or methodology skills in London.

Permanent vacancies with a requirement for process or methodology skills 12,045 21,522 31,580
As % of all permanent jobs advertised in London 96.26% 90.48% 95.32%
Number of salaries quoted 6,842 15,847 22,804
10th Percentile £42,000 £37,500 £42,874
25th Percentile £56,250 £51,250 £55,000
Median annual salary (50th Percentile) £75,000 £70,000 £75,000
Median % change year-on-year +7.14% -6.67% +7.14%
75th Percentile £100,000 £95,000 £95,000
90th Percentile £125,000 £115,000 £115,000
England median annual salary £57,500 £55,000 £62,500
% change year-on-year +4.55% -12.00% +4.17%

Collaborative Working
Job Vacancy Trend in London

Job postings citing Collaborative Working as a proportion of all IT jobs advertised in London.
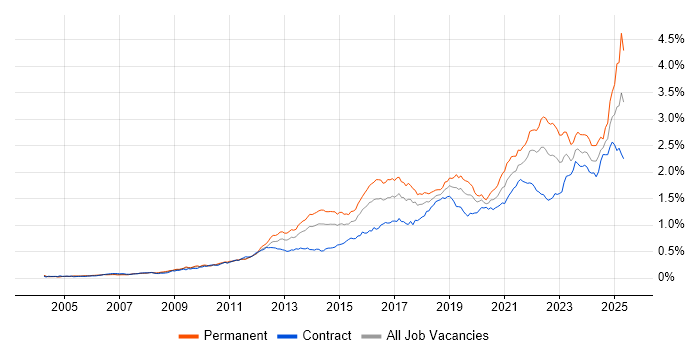
Job vacancy trend for Collaborative Working in London

Collaborative Working
Salary Trend in London

3-month moving average salary quoted in jobs citing Collaborative Working in London.

Salary trend for Collaborative Working in London

Collaborative Working
Salary Histogram in London

Salary distribution for jobs citing Collaborative Working in London over the 6 months to 28 May 2025.

Salary histogram for Collaborative Working in London

Collaborative Working
Job Locations in London

The table below looks at the demand and provides a guide to the median salaries quoted in IT jobs citing Collaborative Working within the London region over the 6 months to 28 May 2025. The 'Rank Change' column provides an indication of the change in demand within each location based on the same 6 month period last year.

Location Rank Change
on Same Period
Last Year
Matching
Permanent
IT Job Ads
Median Salary
Past 6 Months
Median Salary
% Change
on Same Period
Last Year
Live
Jobs
Central London +24 117 £80,000 +8.11% 59
South London +27 54 £34,000 -22.73% 3
West London +39 26 - - 98
East London -3 16 £31,500 -16.00% 16
North London -7 10 £55,000 +71.55% 3
Collaborative Working
England

Collaborative Working
Co-occurring Skills and Capabilities in London by Category

The follow tables expand on the table above by listing co-occurrences grouped by category. The same employment type, locality and period is covered with up to 20 co-occurrences shown in each of the following categories:

Application Platforms
1 29 (5.98%) CMS
2 17 (3.51%) Microsoft Exchange
3 13 (2.68%) WordPress
4 11 (2.27%) nginx
5 10 (2.06%) Drupal
5 10 (2.06%) SharePoint
6 8 (1.65%) Confluence
7 5 (1.03%) Apache Airflow
8 1 (0.21%) Apache
8 1 (0.21%) Apache Spark
8 1 (0.21%) OpenStack
8 1 (0.21%) Oracle Workflow
8 1 (0.21%) SAS
Applications
1 30 (6.19%) Microsoft Excel
2 13 (2.68%) Microsoft Office
3 7 (1.44%) Microsoft PowerPoint
4 6 (1.24%) InDesign
5 4 (0.82%) Adobe Creative Suite
6 2 (0.41%) Adobe XD
6 2 (0.41%) Blender
6 2 (0.41%) Maya
6 2 (0.41%) Microsoft Project
6 2 (0.41%) Sketch
7 1 (0.21%) Adobe Illustrator
7 1 (0.21%) Adobe Premiere
7 1 (0.21%) AutoCAD
7 1 (0.21%) Camtasia
7 1 (0.21%) Final Cut Pro
7 1 (0.21%) MS Visio
7 1 (0.21%) Photoshop
7 1 (0.21%) SPSS
7 1 (0.21%) Trello
Business Applications
1 20 (4.12%) NetSuite
2 5 (1.03%) Oracle EBS
3 3 (0.62%) Oracle Applications
3 3 (0.62%) Orchestrade
3 3 (0.62%) SAP S/4HANA
4 2 (0.41%) Dynamics CRM
4 2 (0.41%) Salesforce CRM
4 2 (0.41%) SAP CO
4 2 (0.41%) SAP FI
4 2 (0.41%) SAP FI/CO
5 1 (0.21%) Aladdin
5 1 (0.21%) iTrent
Cloud Services
1 84 (17.32%) Azure
2 76 (15.67%) AWS
3 37 (7.63%) Power Platform
4 35 (7.22%) Microsoft 365
5 20 (4.12%) Amazon EKS
5 20 (4.12%) SaaS
6 17 (3.51%) Azure DevOps
7 15 (3.09%) Google Analytics
8 12 (2.47%) AWS CloudFormation
9 10 (2.06%) Serverless
10 9 (1.86%) Amazon EC2
10 9 (1.86%) Amazon ECS
11 7 (1.44%) Google Ads
11 7 (1.44%) Google Sheets
12 6 (1.24%) Dynamics 365
12 6 (1.24%) Entra ID
12 6 (1.24%) Figma
13 5 (1.03%) Cloud Computing
13 5 (1.03%) GCP
13 5 (1.03%) PaaS
Communications & Networking
1 20 (4.12%) TCP/IP
2 17 (3.51%) DHCP
2 17 (3.51%) DNS
3 15 (3.09%) LAN
3 15 (3.09%) WAN
4 10 (2.06%) Internet
5 8 (1.65%) Firewall
6 6 (1.24%) Network Security
6 6 (1.24%) Wi-Fi
7 5 (1.03%) VPN
8 4 (0.82%) VLAN
9 3 (0.62%) Intranet
10 2 (0.41%) BGP
10 2 (0.41%) Intrusion Detection
10 2 (0.41%) MPLS
10 2 (0.41%) OSPF
10 2 (0.41%) SSH
11 1 (0.21%) ADSL
11 1 (0.21%) Broadband
11 1 (0.21%) HTTP
Database & Business Intelligence
1 29 (5.98%) Power BI
2 20 (4.12%) Relational Database
3 19 (3.92%) Big Data
4 17 (3.51%) SQL Server
5 13 (2.68%) Elasticsearch
6 11 (2.27%) PostgreSQL
6 11 (2.27%) RDBMS
6 11 (2.27%) Tableau
7 7 (1.44%) SQL Server Reporting Services
8 6 (1.24%) GIS
8 6 (1.24%) Power Query
9 3 (0.62%) NoSQL
10 2 (0.41%) Data Mining
10 2 (0.41%) MySQL
11 1 (0.21%) DB2
11 1 (0.21%) Hadoop
11 1 (0.21%) KDB
11 1 (0.21%) MongoDB
11 1 (0.21%) Oracle Reports
11 1 (0.21%) SAP BW
Development Applications
1 20 (4.12%) Git
2 19 (3.92%) Jenkins
3 13 (2.68%) JIRA
4 8 (1.65%) JMeter
4 8 (1.65%) JUnit
4 8 (1.65%) Mockito
5 5 (1.03%) Jasmine
5 5 (1.03%) Karma Test Runner
6 3 (0.62%) GitLab
7 2 (0.41%) Mocha
8 1 (0.21%) Android Studio
8 1 (0.21%) Artifactory
8 1 (0.21%) Bitbucket
8 1 (0.21%) Sonatype Nexus
8 1 (0.21%) Subversion
8 1 (0.21%) Visual Studio Code
General
1 309 (63.71%) Social Skills
2 199 (41.03%) Finance
3 151 (31.13%) Analytical Skills
4 145 (29.90%) Marketing
5 88 (18.14%) Public Sector
6 55 (11.34%) Inclusion and Diversity
7 49 (10.10%) Advertising
8 37 (7.63%) Organisational Skills
9 25 (5.15%) Banking
10 20 (4.12%) Legal
11 19 (3.92%) Manufacturing
11 19 (3.92%) Telecoms
12 18 (3.71%) Presentation Skills
13 17 (3.51%) Electronics
14 15 (3.09%) Law
15 13 (2.68%) Publishing
16 11 (2.27%) Billing
17 10 (2.06%) Games
18 9 (1.86%) Influencing Skills
19 8 (1.65%) Retail
Job Titles
1 90 (18.56%) Developer
2 72 (14.85%) Senior
3 61 (12.58%) Business Manager
4 60 (12.37%) Business Development Manager
4 60 (12.37%) Development Manager
5 33 (6.80%) Account Manager
6 32 (6.60%) Lead
7 31 (6.39%) Analyst
7 31 (6.39%) Senior Manager
8 26 (5.36%) Consultant
8 26 (5.36%) IT Manager
9 25 (5.15%) Front-End Developer (Client-Side Developer)
10 21 (4.33%) Operations Manager
11 20 (4.12%) Functional Consultant
11 20 (4.12%) IT Support
11 20 (4.12%) NetSuite Consultant
12 19 (3.92%) Senior Account Manager
12 19 (3.92%) Software Developer
13 15 (3.09%) IT Support Manager
13 15 (3.09%) Support Manager
Libraries, Frameworks & Software Standards
1 52 (10.72%) HTML
2 44 (9.07%) CSS
3 36 (7.42%) .NET
4 32 (6.60%) React
5 28 (5.77%) AngularJS
6 21 (4.33%) Node.js
7 19 (3.92%) Pandas
8 16 (3.30%) HTML5
9 15 (3.09%) REST
10 13 (2.68%) Spring
10 13 (2.68%) Spring Boot
10 13 (2.68%) Web Services
11 11 (2.27%) Django
11 11 (2.27%) RESTful
12 9 (1.86%) .NET Core
12 9 (1.86%) FastAPI
12 9 (1.86%) Middleware
13 8 (1.65%) ActiveMQ
13 8 (1.65%) Hibernate
13 8 (1.65%) WireMock
Miscellaneous
1 33 (6.80%) Digital Media
1 33 (6.80%) Marketing Technology
2 27 (5.57%) Management Information System
3 21 (4.33%) Product Ownership
4 19 (3.92%) Social Media
5 16 (3.30%) Analytical Mindset
5 16 (3.30%) Self-Motivation
6 15 (3.09%) Mobile App
7 14 (2.89%) Cyberattack
7 14 (2.89%) Onboarding
8 11 (2.27%) Virtual Team
9 10 (2.06%) Distributed Systems
10 7 (1.44%) Data Centre
10 7 (1.44%) Team-Oriented Environment
11 6 (1.24%) Blog
11 6 (1.24%) Mobile Games
12 5 (1.03%) Animation
13 4 (0.82%) Cyber Defence
13 4 (0.82%) Foreign Exchange (FX)
14 3 (0.62%) FMCG
Operating Systems
1 37 (7.63%) Windows
2 29 (5.98%) Linux
3 23 (4.74%) Android
4 20 (4.12%) Windows Server
5 16 (3.30%) Windows Server 2016
6 14 (2.89%) Windows Server 2012
7 12 (2.47%) Apple iOS
7 12 (2.47%) Windows Server 2019
8 7 (1.44%) Unix
9 5 (1.03%) Red Hat Enterprise Linux
10 2 (0.41%) Windows Server 2008
10 2 (0.41%) Windows Vista
11 1 (0.21%) Amazon Linux
11 1 (0.21%) Debian
11 1 (0.21%) zOS
Processes & Methodologies
1 140 (28.87%) Problem-Solving
2 127 (26.19%) Project Management
3 100 (20.62%) Agile
4 85 (17.53%) Marketing Strategy
5 80 (16.49%) Collaborative Culture
6 73 (15.05%) Continuous Improvement
6 73 (15.05%) Digital Marketing
7 64 (13.20%) Facilities Management
8 62 (12.78%) Business Development
9 59 (12.16%) Process Improvement
10 54 (11.13%) Artificial Intelligence
10 54 (11.13%) CI/CD
10 54 (11.13%) DevOps
11 47 (9.69%) ITIL
12 46 (9.48%) Analytics
13 45 (9.28%) Business Intelligence
14 42 (8.66%) Mentoring
14 42 (8.66%) Strategic Thinking
15 38 (7.84%) Incident Management
15 38 (7.84%) Project Delivery
Programming Languages
1 72 (14.85%) Python
2 70 (14.43%) SQL
3 65 (13.40%) JavaScript
4 41 (8.45%) Java
5 32 (6.60%) PowerShell
6 26 (5.36%) C#
7 21 (4.33%) TypeScript
8 18 (3.71%) Go
9 16 (3.30%) C++
10 12 (2.47%) Rust
10 12 (2.47%) Shell Script
11 7 (1.44%) R
11 7 (1.44%) T-SQL
12 5 (1.03%) PL/SQL
13 4 (0.82%) Bash
13 4 (0.82%) Swift
14 2 (0.41%) ABAP
14 2 (0.41%) Apex Code
14 2 (0.41%) SOQL
14 2 (0.41%) VBA
Qualifications
1 83 (17.11%) Degree
2 37 (7.63%) Security Cleared
3 23 (4.74%) CISSP
4 21 (4.33%) DV Cleared
4 21 (4.33%) PMP
5 20 (4.12%) PMI Certification
6 18 (3.71%) Azure Certification
7 17 (3.51%) SC Cleared
8 14 (2.89%) Microsoft Certification
9 11 (2.27%) Computer Science Degree
10 9 (1.86%) Cisco Certification
10 9 (1.86%) MCSE
10 9 (1.86%) VMware Certified Professional (VCP)
11 8 (1.65%) DBS Check
12 6 (1.24%) Six Sigma Black Belt
13 5 (1.03%) AWS Certification
13 5 (1.03%) CISM
13 5 (1.03%) Master's Degree
14 4 (0.82%) (ISC)2 CCSP
14 4 (0.82%) CIMA
Quality Assurance & Compliance
1 41 (8.45%) Accessibility
2 34 (7.01%) QA
3 22 (4.54%) GDPR
4 19 (3.92%) Cyber Essentials
4 19 (3.92%) Cyber Essentials PLUS
5 16 (3.30%) SLA
6 12 (2.47%) ISO/IEC 27001
7 10 (2.06%) NIST
8 8 (1.65%) Data Quality
9 7 (1.44%) GRC
10 6 (1.24%) WCAG
11 2 (0.41%) COBIT
11 2 (0.41%) ISO 9001
11 2 (0.41%) PCI DSS
11 2 (0.41%) PMO
12 1 (0.21%) IFRS
12 1 (0.21%) ISAE 3402
System Software
1 44 (9.07%) Docker
2 27 (5.57%) Active Directory
3 18 (3.71%) VMware Infrastructure
4 11 (2.27%) Hyper-V
5 2 (0.41%) Postfix
6 1 (0.21%) HDFS
6 1 (0.21%) Job Entry Subsystem
6 1 (0.21%) Time Sharing Option
6 1 (0.21%) Virtual Machines
6 1 (0.21%) VMware ESXi
6 1 (0.21%) vSphere
Systems Management
1 43 (8.87%) Kubernetes
2 21 (4.33%) Terraform
3 19 (3.92%) Ansible
4 16 (3.30%) Microsoft Intune
5 11 (2.27%) NetBackup
5 11 (2.27%) SCCM
5 11 (2.27%) SCOM
6 10 (2.06%) Kibana
7 5 (1.03%) Active Directory Federation Services
7 5 (1.03%) Grafana
7 5 (1.03%) Single Sign-On
8 4 (0.82%) Nagios
8 4 (0.82%) Progress Chef
9 3 (0.62%) Prometheus
9 3 (0.62%) Puppet
10 2 (0.41%) FortiGate
10 2 (0.41%) Proxmox
10 2 (0.41%) ZABBIX
11 1 (0.21%) Oracle RMAN
11 1 (0.21%) Plesk
Vendors
1 67 (13.81%) Microsoft
2 31 (6.39%) SAP
3 22 (4.54%) VMware
4 21 (4.33%) Google
5 17 (3.51%) Oracle
5 17 (3.51%) ServiceNow
6 16 (3.30%) Salesforce
7 14 (2.89%) Splunk
8 12 (2.47%) Dynatrace
9 11 (2.27%) Adobe
9 11 (2.27%) SolarWinds
9 11 (2.27%) Veeam
10 10 (2.06%) HubSpot
11 7 (1.44%) Aderant
12 5 (1.03%) Cisco
12 5 (1.03%) Okta
13 4 (0.82%) Apple
13 4 (0.82%) Commvault
13 4 (0.82%) Fortinet
13 4 (0.82%) Guidewire