Virtual Team Jobs in London

Virtual Team (including Distributed Team, Remote Team, Dispersed Team)
England > London

The table below looks at the prevalence of the term Virtual Team in permanent job vacancies in London. Included is a benchmarking guide to the salaries offered in vacancies that cited Virtual Team over the 6 months leading up to 26 July 2024, comparing them to the same period in the previous two years.

6 months to
26 Jul 2024
Same period 2023 Same period 2022
Rank 338 272 229
Rank change year-on-year -66 -43 -8
Permanent jobs citing Virtual Team 139 343 1,450
As % of all permanent jobs advertised in London 0.67% 1.26% 1.93%
As % of the Miscellaneous category 1.63% 2.92% 3.77%
Number of salaries quoted 64 177 539
10th Percentile £49,750 £55,000 £50,000
25th Percentile £62,500 £60,800 £57,500
Median annual salary (50th Percentile) £83,750 £82,500 £70,000
Median % change year-on-year +1.52% +17.86% -6.67%
75th Percentile £119,063 £101,185 £92,500
90th Percentile £150,000 £130,000 £110,000
England median annual salary £60,000 £60,800 £70,000
% change year-on-year -1.32% -13.14% +7.69%

All Generic Skills
London

Virtual Team falls under the General and Transferable Skills category. For comparison with the information above, the following table provides summary statistics for all permanent job vacancies requiring generic IT skills in London.

Permanent vacancies with a requirement for generic IT skills 8,507 11,733 38,507
As % of all permanent jobs advertised in London 41.02% 43.26% 51.33%
Number of salaries quoted 5,645 9,002 16,218
10th Percentile £40,000 £43,171 £43,750
25th Percentile £52,500 £56,219 £55,000
Median annual salary (50th Percentile) £77,500 £75,000 £75,000
Median % change year-on-year +3.33% - +3.45%
75th Percentile £105,000 £100,000 £95,938
90th Percentile £136,250 £125,000 £120,000
England median annual salary £56,124 £65,000 £62,500
% change year-on-year -13.66% +4.00% +4.17%

Virtual Team
Job Vacancy Trend in London

Job postings citing Virtual Team as a proportion of all IT jobs advertised in London.
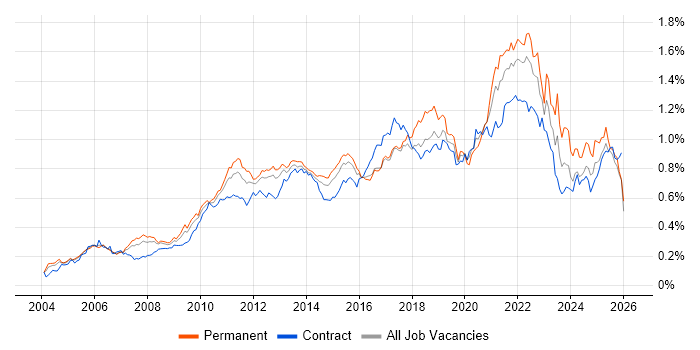
Job vacancy trend for Virtual Team in London

Virtual Team
Salary Trend in London

3-month moving average salary quoted in jobs citing Virtual Team in London.

Salary trend for Virtual Team in London

Virtual Team
Salary Histogram in London

Salary distribution for jobs citing Virtual Team in London over the 6 months to 26 July 2024.

Salary histogram for Virtual Team in London

Virtual Team
Job Locations in London

The table below looks at the demand and provides a guide to the median salaries quoted in IT jobs citing Virtual Team within the London region over the 6 months to 26 July 2024. The 'Rank Change' column provides an indication of the change in demand within each location based on the same 6 month period last year.

Location Rank Change
on Same Period
Last Year
Matching
Permanent
IT Job Ads
Median Salary
Past 6 Months
Median Salary
% Change
on Same Period
Last Year
Live
Jobs
Central London +15 9 £65,000 -23.53% 7
East London +25 6 £110,000 +33.33% 1
South London -14 4 £57,500 -5.43% 1
West London -12 2 £55,300 -9.05%
Virtual Team
England

Virtual Team
Co-occurring Skills and Capabilities in London by Category

The follow tables expand on the table above by listing co-occurrences grouped by category. The same employment type, locality and period is covered with up to 20 co-occurrences shown in each of the following categories:

Application Platforms
1 5 (3.60%) Confluence
2 3 (2.16%) Microsoft Exchange
3 2 (1.44%) Apache
3 2 (1.44%) Apache Airflow
3 2 (1.44%) Apache Spark
3 2 (1.44%) Ethereum
3 2 (1.44%) SharePoint
3 2 (1.44%) Tomcat
4 1 (0.72%) Adobe Experience Manager
4 1 (0.72%) Apache Pulsar
4 1 (0.72%) Drupal
4 1 (0.72%) OpenStack
4 1 (0.72%) Oracle SOA Suite
Applications
1 9 (6.47%) Microsoft Office
2 2 (1.44%) Microsoft Excel
2 2 (1.44%) Microsoft PowerPoint
2 2 (1.44%) MS Visio
3 1 (0.72%) CPLEX
3 1 (0.72%) Notion
Business Applications
1 1 (0.72%) Endur
1 1 (0.72%) OpenLink RightAngle
Cloud Services
1 15 (10.79%) AWS
2 11 (7.91%) Azure
3 9 (6.47%) Power Platform
4 8 (5.76%) Microsoft 365
5 7 (5.04%) Firebase
6 4 (2.88%) GCP
7 3 (2.16%) GitHub
7 3 (2.16%) SaaS
8 2 (1.44%) OpenShift
8 2 (1.44%) Serverless
9 1 (0.72%) Amazon ECS
9 1 (0.72%) Amazon EKS
9 1 (0.72%) AWS Lambda
9 1 (0.72%) Azure DevOps
9 1 (0.72%) Azure Logic Apps
9 1 (0.72%) GitHub Actions
9 1 (0.72%) npm
9 1 (0.72%) Slack
9 1 (0.72%) Stripe
9 1 (0.72%) Yarn
Communications & Networking
1 3 (2.16%) DHCP
1 3 (2.16%) DNS
1 3 (2.16%) Firewall
2 2 (1.44%) Network Security
3 1 (0.72%) Cisco IOS
3 1 (0.72%) LAN
3 1 (0.72%) NAS
3 1 (0.72%) SAN
3 1 (0.72%) SD-WAN
3 1 (0.72%) VPN
3 1 (0.72%) WAN
3 1 (0.72%) Wi-Fi
Database & Business Intelligence
1 9 (6.47%) Power BI
2 7 (5.04%) SQL Server
3 5 (3.60%) Relational Database
4 4 (2.88%) Data Warehouse
4 4 (2.88%) NoSQL
4 4 (2.88%) PostgreSQL
4 4 (2.88%) Tableau
5 3 (2.16%) Metadata
5 3 (2.16%) RDBMS
6 2 (1.44%) Azure SQL Data Warehouse
6 2 (1.44%) Azure SQL Database
6 2 (1.44%) Big Data
6 2 (1.44%) Data Lake
6 2 (1.44%) Hadoop
6 2 (1.44%) Metadata Repository
6 2 (1.44%) MySQL
7 1 (0.72%) Amazon RDS
7 1 (0.72%) Elasticsearch
7 1 (0.72%) KDB
7 1 (0.72%) MongoDB
Development Applications
1 9 (6.47%) Maven
2 8 (5.76%) Git
3 6 (4.32%) Crashlytics
3 6 (4.32%) Jenkins
4 4 (2.88%) JIRA
5 2 (1.44%) Ant
5 2 (1.44%) Artifactory
5 2 (1.44%) CircleCI
5 2 (1.44%) Hardhat
5 2 (1.44%) MLflow
5 2 (1.44%) NUnit
5 2 (1.44%) Team Foundation Server
6 1 (0.72%) Eclipse
6 1 (0.72%) IntelliJ
6 1 (0.72%) Mercurial
6 1 (0.72%) Selenium
6 1 (0.72%) SonarQube
6 1 (0.72%) SpecFlow
6 1 (0.72%) Visual Studio Code
6 1 (0.72%) Xcode
General
1 63 (45.32%) Social Skills
2 54 (38.85%) Finance
3 37 (26.62%) Inclusion and Diversity
4 26 (18.71%) Presentation Skills
5 25 (17.99%) Analytical Skills
6 24 (17.27%) Retail
7 16 (11.51%) Banking
8 11 (7.91%) Marketing
9 10 (7.19%) Law
10 7 (5.04%) Manufacturing
11 6 (4.32%) Influencing Skills
11 6 (4.32%) Legal
12 5 (3.60%) Documentation Skills
12 5 (3.60%) Games
13 4 (2.88%) Financial Institution
13 4 (2.88%) Investment Banking
14 2 (1.44%) Aviation
14 2 (1.44%) Public Sector
15 1 (0.72%) Agriculture
15 1 (0.72%) Tech for Good
Job Titles
1 41 (29.50%) Senior
2 29 (20.86%) Lead
3 26 (18.71%) Architect
4 23 (16.55%) Salesforce Architect
4 23 (16.55%) Senior Architect
4 23 (16.55%) Senior Salesforce Architect
5 20 (14.39%) Senior Manager
6 19 (13.67%) Salesforce Technical Architect
6 19 (13.67%) Senior Technical Architect
6 19 (13.67%) Senior Technical Manager
6 19 (13.67%) Technical Architect
6 19 (13.67%) Technical Manager
7 16 (11.51%) Developer
8 14 (10.07%) Software Engineer
9 12 (8.63%) Service Manager
10 10 (7.19%) Senior Service Manager
10 10 (7.19%) Technical Services Manager
11 9 (6.47%) Full Stack Engineer
12 7 (5.04%) Analyst
12 7 (5.04%) Product Lead
Libraries, Frameworks & Software Standards
1 17 (12.23%) React
2 14 (10.07%) CSS
3 12 (8.63%) AngularJS
3 12 (8.63%) HTML
3 12 (8.63%) Spring
3 12 (8.63%) Spring Boot
4 9 (6.47%) React Native
4 9 (6.47%) REST
5 7 (5.04%) Node.js
6 6 (4.32%) Middleware
6 6 (4.32%) Redux
7 4 (2.88%) .NET
7 4 (2.88%) DirectX
7 4 (2.88%) Kafka
7 4 (2.88%) OpenGL
7 4 (2.88%) Qt
8 3 (2.16%) Django
8 3 (2.16%) Hibernate
8 3 (2.16%) XML
9 2 (1.44%) RESTful
Miscellaneous
1 37 (26.62%) Data Structures
2 17 (12.23%) Algorithms
3 13 (9.35%) Mobile App
4 12 (8.63%) IoT
4 12 (8.63%) Self-Motivation
5 11 (7.91%) Management Information System
5 11 (7.91%) Onboarding
6 8 (5.76%) Distributed Systems
7 6 (4.32%) Cloud Native
7 6 (4.32%) Product Ownership
8 5 (3.60%) CMDB
9 4 (2.88%) 3D Graphics
9 4 (2.88%) Client/Server
9 4 (2.88%) Foreign Exchange (FX)
9 4 (2.88%) Ray Tracing
10 3 (2.16%) CSOC
11 2 (1.44%) Blockchain
11 2 (1.44%) Educational Technology
11 2 (1.44%) Renewable Energy
11 2 (1.44%) Web3
Operating Systems
1 14 (10.07%) Apple iOS
2 11 (7.91%) Android
2 11 (7.91%) Windows
3 9 (6.47%) Linux
4 4 (2.88%) Windows Server
5 3 (2.16%) Unix
6 2 (1.44%) Windows 10
7 1 (0.72%) Solaris
Processes & Methodologies
1 70 (50.36%) Agile
2 62 (44.60%) Problem-Solving
3 41 (29.50%) Mentoring
4 34 (24.46%) Data Science
5 33 (23.74%) Stakeholder Management
6 32 (23.02%) Business Strategy
7 30 (21.58%) Customer Experience
8 27 (19.42%) Computer Science
8 27 (19.42%) Virtual Team Management
9 22 (15.83%) Data Management
10 21 (15.11%) Microservices
11 20 (14.39%) Full Stack Development
11 20 (14.39%) Software Engineering
12 19 (13.67%) Analytics
13 18 (12.95%) Continuous Improvement
14 17 (12.23%) Change Management
15 16 (11.51%) CI/CD
15 16 (11.51%) Visualisation
16 15 (10.79%) DevOps
16 15 (10.79%) Use Case
Programming Languages
1 21 (15.11%) Python
2 20 (14.39%) Java
2 20 (14.39%) JavaScript
3 17 (12.23%) Kotlin
4 13 (9.35%) SQL
5 12 (8.63%) TypeScript
6 9 (6.47%) Swift
7 7 (5.04%) C#
8 6 (4.32%) C++
9 5 (3.60%) C
10 4 (2.88%) Go
11 3 (2.16%) PHP
11 3 (2.16%) PowerShell
11 3 (2.16%) Rust
11 3 (2.16%) Scala
12 2 (1.44%) Bash
12 2 (1.44%) Objective-C
12 2 (1.44%) PL/SQL
12 2 (1.44%) R
12 2 (1.44%) Shell Script
Qualifications
1 57 (41.01%) Degree
2 13 (9.35%) Master's Degree
3 12 (8.63%) Security Cleared
4 11 (7.91%) SC Cleared
5 9 (6.47%) Computer Science Degree
6 3 (2.16%) AWS Certification
6 3 (2.16%) AWS Certified Solutions Architect
6 3 (2.16%) CISSP
7 2 (1.44%) CISA
7 2 (1.44%) CRISC
7 2 (1.44%) ISTQB
7 2 (1.44%) PMI Certification
8 1 (0.72%) CEH
8 1 (0.72%) CISMP
8 1 (0.72%) DV Cleared
8 1 (0.72%) GIAC
8 1 (0.72%) GPEN
8 1 (0.72%) Network+ Certification
8 1 (0.72%) OSCP
8 1 (0.72%) PMP
Quality Assurance & Compliance
1 12 (8.63%) QA
2 5 (3.60%) Accessibility
3 4 (2.88%) Data Quality
4 2 (1.44%) GDPR
4 2 (1.44%) NIST
5 1 (0.72%) ISO/IEC 27001
5 1 (0.72%) Software Quality Assurance
5 1 (0.72%) UCITS
System Software
1 5 (3.60%) Active Directory
2 4 (2.88%) Docker
3 1 (0.72%) Firmware
3 1 (0.72%) VMware Infrastructure
Systems Management
1 8 (5.76%) Kubernetes
2 4 (2.88%) Ansible
2 4 (2.88%) Terraform
3 1 (0.72%) Grafana
3 1 (0.72%) Hadoop YARN
3 1 (0.72%) Jamf Pro
3 1 (0.72%) Microsoft Intune
3 1 (0.72%) QRadar
3 1 (0.72%) SCCM
Vendors
1 24 (17.27%) Salesforce
2 16 (11.51%) Microsoft
3 8 (5.76%) ION Trading
4 7 (5.04%) Oracle
5 6 (4.32%) Amplitude
6 5 (3.60%) Alteryx
7 4 (2.88%) Google
8 2 (1.44%) Apple
8 2 (1.44%) Foundry
8 2 (1.44%) IBM
8 2 (1.44%) StreamSets
8 2 (1.44%) Sybase
8 2 (1.44%) VMware
9 1 (0.72%) Adobe
9 1 (0.72%) Capita
9 1 (0.72%) Cisco
9 1 (0.72%) Citrix
9 1 (0.72%) Commvault
9 1 (0.72%) Dell
9 1 (0.72%) Logitech