Requirements Gathering Jobs in London

Requirements Gathering (Requirements Elicitation)
England > London

The following table provides summary statistics for permanent job vacancies advertised in London with a requirement for Requirements Gathering skills. Included is a benchmarking guide to the salaries offered in vacancies that have cited Requirements Gathering over the 6 months to 23 April 2024 with a comparison to the same period in the previous 2 years.

6 months to
23 Apr 2024
Same period 2023 Same period 2022
Rank 164 164 200
Rank change year-on-year 0 +36 -36
Permanent jobs citing Requirements Gathering 461 816 1,373
As % of all permanent jobs advertised in London 1.96% 2.25% 2.11%
As % of the Processes & Methodologies category 2.15% 2.36% 2.18%
Number of salaries quoted 364 626 847
10th Percentile £45,210 £46,250 £45,000
25th Percentile £53,750 £52,500 £52,500
Median annual salary (50th Percentile) £70,000 £65,000 £65,000
Median % change year-on-year +7.69% - +8.33%
75th Percentile £85,000 £80,000 £81,250
90th Percentile £100,000 £95,000 £100,000
England median annual salary £55,000 £60,000 £55,140
% change year-on-year -8.33% +8.81% +0.25%

All Process and Methodology Skills
London

Requirements Gathering is in the Processes and Methodologies category. The following table is for comparison with the above and provides summary statistics for all permanent job vacancies advertised in London with a requirement for process or methodology skills.

Permanent vacancies with a requirement for process or methodology skills 21,491 34,573 63,094
As % of all permanent jobs advertised in London 91.51% 95.42% 96.81%
Number of salaries quoted 16,060 24,674 34,404
10th Percentile £38,000 £43,750 £42,500
25th Percentile £52,500 £55,000 £53,750
Median annual salary (50th Percentile) £71,233 £75,000 £70,000
Median % change year-on-year -5.02% +7.14% -
75th Percentile £95,000 £95,000 £92,500
90th Percentile £115,000 £115,000 £111,250
England median annual salary £55,000 £62,500 £60,000
% change year-on-year -12.00% +4.17% +9.09%

Requirements Gathering
Job Vacancy Trend in London

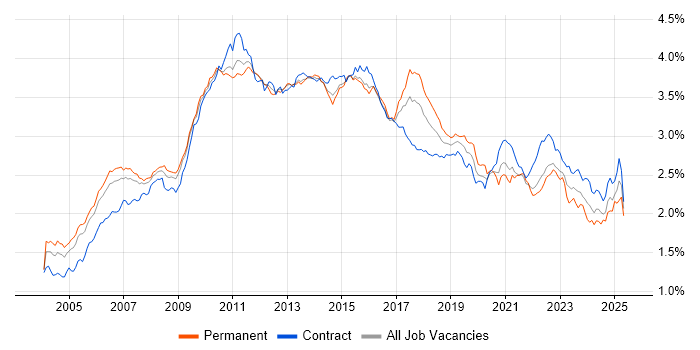
Job postings citing Requirements Gathering as a proportion of all IT jobs advertised in London.

Job vacancy trend for Requirements Gathering in London

Requirements Gathering
Salary Trend in London

3-month moving average salary quoted in jobs citing Requirements Gathering in London.

Salary trend for Requirements Gathering in London

Requirements Gathering
Salary Histogram in London

Salary distribution for jobs citing Requirements Gathering in London over the 6 months to 23 April 2024.

Salary histogram for Requirements Gathering in London

Requirements Gathering
Job Locations in London

The table below looks at the demand and provides a guide to the median salaries quoted in IT jobs citing Requirements Gathering within the London region over the 6 months to 23 April 2024. The 'Rank Change' column provides an indication of the change in demand within each location based on the same 6 month period last year.

Location Rank Change
on Same Period
Last Year
Matching
Permanent
IT Job Ads
Median Salary
Past 6 Months
Median Salary
% Change
on Same Period
Last Year
Live
Jobs
Central London +11 79 £55,000 -26.67% 13
South London -3 13 £75,000 +25.00%
West London -6 12 £88,750 +60.16% 3
East London +21 4 £90,000 +50.00% 9
North London -1 2 £54,950 -
Requirements Gathering
England

Requirements Gathering
Co-occurring Skills and Capabilities in London by Category

The follow tables expand on the table above by listing co-occurrences grouped by category. The same employment type, locality and period is covered with up to 20 co-occurrences shown in each of the following categories:

Application Platforms
1 13 (2.82%) SharePoint
2 11 (2.39%) Apache
2 11 (2.39%) Apache Spark
3 7 (1.52%) CMS
3 7 (1.52%) SAS
4 5 (1.08%) Confluence
4 5 (1.08%) IIS
4 5 (1.08%) JBoss
4 5 (1.08%) Tomcat
4 5 (1.08%) WebLogic
4 5 (1.08%) WebSphere
4 5 (1.08%) WildFly
5 3 (0.65%) Microsoft Exchange
6 2 (0.43%) Drupal
6 2 (0.43%) Magnolia
7 1 (0.22%) Documentum
7 1 (0.22%) SharePoint 2013
Applications
1 20 (4.34%) Microsoft Excel
2 13 (2.82%) Microsoft Office
3 9 (1.95%) MS Visio
4 3 (0.65%) Microsoft PowerPoint
4 3 (0.65%) Microsoft Project
4 3 (0.65%) Photoshop
Business Applications
1 16 (3.47%) Dynamics CRM
2 12 (2.60%) SAP S/4HANA
3 6 (1.30%) NetSuite
4 5 (1.08%) Distributed Ledger
4 5 (1.08%) Teamcenter
5 4 (0.87%) Oracle Payroll
6 3 (0.65%) Fidessa
6 3 (0.65%) NEC Housing
6 3 (0.65%) Oracle ERP
6 3 (0.65%) SAP MDG
6 3 (0.65%) Workday HCM
7 2 (0.43%) SAP CO
7 2 (0.43%) SAP ERP
7 2 (0.43%) SAP FI
7 2 (0.43%) SAP FI/CO
8 1 (0.22%) Epicor Tropos
8 1 (0.22%) SAP HCM
8 1 (0.22%) SAP MM
8 1 (0.22%) SAP Travel Management
8 1 (0.22%) Shopify
Cloud Services
1 68 (14.75%) Azure
2 67 (14.53%) Power Platform
3 25 (5.42%) AWS
4 24 (5.21%) SaaS
5 17 (3.69%) Azure Data Factory
6 16 (3.47%) Amazon S3
6 16 (3.47%) PowerApps
7 14 (3.04%) Dynamics 365
7 14 (3.04%) GitHub
8 13 (2.82%) Microsoft 365
8 13 (2.82%) OCI
9 12 (2.60%) Azure Synapse Analytics
10 9 (1.95%) Azure DevOps
11 8 (1.74%) Cloud Computing
12 7 (1.52%) Amazon EC2
13 4 (0.87%) Asana
13 4 (0.87%) Miro
13 4 (0.87%) Power Automate
14 3 (0.65%) Canva
14 3 (0.65%) WhatsApp
Communications & Networking
1 3 (0.65%) DNS
2 2 (0.43%) SAN
2 2 (0.43%) SSH
3 1 (0.22%) DHCP
3 1 (0.22%) Firewall
3 1 (0.22%) HTTP
3 1 (0.22%) NAS
Database & Business Intelligence
1 61 (13.23%) SQL Server
2 55 (11.93%) Power BI
3 48 (10.41%) Data Warehouse
4 23 (4.99%) Tableau
5 20 (4.34%) SQL Server Integration Services
6 16 (3.47%) Metadata
7 12 (2.60%) Amazon QuickSight
7 12 (2.60%) Oracle Reports
7 12 (2.60%) SQL Server Reporting Services
8 11 (2.39%) Amazon Redshift
9 10 (2.17%) Data Lake
10 8 (1.74%) Ataccama
10 8 (1.74%) NoSQL
10 8 (1.74%) SAP HANA
11 7 (1.52%) BusinessObjects
11 7 (1.52%) BusinessObjects Web Intelligence
11 7 (1.52%) Data Mining
11 7 (1.52%) DB2
11 7 (1.52%) DynamoDB
11 7 (1.52%) Semantic Layer
Development Applications
1 24 (5.21%) JIRA
2 14 (3.04%) SQL Server Management Studio (SSMS)
3 11 (2.39%) Git
4 10 (2.17%) Visual Studio
5 9 (1.95%) GitLab
6 6 (1.30%) JMeter
6 6 (1.30%) LoadRunner
7 5 (1.08%) Gatling
8 4 (0.87%) Team Foundation Server
9 2 (0.43%) Cucumber
9 2 (0.43%) JUnit
9 2 (0.43%) Visual Studio Code
10 1 (0.22%) Jenkins
10 1 (0.22%) NUnit
10 1 (0.22%) Octopus Deploy
10 1 (0.22%) Postman
10 1 (0.22%) TeamCity
General
1 161 (34.92%) Social Skills
2 139 (30.15%) Finance
3 124 (26.90%) Analytical Skills
4 38 (8.24%) Banking
5 33 (7.16%) Retail
6 26 (5.64%) Presentation Skills
7 25 (5.42%) Public Sector
8 22 (4.77%) Inclusion and Diversity
9 18 (3.90%) Legal
9 18 (3.90%) Local Government
10 16 (3.47%) Front Office
11 15 (3.25%) Law
12 14 (3.04%) Marketing
13 13 (2.82%) Back Office
14 12 (2.60%) Influencing Skills
15 9 (1.95%) Investment Banking
16 8 (1.74%) Pharmaceutical
17 5 (1.08%) Billing
17 5 (1.08%) General Ledger
17 5 (1.08%) Manufacturing
Job Titles
1 156 (33.84%) Analyst
2 97 (21.04%) Senior
3 83 (18.00%) Business Analyst
4 68 (14.75%) Consultant
5 54 (11.71%) Developer
6 42 (9.11%) Senior Analyst
7 31 (6.72%) Data Analyst
8 30 (6.51%) Lead
9 29 (6.29%) Architect
10 27 (5.86%) Senior Consultant
11 25 (5.42%) Product Owner
11 25 (5.42%) Senior Business Analyst
12 24 (5.21%) Technical Consultant
13 19 (4.12%) Business Intelligence Developer
13 19 (4.12%) Senior Technical Consultant
14 18 (3.90%) Project Manager
15 17 (3.69%) Senior ServiceNow Consultant
15 17 (3.69%) ServiceNow Consultant
16 16 (3.47%) Technical Analyst
17 13 (2.82%) Java Developer
Libraries, Frameworks & Software Standards
1 32 (6.94%) HTML
2 27 (5.86%) AngularJS
3 19 (4.12%) .NET
4 13 (2.82%) Web Services
5 10 (2.17%) Spring
6 9 (1.95%) Hibernate
6 9 (1.95%) REST
7 7 (1.52%) Angular 2
7 7 (1.52%) CSS
7 7 (1.52%) HTML5
7 7 (1.52%) Spring Boot
7 7 (1.52%) Twitter Bootstrap
8 6 (1.30%) PySpark
9 5 (1.08%) ASP.NET
9 5 (1.08%) JSON
9 5 (1.08%) Smart Contracts
9 5 (1.08%) XML
10 4 (0.87%) .NET Framework
10 4 (0.87%) RESTful
10 4 (0.87%) Restlet
Miscellaneous
1 43 (9.33%) Product Ownership
2 23 (4.99%) Self-Motivation
3 22 (4.77%) Onboarding
4 17 (3.69%) Greenfield Project
5 12 (2.60%) Foreign Exchange (FX)
5 12 (2.60%) Management Information System
6 9 (1.95%) Fixed Income
7 8 (1.74%) Legacy Systems
7 8 (1.74%) Reference Data
7 8 (1.74%) Social Media
8 7 (1.52%) Algorithms
8 7 (1.52%) Blockchain
8 7 (1.52%) Data Structures
8 7 (1.52%) Reinsurance
9 5 (1.08%) Derivative
9 5 (1.08%) Enterprise Software
9 5 (1.08%) Low-Code
10 4 (0.87%) Data Centre
10 4 (0.87%) Housing Association
11 3 (0.65%) Virtual Team
Operating Systems
1 16 (3.47%) Windows
2 10 (2.17%) Linux
3 3 (0.65%) Unix
4 2 (0.43%) Windows Server
5 1 (0.22%) VMS
5 1 (0.22%) Windows 10
5 1 (0.22%) Windows Server 2012
Processes & Methodologies
1 135 (29.28%) Problem-Solving
2 93 (20.17%) Agile
3 82 (17.79%) Analytics
4 77 (16.70%) Business Intelligence
5 64 (13.88%) Roadmaps
6 61 (13.23%) Business Analysis
7 60 (13.02%) Project Management
8 59 (12.80%) Data Modelling
8 59 (12.80%) ETL
9 56 (12.15%) Data Analysis
10 54 (11.71%) Stakeholder Management
10 54 (11.71%) Visualisation
11 53 (11.50%) Workshop Facilitation
12 46 (9.98%) Computer Science
12 46 (9.98%) User Acceptance Testing
13 43 (9.33%) Data Visualisation
13 43 (9.33%) User Stories
14 42 (9.11%) Project Delivery
15 41 (8.89%) Data Management
15 41 (8.89%) Migration
Programming Languages
1 123 (26.68%) SQL
2 62 (13.45%) Python
3 30 (6.51%) Java
3 30 (6.51%) JavaScript
4 18 (3.90%) Data Analysis Expressions
5 16 (3.47%) C#
6 15 (3.25%) PL/SQL
7 13 (2.82%) T-SQL
8 9 (1.95%) R
9 8 (1.74%) TypeScript
10 7 (1.52%) C++
10 7 (1.52%) MATLAB
10 7 (1.52%) PowerShell
11 4 (0.87%) VB
12 2 (0.43%) BeanShell
12 2 (0.43%) C
12 2 (0.43%) Perl
12 2 (0.43%) Ruby
12 2 (0.43%) VBA
12 2 (0.43%) XPath
Qualifications
1 90 (19.52%) Degree
2 27 (5.86%) Security Cleared
3 26 (5.64%) Master's Degree
4 22 (4.77%) Computer Science Degree
4 22 (4.77%) SC Cleared
5 10 (2.17%) PMI Certification
6 9 (1.95%) Microsoft Certification
7 8 (1.74%) CISM
7 8 (1.74%) CISSP
7 8 (1.74%) PMP
8 7 (1.52%) BPSS Clearance
9 6 (1.30%) DBS Check
10 4 (0.87%) Azure Certification
10 4 (0.87%) Oracle Certification
11 3 (0.65%) MBA
12 1 (0.22%) ACCA
12 1 (0.22%) CIMA
12 1 (0.22%) ITIL Foundation Certificate
12 1 (0.22%) PhD
12 1 (0.22%) VMware Certified Professional (VCP)
Quality Assurance & Compliance
1 36 (7.81%) QA
2 33 (7.16%) Data Quality
3 8 (1.74%) GDPR
4 6 (1.30%) ISO 9001
4 6 (1.30%) ISO/IEC 27001
5 5 (1.08%) Accessibility
6 4 (0.87%) PMO
6 4 (0.87%) Solvency II
7 1 (0.22%) Actionable Recommendations
7 1 (0.22%) Sarbanes-Oxley
System Software
1 10 (2.17%) Docker
2 5 (1.08%) Active Directory
3 2 (0.43%) Hyper-V
3 2 (0.43%) VMware Infrastructure
3 2 (0.43%) vSphere
4 1 (0.22%) vCloud
4 1 (0.22%) Virtual Machines
Systems Management
1 10 (2.17%) Kubernetes
2 3 (0.65%) Terraform
3 2 (0.43%) Ansible
3 2 (0.43%) Puppet
4 1 (0.22%) HP SiteScope
4 1 (0.22%) Microsoft Intune
4 1 (0.22%) Nagios
4 1 (0.22%) Perfmon
4 1 (0.22%) ZABBIX
Vendors
1 85 (18.44%) Microsoft
2 49 (10.63%) Oracle
3 34 (7.38%) SAP
4 22 (4.77%) Salesforce
5 18 (3.90%) ServiceNow
6 7 (1.52%) ION Trading
6 7 (1.52%) Salesforce Marketing Cloud
7 6 (1.30%) Bloomberg
7 6 (1.30%) Databricks
8 4 (0.87%) Google
8 4 (0.87%) Workday
9 3 (0.65%) Facebook
9 3 (0.65%) Instagram
9 3 (0.65%) NEC
9 3 (0.65%) TikTok
9 3 (0.65%) Twitter
9 3 (0.65%) YouTube
10 2 (0.43%) Citrix
10 2 (0.43%) Murex
10 2 (0.43%) PeopleSoft