Spring Boot Jobs in London

Spring Boot
England > London

The table below provides summary statistics for permanent job vacancies advertised in London requiring Spring Boot skills. It includes a benchmarking guide to the annual salaries offered in vacancies that cited Spring Boot over the 6 months leading up to 27 July 2024, comparing them to the same period in the previous two years.

6 months to
27 Jul 2024
Same period 2023 Same period 2022
Rank 225 189 140
Rank change year-on-year -36 -49 +2
Permanent jobs citing Spring Boot 280 503 2,291
As % of all permanent jobs advertised in London 1.35% 1.86% 3.06%
As % of the Libraries, Frameworks & Software Standards category 5.46% 5.87% 6.90%
Number of salaries quoted 206 405 669
10th Percentile £55,000 £52,500 £50,500
25th Percentile £67,500 £68,750 £63,750
Median annual salary (50th Percentile) £85,000 £85,000 £85,000
Median % change year-on-year - - +6.25%
75th Percentile £105,000 £110,000 £106,250
90th Percentile £125,000 £122,500 £125,000
England median annual salary £80,000 £80,000 £75,000
% change year-on-year - +6.67% +7.14%

All Software Libraries and Frameworks
London

Spring Boot falls under the Software Libraries and Frameworks category. For comparison with the information above, the following table provides summary statistics for all permanent job vacancies requiring technical specification, industry standards, software libraries and framework skills in London.

Permanent vacancies with a requirement for technical specification, industry standards, software libraries and framework skills 5,125 8,570 33,200
As % of all permanent jobs advertised in London 24.75% 31.75% 44.33%
Number of salaries quoted 3,869 7,080 12,522
10th Percentile £48,750 £50,000 £47,500
25th Percentile £62,500 £62,500 £58,250
Median annual salary (50th Percentile) £85,000 £80,000 £75,000
Median % change year-on-year +6.25% +6.67% +3.45%
75th Percentile £112,500 £100,000 £95,000
90th Percentile £142,500 £120,000 £115,000
England median annual salary £60,125 £67,500 £65,000
% change year-on-year -10.93% +3.85% +8.33%

Spring Boot
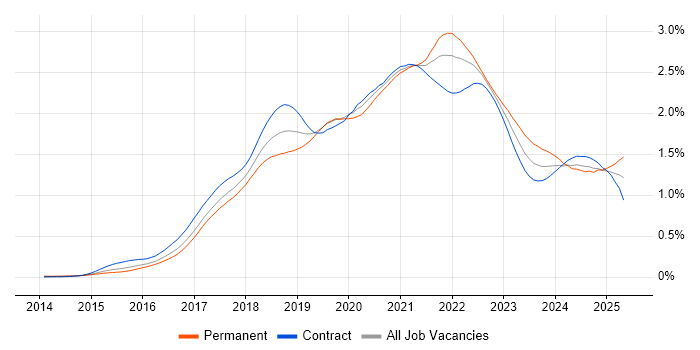
Job Vacancy Trend in London

Job postings citing Spring Boot as a proportion of all IT jobs advertised in London.

Job vacancy trend for Spring Boot in London

Spring Boot
Salary Trend in London

3-month moving average salary quoted in jobs citing Spring Boot in London.

Salary trend for Spring Boot in London

Spring Boot
Salary Histogram in London

Salary distribution for jobs citing Spring Boot in London over the 6 months to 27 July 2024.

Salary histogram for Spring Boot in London

Spring Boot
Job Locations in London

The table below looks at the demand and provides a guide to the median salaries quoted in IT jobs citing Spring Boot within the London region over the 6 months to 27 July 2024. The 'Rank Change' column provides an indication of the change in demand within each location based on the same 6 month period last year.

Location Rank Change
on Same Period
Last Year
Matching
Permanent
IT Job Ads
Median Salary
Past 6 Months
Median Salary
% Change
on Same Period
Last Year
Live
Jobs
Central London -69 38 £90,000 - 3
South London +3 22 £82,500 +29.41% 1
East London - 2 £95,000 - 1
Spring Boot
England

Spring Boot
Co-occurring Skills and Capabilities in London by Category

The follow tables expand on the table above by listing co-occurrences grouped by category. The same employment type, locality and period is covered with up to 20 co-occurrences shown in each of the following categories:

Application Platforms
1 15 (5.36%) Tomcat
2 11 (3.93%) Apache
3 7 (2.50%) OpenStack
4 6 (2.14%) Apache Spark
4 6 (2.14%) JBoss
4 6 (2.14%) Red Hat Fuse
5 5 (1.79%) Confluence
6 4 (1.43%) WebLogic
7 2 (0.71%) Apache Pig
7 2 (0.71%) Cloud Foundry
7 2 (0.71%) Drupal
7 2 (0.71%) nginx
8 1 (0.36%) Adobe Experience Manager
8 1 (0.36%) Camunda
8 1 (0.36%) CMS
8 1 (0.36%) Documentum
Business Applications
1 4 (1.43%) Sparx Enterprise Architect
Cloud Services
1 196 (70.00%) AWS
2 36 (12.86%) Serverless
3 25 (8.93%) Amazon EKS
4 24 (8.57%) Azure
5 20 (7.14%) Amazon ECS
6 15 (5.36%) GCP
7 14 (5.00%) Amazon EC2
8 11 (3.93%) AWS Lambda
9 8 (2.86%) Amazon SQS
10 7 (2.50%) Amazon S3
11 5 (1.79%) Amazon Kinesis
11 5 (1.79%) OpenShift
12 4 (1.43%) Kong
12 4 (1.43%) WhatsApp
13 3 (1.07%) Amazon CloudWatch
13 3 (1.07%) Amazon SageMaker
13 3 (1.07%) AWS CloudFormation
13 3 (1.07%) Cloud Computing
14 2 (0.71%) Apigee
14 2 (0.71%) Azure DevOps
Communications & Networking
1 5 (1.79%) FTP
2 4 (1.43%) BGP
2 4 (1.43%) DNS
2 4 (1.43%) SSL
2 4 (1.43%) TCP/IP
3 2 (0.71%) Firewall
3 2 (0.71%) HTTP
Database & Business Intelligence
1 44 (15.71%) Relational Database
2 40 (14.29%) PostgreSQL
3 29 (10.36%) NoSQL
4 22 (7.86%) SQL Server
5 18 (6.43%) MySQL
6 15 (5.36%) RDBMS
7 11 (3.93%) Amazon RDS
7 11 (3.93%) Redis
8 10 (3.57%) DB2
8 10 (3.57%) MongoDB
9 8 (2.86%) Big Data
10 6 (2.14%) Flink
10 6 (2.14%) MariaDB
11 5 (1.79%) Elasticsearch
12 4 (1.43%) Amazon Redshift
12 4 (1.43%) Data Warehouse
12 4 (1.43%) Oracle Database
13 3 (1.07%) BigQuery
14 2 (0.71%) Amazon Aurora
14 2 (0.71%) Bigtable
Development Applications
1 41 (14.64%) Jenkins
2 37 (13.21%) Git
3 31 (11.07%) Maven
4 25 (8.93%) JUnit
5 13 (4.64%) Mockito
5 13 (4.64%) Selenium
6 12 (4.29%) Cucumber
7 11 (3.93%) JIRA
8 8 (2.86%) JMeter
9 7 (2.50%) Postman
9 7 (2.50%) SonarQube
10 4 (1.43%) Gradle
10 4 (1.43%) Sonatype Nexus
11 3 (1.07%) Artifactory
12 2 (0.71%) Bitbucket
12 2 (0.71%) Checkstyle
12 2 (0.71%) Jaeger
12 2 (0.71%) Mocha
12 2 (0.71%) Spinnaker
12 2 (0.71%) TestNG
General
1 106 (37.86%) Finance
2 33 (11.79%) Banking
3 32 (11.43%) Social Skills
4 18 (6.43%) Front Office
5 15 (5.36%) Retail Banking
6 14 (5.00%) Public Sector
7 12 (4.29%) Inclusion and Diversity
8 10 (3.57%) Law
8 10 (3.57%) Turkish Language
9 9 (3.21%) Analytical Skills
9 9 (3.21%) Investment Banking
9 9 (3.21%) Marketing
10 6 (2.14%) Legal
10 6 (2.14%) Tech for Good
11 5 (1.79%) Advertising
12 4 (1.43%) Financial Institution
12 4 (1.43%) Games
13 2 (0.71%) Manufacturing
13 2 (0.71%) Presentation Skills
14 1 (0.36%) Influencing Skills
Job Titles
1 171 (61.07%) Developer
2 152 (54.29%) Java Developer
3 80 (28.57%) Senior
4 58 (20.71%) Senior Developer
5 55 (19.64%) Senior Java Developer
6 50 (17.86%) Lead
7 45 (16.07%) Software Engineer
8 41 (14.64%) Full Stack Developer
9 35 (12.50%) Java Engineer
10 31 (11.07%) Full Stack Java Developer
11 28 (10.00%) Java Software Engineer
12 23 (8.21%) Angular Developer
13 21 (7.50%) Technical Leader
14 13 (4.64%) Architect
14 13 (4.64%) Backend Developer
15 12 (4.29%) Senior Software Engineer
16 10 (3.57%) Python Developer
16 10 (3.57%) Solutions Architect
17 9 (3.21%) Applications Developer
17 9 (3.21%) Mid-Level Java Developer
Libraries, Frameworks & Software Standards
1 204 (72.86%) Spring
2 77 (27.50%) Kafka
3 60 (21.43%) AngularJS
3 60 (21.43%) Hibernate
4 48 (17.14%) HTML
5 42 (15.00%) RESTful
6 35 (12.50%) REST
7 34 (12.14%) CSS
8 32 (11.43%) React
9 29 (10.36%) Web Services
10 20 (7.14%) JPA
11 17 (6.07%) Angular 2
11 17 (6.07%) Node.js
12 16 (5.71%) Apache Camel
12 16 (5.71%) J2EE
13 12 (4.29%) SOAP
13 12 (4.29%) XML
14 11 (3.93%) jQuery
14 11 (3.93%) RabbitMQ
15 10 (3.57%) HTML5
Miscellaneous
1 31 (11.07%) Foreign Exchange (FX)
2 30 (10.71%) Distributed Systems
3 19 (6.79%) Enterprise Software
4 14 (5.00%) Cloud Native
5 12 (4.29%) Virtual Team
6 11 (3.93%) Algorithms
7 10 (3.57%) Data Structures
7 10 (3.57%) Onboarding
8 7 (2.50%) Management Information System
9 6 (2.14%) Client/Server
9 6 (2.14%) Fixed Income
9 6 (2.14%) Public Cloud
10 5 (1.79%) Hedge funds
10 5 (1.79%) Product Ownership
11 3 (1.07%) Analytical Mindset
11 3 (1.07%) Greenfield Project
11 3 (1.07%) Mobile App
11 3 (1.07%) PKI
11 3 (1.07%) PropTech
11 3 (1.07%) Self-Motivation
Operating Systems
1 13 (4.64%) Linux
2 4 (1.43%) Red Hat Enterprise Linux
3 2 (0.71%) Unix
Processes & Methodologies
1 171 (61.07%) Microservices
2 86 (30.71%) Agile
3 76 (27.14%) TDD
4 73 (26.07%) Full Stack Development
5 66 (23.57%) SDLC
6 63 (22.50%) Software Engineering
7 60 (21.43%) CI/CD
8 59 (21.07%) Fintech
9 58 (20.71%) DevOps
10 39 (13.93%) BDD
11 38 (13.57%) Mentoring
12 37 (13.21%) Low Latency
13 36 (12.86%) Scrum
14 35 (12.50%) Design Patterns
15 31 (11.07%) Problem-Solving
16 28 (10.00%) Kanban
17 27 (9.64%) OO
18 25 (8.93%) Containerisation
19 21 (7.50%) Test Automation
20 20 (7.14%) Computer Science
Programming Languages
1 274 (97.86%) Java
2 58 (20.71%) SQL
3 48 (17.14%) JavaScript
4 33 (11.79%) Kotlin
5 27 (9.64%) Python
6 17 (6.07%) TypeScript
7 12 (4.29%) Scala
8 8 (2.86%) Shell Script
9 6 (2.14%) PHP
10 5 (1.79%) Clojure
10 5 (1.79%) Go
10 5 (1.79%) Groovy
11 4 (1.43%) PL/SQL
12 1 (0.36%) Erlang
Qualifications
1 24 (8.57%) Degree
2 22 (7.86%) Security Cleared
3 19 (6.79%) SC Cleared
4 16 (5.71%) Computer Science Degree
5 8 (2.86%) AWS Certification
6 7 (2.50%) AWS Certified Solutions Architect
7 5 (1.79%) Azure Certification
7 5 (1.79%) DV Cleared
8 3 (1.07%) AWS Certified Developer
8 3 (1.07%) Postgraduate
9 1 (0.36%) Master's Degree
9 1 (0.36%) Sun Certification
9 1 (0.36%) TOGAF Certification
Quality Assurance & Compliance
1 7 (2.50%) QA
2 5 (1.79%) MiFID
3 3 (1.07%) GDPR
4 1 (0.36%) Accessibility
4 1 (0.36%) ISO/IEC 27001
4 1 (0.36%) NCSC
System Software
1 124 (44.29%) Docker
2 2 (0.71%) HDFS
Systems Management
1 137 (48.93%) Kubernetes
2 21 (7.50%) Terraform
3 19 (6.79%) Ansible
4 8 (2.86%) Kibana
5 3 (1.07%) Progress Chef
5 3 (1.07%) Puppet
6 2 (0.71%) Grafana
6 2 (0.71%) Kiali
6 2 (0.71%) Kustomize
6 2 (0.71%) Packer
7 1 (0.36%) Prometheus
Vendors
1 18 (6.43%) Oracle
2 9 (3.21%) ION Trading
2 9 (3.21%) Splunk
3 7 (2.50%) Dynatrace
4 6 (2.14%) WSO2
5 5 (1.79%) Bloomberg
5 5 (1.79%) Reuters
6 4 (1.43%) Google
6 4 (1.43%) Sparx
6 4 (1.43%) Vertica
7 2 (0.71%) AppDynamics
7 2 (0.71%) Red Hat
8 1 (0.36%) Adobe
8 1 (0.36%) Atlassian
8 1 (0.36%) iManage
8 1 (0.36%) Progress
8 1 (0.36%) Solace
8 1 (0.36%) Sybase
8 1 (0.36%) Tradeweb