Procure-to-Pay Contracts in London

Procure-to-Pay (including Purchase-to-Pay, P2P)
England > London

The table below provides summary statistics for contract job vacancies advertised in London requiring Procure-to-Pay skills. It includes a benchmarking guide to the contractor rates offered in vacancies that cited Procure-to-Pay over the 6 months leading up to 20 May 2025, comparing them to the same period in the previous two years.

6 months to
20 May 2025
Same period 2024 Same period 2023
Rank 292 345 392
Rank change year-on-year +53 +47 +122
Contract jobs citing Procure-to-Pay 56 53 100
As % of all contract jobs advertised in London 0.45% 0.30% 0.38%
As % of the Processes & Methodologies category 0.49% 0.34% 0.42%
Number of daily rates quoted 35 38 52
10th Percentile £435 £436 £401
25th Percentile £481 £466 £467
Median daily rate (50th Percentile) £575 £575 £573
Median % change year-on-year - +0.44% -0.43%
75th Percentile £646 £669 £638
90th Percentile £817 £745 £900
England median daily rate £575 £550 £575
% change year-on-year +4.55% -4.35% +4.55%
Number of hourly rates quoted 2 0 1
10th Percentile £56.75 - -
25th Percentile £63.13 - £92.50
Median hourly rate £75.00 - £95.00
75th Percentile £85.63 - £97.50
90th Percentile £91.25 - -
England median hourly rate £75.00 £30.00 £75.00
% change year-on-year +150.00% -60.00% -

All Process and Methodology Skills
London

Procure-to-Pay falls under the Processes and Methodologies category. For comparison with the information above, the following table provides summary statistics for all contract job vacancies requiring process or methodology skills in London.

Contract vacancies with a requirement for process or methodology skills 11,428 15,487 23,653
As % of all contract IT jobs advertised in London 92.23% 88.63% 90.88%
Number of daily rates quoted 7,717 11,108 17,077
10th Percentile £350 £343 £375
25th Percentile £435 £450 £475
Median daily rate (50th Percentile) £550 £550 £593
Median % change year-on-year - -7.17% +3.04%
75th Percentile £688 £680 £700
90th Percentile £811 £800 £800
England median daily rate £525 £525 £550
% change year-on-year - -4.55% +1.85%
Number of hourly rates quoted 182 307 267
10th Percentile £15.91 £15.77 £18.30
25th Percentile £22.79 £20.00 £22.45
Median hourly rate £34.00 £27.84 £37.34
Median % change year-on-year +22.13% -25.44% +2.55%
75th Percentile £50.69 £48.75 £63.88
90th Percentile £63.75 £66.85 £82.50
England median hourly rate £28.60 £36.50 £37.15
% change year-on-year -21.64% -1.75% +48.60%

Procure-to-Pay
Job Vacancy Trend in London

Job postings citing Procure-to-Pay as a proportion of all IT jobs advertised in London.
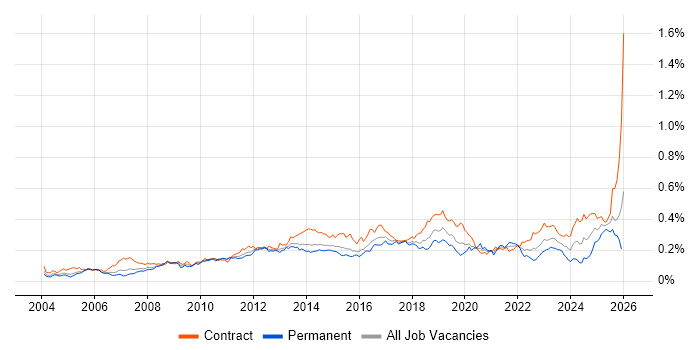
Job vacancy trend for Procure-to-Pay in London

Procure-to-Pay
Contractor Daily Rate Trend in London

3-month moving average daily rate quoted in jobs citing Procure-to-Pay in London.

Daily rate trend for Procure-to-Pay in London

Procure-to-Pay
Daily Rate Histogram in London

Daily rate distribution for jobs citing Procure-to-Pay in London over the 6 months to 20 May 2025.

Daily rate histogram for Procure-to-Pay in London

Procure-to-Pay
Contractor Hourly Rate Trend in London

3-month moving average hourly rates quoted in jobs citing Procure-to-Pay in London.

Hourly rate trend for Procure-to-Pay in London

Procure-to-Pay
Hourly Rate Histogram in London

Hourly rate distribution of jobs citing Procure-to-Pay in London over the 6 months to 20 May 2025.

Hourly rate histogram for Procure-to-Pay in London

Procure-to-Pay
Contract Job Locations in London

The table below looks at the demand and provides a guide to the median contractor rates quoted in IT jobs citing Procure-to-Pay within the London region over the 6 months to 20 May 2025. The 'Rank Change' column provides an indication of the change in demand within each location based on the same 6 month period last year.

Location Rank Change
on Same Period
Last Year
Matching
Contract
IT Job Ads
Median
Daily Rate
Past 6 Months
Median Daily Rate
% Change
on Same Period
Last Year
Live
Jobs
Central London +9 9 £775 +29.17% 6
West London +11 1 - - 1
Procure-to-Pay
England

Procure-to-Pay
Co-occurring Skills and Capabilities in London by Category

The follow tables expand on the table above by listing co-occurrences grouped by category. The same employment type, locality and period is covered with up to 20 co-occurrences shown in each of the following categories:

Application Platforms
1 3 (5.36%) NetWeaver
2 2 (3.57%) Oracle Workflow
3 1 (1.79%) Oracle SOA Suite
3 1 (1.79%) SharePoint Server
Applications
1 5 (8.93%) Microsoft Excel
2 3 (5.36%) Microsoft PowerPoint
3 1 (1.79%) Microsoft Office
Business Applications
1 9 (16.07%) Oracle Procure-to-Pay
2 8 (14.29%) SAP S/4HANA
3 4 (7.14%) Oracle EBS
3 4 (7.14%) Oracle Payables
4 3 (5.36%) Oracle Assets
4 3 (5.36%) Oracle Financials
5 2 (3.57%) Oracle EBS R12
5 2 (3.57%) Oracle General Ledger
5 2 (3.57%) Oracle Internet Expenses
5 2 (3.57%) Oracle iProcurement
5 2 (3.57%) Oracle Receivables
5 2 (3.57%) SAP CO
5 2 (3.57%) SAP FI
5 2 (3.57%) SAP FI/CO
5 2 (3.57%) SAP HCM
5 2 (3.57%) SAP MM
5 2 (3.57%) SAP SRM
6 1 (1.79%) Dynamics AX
6 1 (1.79%) SAP PP
6 1 (1.79%) SAP SCM
Cloud Services
1 4 (7.14%) SaaS
2 3 (5.36%) Dynamics 365
2 3 (5.36%) OCI
2 3 (5.36%) Power Platform
3 2 (3.57%) IaaS
3 2 (3.57%) PaaS
3 2 (3.57%) SuccessFactors
4 1 (1.79%) AWS
4 1 (1.79%) Azure
4 1 (1.79%) Azure DevOps
4 1 (1.79%) Google Sheets
4 1 (1.79%) Google Workspace
4 1 (1.79%) Microsoft 365
4 1 (1.79%) PowerApps
4 1 (1.79%) Vertex AI
4 1 (1.79%) WhatsApp
Database & Business Intelligence
1 3 (5.36%) Power BI
1 3 (5.36%) SQL Server Reporting Services
2 2 (3.57%) Oracle Reports
2 2 (3.57%) SAP HANA
2 2 (3.57%) SQL Server
3 1 (1.79%) BusinessObjects
3 1 (1.79%) Crystal Reports
3 1 (1.79%) Data Mining
3 1 (1.79%) SAP Data Services
3 1 (1.79%) Tableau
Development Applications
1 2 (3.57%) Oracle Forms
2 1 (1.79%) GitLab
2 1 (1.79%) Jenkins
2 1 (1.79%) JIRA
2 1 (1.79%) LSMW
General
1 44 (78.57%) Finance
2 17 (30.36%) Social Skills
3 7 (12.50%) Legal
4 6 (10.71%) Banking
4 6 (10.71%) Pharmaceutical
5 5 (8.93%) Inclusion and Diversity
6 3 (5.36%) General Ledger
7 2 (3.57%) Advertising
7 2 (3.57%) Analytical Skills
7 2 (3.57%) Back Office
7 2 (3.57%) Investment Banking
7 2 (3.57%) Manufacturing
7 2 (3.57%) Marketing
7 2 (3.57%) Polish Language
7 2 (3.57%) Retail
8 1 (1.79%) Aerospace
8 1 (1.79%) Billing
8 1 (1.79%) International Banking
8 1 (1.79%) Presentation Skills
8 1 (1.79%) Public Sector
Job Titles
1 19 (33.93%) Consultant
2 10 (17.86%) SAP Consultant
3 8 (14.29%) Analyst
3 8 (14.29%) Project Manager
4 7 (12.50%) Lead
5 6 (10.71%) Procurement Manager
6 5 (8.93%) SAP P2P Consultant
7 4 (7.14%) Oracle Consultant
7 4 (7.14%) Procurement Project Manager
8 3 (5.36%) Digital Project Manager
8 3 (5.36%) Functional Consultant
8 3 (5.36%) Oracle Financials Consultant
8 3 (5.36%) SAP Analyst
8 3 (5.36%) SAP Manager
8 3 (5.36%) SAP Project Manager
8 3 (5.36%) Senior
8 3 (5.36%) Senior Digital Project Manager
8 3 (5.36%) Senior Manager
8 3 (5.36%) Senior Procurement Manager
8 3 (5.36%) Senior Project Manager
Libraries, Frameworks & Software Standards
1 5 (8.93%) SAP Fiori
2 3 (5.36%) SAPUI5
3 2 (3.57%) Middleware
3 2 (3.57%) Oracle Fusion
4 1 (1.79%) BAPI
4 1 (1.79%) EDI
4 1 (1.79%) SAP PI
4 1 (1.79%) XML
4 1 (1.79%) XML Messaging
Miscellaneous
1 4 (7.14%) Onboarding
2 2 (3.57%) Legacy Systems
2 2 (3.57%) Management Information System
3 1 (1.79%) Data Protection Act
3 1 (1.79%) Foreign Exchange (FX)
3 1 (1.79%) Greenfield Project
3 1 (1.79%) IoT
3 1 (1.79%) Life Science
3 1 (1.79%) Oculus
3 1 (1.79%) Virtual Team
Operating Systems
1 1 (1.79%) Linux
1 1 (1.79%) Windows
Processes & Methodologies
1 21 (37.50%) ERP
2 14 (25.00%) Accounts Payable
2 14 (25.00%) Record to Report
3 12 (21.43%) Order to Cash
4 10 (17.86%) Process Improvement
5 9 (16.07%) Agile
5 9 (16.07%) Migration
5 9 (16.07%) Problem-Solving
6 8 (14.29%) Change Management
6 8 (14.29%) Data Migration
6 8 (14.29%) Project Management
7 7 (12.50%) Indirect Procurement
7 7 (12.50%) Stakeholder Engagement
8 6 (10.71%) Accounts Receivable
8 6 (10.71%) User Acceptance Testing
8 6 (10.71%) Workflow
9 5 (8.93%) Matrix Organization
9 5 (8.93%) Source to Pay
9 5 (8.93%) User Experience
10 4 (7.14%) Collaborative Working
Programming Languages
1 8 (14.29%) SQL
2 3 (5.36%) ABAP
3 2 (3.57%) PL/SQL
4 1 (1.79%) Python
Qualifications
1 6 (10.71%) Degree
2 3 (5.36%) Master's Degree
2 3 (5.36%) SAP Certification
3 2 (3.57%) BPSS Clearance
4 1 (1.79%) CISA
4 1 (1.79%) CISM
4 1 (1.79%) CISSP
4 1 (1.79%) CRISC
4 1 (1.79%) DV Cleared
4 1 (1.79%) PMI Certification
4 1 (1.79%) PMP
4 1 (1.79%) SC Cleared
4 1 (1.79%) Security Cleared
Quality Assurance & Compliance
1 2 (3.57%) Accessibility
1 2 (3.57%) GAAP
1 2 (3.57%) IFRS
1 2 (3.57%) QA
1 2 (3.57%) Sarbanes-Oxley
2 1 (1.79%) COBIT
2 1 (1.79%) ISO/IEC 27001
2 1 (1.79%) NIST
System Software
1 1 (1.79%) Docker
Systems Management
1 1 (1.79%) Control-M
1 1 (1.79%) Puppet
Vendors
1 28 (50.00%) SAP
2 9 (16.07%) Oracle
3 8 (14.29%) Ariba
3 8 (14.29%) Workday
4 5 (8.93%) Salesforce
5 4 (7.14%) Microsoft
6 3 (5.36%) ServiceNow
7 2 (3.57%) Concur
7 2 (3.57%) MuleSoft
8 1 (1.79%) Aderant
8 1 (1.79%) Google
8 1 (1.79%) IBM
8 1 (1.79%) Informatica
8 1 (1.79%) Instagram
8 1 (1.79%) PeopleSoft
8 1 (1.79%) Snow