General Ledger Contract Job Trends in London

General Ledger
England > London

The table below looks at the prevalence of the term General Ledger in contract job vacancies in London. Included is a benchmarking guide to the contractor rates offered in vacancies that cited General Ledger over the 6 months leading up to 23 November 2025, comparing them to the same period in the previous two years.

6 months to
23 Nov 2025
Same period 2024 Same period 2023
Rank 314 331 392
Rank change year-on-year +17 +61 +123
Contract jobs citing General Ledger 64 61 36
As % of all contract jobs in London 0.45% 0.38% 0.18%
As % of the General category 0.67% 0.61% 0.28%
Number of daily rates quoted 40 44 27
10th Percentile £448 £495 £429
25th Percentile £572 £520 £500
Median daily rate (50th Percentile) £613 £625 £528
Median % change year-on-year -2.00% +18.37% -8.17%
75th Percentile £691 £703 £631
90th Percentile £765 £768 £745
England median daily rate £600 £575 £563
% change year-on-year +4.35% +2.22% +21.62%
Number of hourly rates quoted 2 0 0
10th Percentile £53.38 - -
25th Percentile £54.69 - -
Median hourly rate £58.75 - -
75th Percentile £62.19 - -
90th Percentile £63.13 - -
England median hourly rate £55.00 £42.50 £19.50
% change year-on-year +29.41% +117.95% -

All General Skills
London

General Ledger falls under the General Skills category. For comparison with the information above, the following table provides summary statistics for all contract job vacancies requiring common skills in London.

Contract vacancies with a requirement for common skills 9,594 10,043 13,004
As % of all contract IT jobs advertised in London 68.20% 63.12% 64.96%
Number of daily rates quoted 6,263 6,447 9,406
10th Percentile £325 £325 £350
25th Percentile £425 £450 £463
Median daily rate (50th Percentile) £537 £575 £575
Median % change year-on-year -6.61% - -4.17%
75th Percentile £670 £700 £700
90th Percentile £780 £825 £800
England median daily rate £500 £535 £550
% change year-on-year -6.54% -2.73% -
Number of hourly rates quoted 196 118 169
10th Percentile £17.50 £17.43 £18.47
25th Percentile £20.08 £27.13 £21.25
Median hourly rate £26.40 £39.00 £35.25
Median % change year-on-year -32.31% +10.64% +6.82%
75th Percentile £45.44 £55.94 £58.75
90th Percentile £71.00 £78.51 £75.25
England median hourly rate £24.61 £31.62 £32.50
% change year-on-year -22.17% -2.71% +26.41%

General Ledger
Job Vacancy Trend in London

Historical trend showing the proportion of contract IT job postings citing General Ledger relative to all contract IT jobs advertised in London.
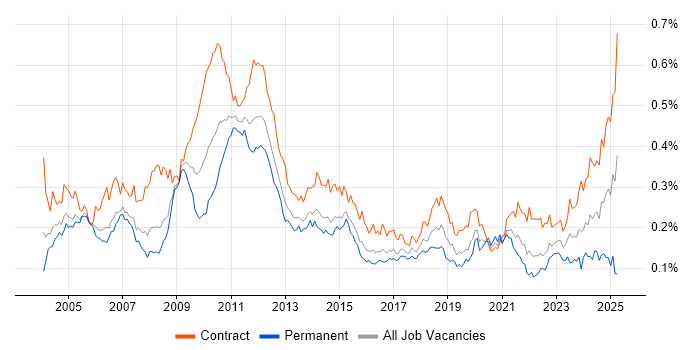
General Ledger job vacancy trend in London

General Ledger
Daily Rate Trend in London

Contractor daily rate distribution trend for jobs in London citing General Ledger.

Contractor daily rate distribution trend for jobs in London citing General Ledger

General Ledger
Daily Rate Histogram in London

Daily rate distribution for jobs citing General Ledger in London over the 6 months to 23 November 2025.

Daily rate histogram for General Ledger in London

General Ledger
Hourly Rate Trend in London

Contractor hourly rate distribution trend for jobs in London citing General Ledger.

Contractor hourly rate distribution trend for jobs in London citing General Ledger

General Ledger
Contract Job Locations in London

The table below looks at the demand and provides a guide to the median contractor rates quoted in IT jobs citing General Ledger within the London region over the 6 months to 23 November 2025. The 'Rank Change' column provides an indication of the change in demand within each location based on the same 6 month period last year.

Location Rank Change
on Same Period
Last Year
Matching
Contract
IT Job Ads
Median
Daily Rate
Past 6 Months
Median Daily Rate
% Change
on Same Period
Last Year
Live
Jobs
Central London +5 9 £700 +3.70% 1
East London - 1 £415 - 1
General Ledger
England

General Ledger
Co-Occurring Skills & Capabilities in London by Category

The following tables expand on the one above by listing co-occurrences grouped by category. They cover the same employment type, locality and period, with up to 20 co-occurrences shown in each category:

Application Platforms
1 6 (9.38%) Oracle Workflow
2 1 (1.56%) Confluence
Applications
1 6 (9.38%) Microsoft Excel
2 2 (3.13%) Oracle Smart View
3 1 (1.56%) Microsoft PowerPoint
Business Applications
1 26 (40.63%) Oracle Payables
2 24 (37.50%) Oracle General Ledger
3 21 (32.81%) Oracle EBS
4 19 (29.69%) Oracle Assets
5 16 (25.00%) Oracle EBS R12
6 15 (23.44%) Oracle Financials
7 10 (15.63%) Oracle E-Business Tax
7 10 (15.63%) Oracle Receivables
8 6 (9.38%) Oracle Subledger Accounting
9 5 (7.81%) Oracle Cash Management
9 5 (7.81%) Oracle FAH
10 1 (1.56%) Avolution ABACUS
10 1 (1.56%) Elite 3E
10 1 (1.56%) Endur
10 1 (1.56%) FLEXCUBE
10 1 (1.56%) MultiFonds
10 1 (1.56%) Oracle ERP
10 1 (1.56%) Oracle Procure-to-Pay
10 1 (1.56%) SAP R/3
10 1 (1.56%) SAP S/4HANA
Cloud Services
1 8 (12.50%) SaaS
2 6 (9.38%) Azure
3 5 (7.81%) Dynamics 365
3 5 (7.81%) OCI
3 5 (7.81%) Power Platform
4 3 (4.69%) Azure DevOps
5 1 (1.56%) AWS
5 1 (1.56%) Cloud Computing
5 1 (1.56%) dbt
5 1 (1.56%) GitHub
5 1 (1.56%) PaaS
Database & Business Intelligence
1 9 (14.06%) Oracle Reports
2 7 (10.94%) Oracle BI Publisher
3 5 (7.81%) Power BI
4 4 (6.25%) Data Warehouse
5 3 (4.69%) SQL Server Reporting Services
6 2 (3.13%) Data Lake
7 1 (1.56%) Big Data
7 1 (1.56%) Delta Lake
7 1 (1.56%) Oracle Database
7 1 (1.56%) Oracle ODI
7 1 (1.56%) SQL Server
7 1 (1.56%) Tableau
Development Applications
1 5 (7.81%) Oracle Forms
2 3 (4.69%) Visual Studio
3 2 (3.13%) Oracle APEX
4 1 (1.56%) JIRA
General
1 58 (90.63%) Finance
2 24 (37.50%) Social Skills
3 16 (25.00%) Banking
4 11 (17.19%) Analytical Skills
5 8 (12.50%) Law
6 6 (9.38%) Billing
7 5 (7.81%) Manufacturing
8 4 (6.25%) Presentation Skills
8 4 (6.25%) Public Sector
8 4 (6.25%) Publishing
9 3 (4.69%) Documentation Skills
9 3 (4.69%) Financial Institution
10 2 (3.13%) Back Office
10 2 (3.13%) Legal
11 1 (1.56%) Advertising
11 1 (1.56%) Organisational Skills
11 1 (1.56%) Retail
Job Titles
1 15 (23.44%) Consultant
2 13 (20.31%) Analyst
2 13 (20.31%) Oracle Consultant
3 10 (15.63%) Business Analyst
3 10 (15.63%) Developer
4 9 (14.06%) Functional Consultant
5 7 (10.94%) Oracle Developer
5 7 (10.94%) Oracle Financials Consultant
5 7 (10.94%) Oracle Functional Consultant
6 6 (9.38%) Financial Analyst
7 5 (7.81%) Architect
7 5 (7.81%) Oracle Financials Functional Consultant
7 5 (7.81%) Solutions Architect
8 4 (6.25%) Financial Controller
8 4 (6.25%) Lead
9 3 (4.69%) Business Developer
9 3 (4.69%) Dynamics 365 Developer
9 3 (4.69%) Finance Business Analyst
9 3 (4.69%) Finance Systems Analyst
9 3 (4.69%) Senior
Libraries, Frameworks & Software Standards
1 7 (10.94%) Oracle Fusion
2 3 (4.69%) REST
3 2 (3.13%) SOAP
4 1 (1.56%) EDI
4 1 (1.56%) Middleware
4 1 (1.56%) Web Services
4 1 (1.56%) XML
4 1 (1.56%) XML Messaging
Miscellaneous
1 7 (10.94%) Management Information System
2 5 (7.81%) Legacy Systems
3 3 (4.69%) Foreign Exchange (FX)
4 2 (3.13%) Data Structures
4 2 (3.13%) Reinsurance
5 1 (1.56%) Analytical Mindset
5 1 (1.56%) AS400
5 1 (1.56%) Greenfield Project
5 1 (1.56%) PMI
5 1 (1.56%) Tandem
Operating Systems
1 4 (6.25%) Unix
Processes & Methodologies
1 26 (40.63%) Accounts Payable
2 13 (20.31%) ERP
3 12 (18.75%) Accounts Receivable
3 12 (18.75%) Migration
4 11 (17.19%) Business Intelligence
4 11 (17.19%) User Acceptance Testing
5 10 (15.63%) Change Management
5 10 (15.63%) Problem-Solving
6 9 (14.06%) Cash Management
6 9 (14.06%) Requirements Gathering
6 9 (14.06%) System Integration Testing
7 7 (10.94%) Data Migration
7 7 (10.94%) Decision-Making
8 6 (9.38%) Business Analysis
8 6 (9.38%) GAP Analysis
8 6 (9.38%) Record to Report
8 6 (9.38%) Validation
8 6 (9.38%) Workflow
9 5 (7.81%) Budgeting and Forecasting
9 5 (7.81%) Integration Patterns
Programming Languages
1 22 (34.38%) SQL
2 9 (14.06%) PL/SQL
3 3 (4.69%) X++
4 2 (3.13%) Java
Qualifications
1 9 (14.06%) Security Cleared
2 8 (12.50%) ACCA
2 8 (12.50%) CIMA
3 7 (10.94%) Degree
4 5 (7.81%) SC Cleared
5 2 (3.13%) ITIL Foundation Certificate
5 2 (3.13%) PMI Certification
6 1 (1.56%) Computer Science Degree
6 1 (1.56%) ISTQB
6 1 (1.56%) Oracle Certification
6 1 (1.56%) PMP
Quality Assurance & Compliance
1 4 (6.25%) IFRS
1 4 (6.25%) PMO
2 2 (3.13%) GAAP
2 2 (3.13%) IFRS 9
2 2 (3.13%) QA
2 2 (3.13%) SLA
3 1 (1.56%) Basel III
3 1 (1.56%) Data Quality
3 1 (1.56%) Sarbanes-Oxley
System Software
1 1 (1.56%) PowerHA
Vendors
1 32 (50.00%) Oracle
2 6 (9.38%) Microsoft
3 4 (6.25%) Xero
4 3 (4.69%) PeopleSoft
5 2 (3.13%) Databricks
5 2 (3.13%) Murex
5 2 (3.13%) SAP
5 2 (3.13%) Workday
6 1 (1.56%) Adaptive Insights
6 1 (1.56%) Aderant
6 1 (1.56%) eFront
6 1 (1.56%) GoldenSource
6 1 (1.56%) Misys
6 1 (1.56%) ServiceNow
6 1 (1.56%) Tagetik
6 1 (1.56%) Temenos