Project Management Contract Job Trends in London

Project Management
England > London

The table below provides summary statistics and contractor rates for jobs advertised in London requiring Project Management skills. It covers contract job vacancies from the 6 months leading up to 25 October 2025, with comparisons to the same periods in the previous two years.

6 months to
25 Oct 2025
Same period 2024 Same period 2023
Rank 33 25 25
Rank change year-on-year -8 0 +4
Contract jobs citing Project Management 830 1,133 1,564
As % of all contract jobs in London 6.19% 7.17% 7.54%
As % of the Processes & Methodologies category 6.70% 8.03% 8.38%
Number of daily rates quoted 539 657 1,074
10th Percentile £324 £323 £350
25th Percentile £436 £450 £450
Median daily rate (50th Percentile) £545 £550 £550
Median % change year-on-year -0.91% - -
75th Percentile £700 £650 £675
90th Percentile £775 £750 £750
England median daily rate £525 £525 £525
Number of hourly rates quoted 32 26 20
10th Percentile £17.00 £19.13 £24.99
25th Percentile £24.00 £30.31 £29.50
Median hourly rate £34.25 £33.79 £41.00
Median % change year-on-year +1.38% -17.60% +16.31%
75th Percentile £50.00 £42.25 £53.75
90th Percentile £64.88 £59.88 £64.13
England median hourly rate £34.50 £35.00 £42.50
% change year-on-year -1.43% -17.65% +19.72%

All Process and Methodology Skills
London

Project Management falls under the Processes and Methodologies category. For comparison with the information above, the following table provides summary statistics for all contract job vacancies requiring process or methodology skills in London.

Contract vacancies with a requirement for process or methodology skills 12,395 14,106 18,653
As % of all contract IT jobs advertised in London 92.47% 89.30% 89.89%
Number of daily rates quoted 8,151 9,098 13,466
10th Percentile £331 £350 £363
25th Percentile £425 £450 £463
Median daily rate (50th Percentile) £540 £550 £575
Median % change year-on-year -1.82% -4.35% -2.13%
75th Percentile £663 £675 £688
90th Percentile £775 £800 £800
England median daily rate £510 £525 £550
% change year-on-year -2.86% -4.55% -
Number of hourly rates quoted 248 172 233
10th Percentile £17.98 £17.55 £18.36
25th Percentile £25.01 £24.88 £21.50
Median hourly rate £31.00 £38.75 £39.83
Median % change year-on-year -20.01% -2.71% +5.00%
75th Percentile £47.50 £57.81 £63.75
90th Percentile £64.83 £78.75 £77.50
England median hourly rate £25.15 £40.33 £44.50
% change year-on-year -37.63% -9.38% +27.14%

Project Management
Job Vacancy Trend in London

Historical trend showing the proportion of contract IT job postings citing Project Management relative to all contract IT jobs advertised in London.
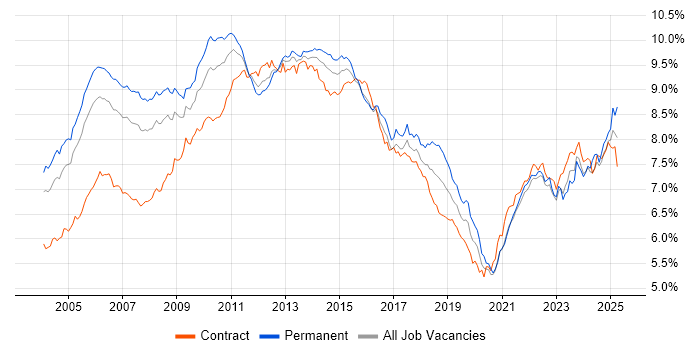
Project Management job vacancy trend in London

Project Management
Daily Rate Trend in London

Contractor daily rate distribution trend for jobs in London citing Project Management.

Contractor daily rate distribution trend for jobs in London citing Project Management

Project Management
Daily Rate Histogram in London

Daily rate distribution for jobs citing Project Management in London over the 6 months to 25 October 2025.

Daily rate histogram for Project Management in London

Project Management
Hourly Rate Trend in London

Contractor hourly rate distribution trend for jobs in London citing Project Management.

Contractor hourly rate distribution trend for jobs in London citing Project Management

Project Management
Hourly Rate Histogram in London

Hourly rate distribution of jobs citing Project Management in London over the 6 months to 25 October 2025.

Hourly rate histogram for Project Management in London

Project Management
Contract Job Locations in London

The table below looks at the demand and provides a guide to the median contractor rates quoted in IT jobs citing Project Management within the London region over the 6 months to 25 October 2025. The 'Rank Change' column provides an indication of the change in demand within each location based on the same 6 month period last year.

Location Rank Change
on Same Period
Last Year
Matching
Contract
IT Job Ads
Median
Daily Rate
Past 6 Months
Median Daily Rate
% Change
on Same Period
Last Year
Live
Jobs
Central London -4 146 £550 -8.33% 237
West London -6 19 £520 +33.33% 68
South London -6 8 £475 - 37
East London 0 6 £523 +10.70% 51
Project Management
England

Project Management
Co-Occurring Skills & Capabilities in London by Category

The following tables expand on the one above by listing co-occurrences grouped by category. They cover the same employment type, locality and period, with up to 20 co-occurrences shown in each category:

Application Platforms
1 49 (5.90%) Confluence
2 41 (4.94%) SharePoint
3 12 (1.45%) CMS
4 7 (0.84%) Microsoft Exchange
5 2 (0.24%) Apache
5 2 (0.24%) Apache Airflow
5 2 (0.24%) Apache Spark
6 1 (0.12%) Sitecore CMS
6 1 (0.12%) Skype for Business
6 1 (0.12%) WordPress
Applications
1 74 (8.92%) Microsoft Excel
2 63 (7.59%) Microsoft Office
3 61 (7.35%) Microsoft Project
4 48 (5.78%) Microsoft PowerPoint
5 24 (2.89%) MS Visio
6 13 (1.57%) Trello
7 6 (0.72%) Chatbot
8 3 (0.36%) Spreadsheet
9 1 (0.12%) Adobe After Effects
9 1 (0.12%) Adobe Creative Suite
9 1 (0.12%) Adobe Illustrator
9 1 (0.12%) InDesign
9 1 (0.12%) Navisworks
9 1 (0.12%) Notion
9 1 (0.12%) Photoshop
9 1 (0.12%) ProjectWise
9 1 (0.12%) PTC Creo
9 1 (0.12%) Revit
Business Applications
1 28 (3.37%) SAP S/4HANA
2 10 (1.20%) Oracle EBS
3 6 (0.72%) Oracle EBS R12
3 6 (0.72%) Oracle Financials
3 6 (0.72%) Oracle Payables
3 6 (0.72%) Workfront
4 5 (0.60%) Aladdin
4 5 (0.60%) Dynamics CRM
5 4 (0.48%) Endur
5 4 (0.48%) Loan IQ
6 3 (0.36%) Eloqua
6 3 (0.36%) Oracle Assets
6 3 (0.36%) Oracle Cash Management
6 3 (0.36%) ProductWriter
6 3 (0.36%) Salesforce CRM
6 3 (0.36%) Shopify
7 2 (0.24%) Oracle General Ledger
7 2 (0.24%) Oracle Receivables
7 2 (0.24%) SAP MDG
7 2 (0.24%) SAP VC
Cloud Services
1 69 (8.31%) Azure
2 48 (5.78%) AWS
3 40 (4.82%) Power Platform
4 32 (3.86%) Microsoft 365
5 23 (2.77%) SaaS
6 19 (2.29%) Azure DevOps
7 15 (1.81%) GitHub
8 14 (1.69%) Asana
9 11 (1.33%) Dynamics 365
9 11 (1.33%) GCP
10 10 (1.20%) Serverless
11 9 (1.08%) Smartsheet
12 8 (0.96%) Entra ID
12 8 (0.96%) Google Workspace
12 8 (0.96%) OneDrive
13 7 (0.84%) Microsoft Copilot
14 6 (0.72%) AWS Lambda
14 6 (0.72%) OCI
15 5 (0.60%) Azure Data Factory
15 5 (0.60%) Salesforce Sales Cloud
Communications & Networking
1 29 (3.49%) Firewall
2 10 (1.20%) VPN
3 8 (0.96%) WAN
4 7 (0.84%) DNS
5 5 (0.60%) LAN
5 5 (0.60%) SSL
6 4 (0.48%) Network Security
6 4 (0.48%) S/MIME
6 4 (0.48%) Structured Cabling
6 4 (0.48%) TCP/IP
6 4 (0.48%) Wi-Fi
7 3 (0.36%) BGP
7 3 (0.36%) MPLS
7 3 (0.36%) MVNO
7 3 (0.36%) SD-WAN
8 2 (0.24%) ATM
8 2 (0.24%) Multicast
8 2 (0.24%) OSPF
8 2 (0.24%) SSH
8 2 (0.24%) VSAN
Database & Business Intelligence
1 35 (4.22%) Power BI
2 20 (2.41%) Tableau
3 17 (2.05%) SQL Server
4 9 (1.08%) Metadata
5 7 (0.84%) PostgreSQL
5 7 (0.84%) SAP HANA
6 6 (0.72%) Data Warehouse
7 5 (0.60%) Amazon RDS
7 5 (0.60%) Data Lake
7 5 (0.60%) Elasticsearch
8 4 (0.48%) DynamoDB
8 4 (0.48%) Relational Database
9 3 (0.36%) Azure SQL Database
9 3 (0.36%) DB2
9 3 (0.36%) MySQL
9 3 (0.36%) Power Query
9 3 (0.36%) RDBMS
10 2 (0.24%) Data Vault
10 2 (0.24%) Delta Lake
10 2 (0.24%) Snowflake Schema
Development Applications
1 134 (16.14%) JIRA
2 10 (1.20%) Jenkins
3 9 (1.08%) SpecFlow
4 5 (0.60%) Cucumber
5 4 (0.48%) Git
5 4 (0.48%) JUnit
5 4 (0.48%) Maven
6 2 (0.24%) Bitbucket
7 1 (0.12%) Artifactory
7 1 (0.12%) Atlassian Bamboo
7 1 (0.12%) Cypress.io
7 1 (0.12%) ERwin
7 1 (0.12%) GitLab
7 1 (0.12%) JMeter
7 1 (0.12%) MLflow
7 1 (0.12%) SonarQube
7 1 (0.12%) Subversion
7 1 (0.12%) Visual Studio
General
1 397 (47.83%) Social Skills
2 362 (43.61%) Finance
3 121 (14.58%) Analytical Skills
3 121 (14.58%) Banking
4 71 (8.55%) Marketing
5 51 (6.14%) Legal
6 48 (5.78%) Organisational Skills
7 46 (5.54%) Front Office
8 39 (4.70%) Public Sector
9 38 (4.58%) Retail
10 33 (3.98%) Investment Banking
11 26 (3.13%) Inclusion and Diversity
11 26 (3.13%) Presentation Skills
12 24 (2.89%) Influencing Skills
13 21 (2.53%) Financial Institution
14 19 (2.29%) Pharmaceutical
15 18 (2.17%) Manufacturing
16 17 (2.05%) Back Office
17 15 (1.81%) Advertising
18 14 (1.69%) Law
Job Titles
1 281 (33.86%) Project Manager
2 98 (11.81%) Analyst
3 83 (10.00%) Lead
4 73 (8.80%) Senior
5 68 (8.19%) Business Analyst
6 50 (6.02%) Consultant
7 44 (5.30%) IT Manager
8 39 (4.70%) Senior Manager
9 30 (3.61%) Developer
10 29 (3.49%) Senior Project Manager
11 28 (3.37%) IT Project Manager
12 26 (3.13%) Programme Manager
13 24 (2.89%) Technical Manager
14 20 (2.41%) Infrastructure Manager
15 19 (2.29%) Infrastructure Project Manager
16 18 (2.17%) Architect
16 18 (2.17%) SAP Manager
17 17 (2.05%) Business Manager
17 17 (2.05%) Delivery Manager
18 16 (1.93%) Transformation Manager
Libraries, Frameworks & Software Standards
1 18 (2.17%) .NET
2 17 (2.05%) AngularJS
3 12 (1.45%) HTML
3 12 (1.45%) RESTful
4 10 (1.20%) REST
5 9 (1.08%) .NET Framework
5 9 (1.08%) Entity Framework
5 9 (1.08%) NHibernate
5 9 (1.08%) Playwright
6 8 (0.96%) React
7 7 (0.84%) CSS
8 6 (0.72%) Middleware
9 5 (0.60%) Elastic Stack
9 5 (0.60%) FIX Protocol
9 5 (0.60%) LangChain
9 5 (0.60%) Oracle Fusion
10 4 (0.48%) Jest
10 4 (0.48%) Spring
10 4 (0.48%) Web Services
10 4 (0.48%) XML
Miscellaneous
1 38 (4.58%) Management Information System
2 34 (4.10%) Onboarding
3 24 (2.89%) Data Protection Act
4 22 (2.65%) PMI
4 22 (2.65%) Product Ownership
5 17 (2.05%) Self-Motivation
6 16 (1.93%) Data Centre
7 15 (1.81%) Analytical Mindset
7 15 (1.81%) Legacy Systems
8 14 (1.69%) Reinsurance
9 13 (1.57%) Market Risk
9 13 (1.57%) Social Media
10 12 (1.45%) Credit Risk
10 12 (1.45%) Digital Media
11 11 (1.33%) Enterprise Software
12 10 (1.20%) Fixed Income
12 10 (1.20%) Foreign Exchange (FX)
13 9 (1.08%) Derivative
13 9 (1.08%) Virtual Team
14 8 (0.96%) Cloud Native
Operating Systems
1 23 (2.77%) Windows
2 18 (2.17%) Linux
3 5 (0.60%) Red Hat Enterprise Linux
3 5 (0.60%) Unix
3 5 (0.60%) Windows 10
4 3 (0.36%) Apple iOS
5 1 (0.12%) Android
5 1 (0.12%) Mac OS
5 1 (0.12%) VMS
5 1 (0.12%) Windows Server
Processes & Methodologies
1 319 (38.43%) Agile
2 256 (30.84%) Stakeholder Management
3 198 (23.86%) Problem-Solving
4 177 (21.33%) Project Delivery
5 137 (16.51%) Stakeholder Engagement
6 129 (15.54%) Change Management
7 128 (15.42%) PRINCE2
8 127 (15.30%) Risk Management
9 105 (12.65%) Migration
10 96 (11.57%) Scrum
11 85 (10.24%) Continuous Improvement
12 83 (10.00%) Waterfall
13 70 (8.43%) Decision-Making
14 62 (7.47%) Data Analysis
14 62 (7.47%) Requirements Gathering
15 60 (7.23%) Business Analysis
15 60 (7.23%) Roadmaps
16 58 (6.99%) Budget Management
17 55 (6.63%) Programme Management
18 53 (6.39%) User Acceptance Testing
Programming Languages
1 62 (7.47%) SQL
2 39 (4.70%) Python
3 18 (2.17%) Java
4 14 (1.69%) C#
5 13 (1.57%) JavaScript
6 12 (1.45%) PowerShell
7 10 (1.20%) TypeScript
8 5 (0.60%) VBA
9 4 (0.48%) Apex Code
9 4 (0.48%) PL/SQL
10 3 (0.36%) Data Analysis Expressions
10 3 (0.36%) PHP
11 2 (0.24%) ABAP
11 2 (0.24%) Haskell
11 2 (0.24%) Kusto Query Language
11 2 (0.24%) VB
12 1 (0.12%) ActionScript
12 1 (0.12%) C++
12 1 (0.12%) T-SQL
12 1 (0.12%) VBScript
Qualifications
1 172 (20.72%) Degree
2 132 (15.90%) PMP
3 124 (14.94%) PMI Certification
4 61 (7.35%) Security Cleared
5 48 (5.78%) SC Cleared
6 27 (3.25%) Computer Science Degree
7 16 (1.93%) Master's Degree
8 12 (1.45%) DV Cleared
9 9 (1.08%) Microsoft Certification
10 7 (0.84%) BPSS Clearance
10 7 (0.84%) FFIEC
11 6 (0.72%) CISM
12 5 (0.60%) Azure Certification
12 5 (0.60%) CFA
12 5 (0.60%) CISSP
12 5 (0.60%) PRINCE2 Certification
13 4 (0.48%) DBS Check
13 4 (0.48%) IIBA
13 4 (0.48%) ISEB
13 4 (0.48%) MBA
Quality Assurance & Compliance
1 69 (8.31%) PMO
2 29 (3.49%) GDPR
3 26 (3.13%) QA
4 22 (2.65%) ISO/IEC 27001
5 17 (2.05%) Data Quality
5 17 (2.05%) NIST
5 17 (2.05%) Sarbanes-Oxley
6 15 (1.81%) PCI DSS
7 12 (1.45%) MiFID
8 11 (1.33%) EMIR
9 10 (1.20%) GRC
10 7 (0.84%) Accessibility
10 7 (0.84%) APQC
11 6 (0.72%) ISO 20022
12 5 (0.60%) HIPAA
13 4 (0.48%) PSD2
13 4 (0.48%) SEPA
13 4 (0.48%) SLA
14 3 (0.36%) California Consumer Privacy Act
14 3 (0.36%) ISO/IEC 15288
System Software
1 13 (1.57%) Active Directory
1 13 (1.57%) Docker
2 5 (0.60%) Virtual Machines
2 5 (0.60%) VMware Infrastructure
3 3 (0.36%) VMware ESXi
4 2 (0.24%) Virtual Desktop
4 2 (0.24%) vSphere
5 1 (0.12%) Virtual Servers
Systems Management
1 6 (0.72%) ITRS Geneos
1 6 (0.72%) Kubernetes
2 5 (0.60%) Kibana
2 5 (0.60%) logstash
3 4 (0.48%) Terraform
4 3 (0.36%) Functional Safety
4 3 (0.36%) Microsoft Intune
5 2 (0.24%) HP ALM
5 2 (0.24%) Systems Management Server (SMS)
6 1 (0.12%) Argo
6 1 (0.12%) CASB
6 1 (0.12%) Cisco UCCE
6 1 (0.12%) Cisco UCCX
6 1 (0.12%) Puppet
6 1 (0.12%) QRadar
6 1 (0.12%) RSA Archer
6 1 (0.12%) SCCM
6 1 (0.12%) Single Sign-On
6 1 (0.12%) WSUS
6 1 (0.12%) ZABBIX
Vendors
1 143 (17.23%) Microsoft
2 73 (8.80%) SAP
3 41 (4.94%) Salesforce
4 31 (3.73%) Oracle
5 26 (3.13%) Google
6 24 (2.89%) ServiceNow
7 16 (1.93%) Adobe
8 12 (1.45%) Databricks
9 9 (1.08%) Planview
9 9 (1.08%) VMware
10 8 (0.96%) Cisco
10 8 (0.96%) Workday
11 7 (0.84%) Atlassian
12 6 (0.72%) Alteryx
12 6 (0.72%) Charles River
13 5 (0.60%) Arista
13 5 (0.60%) Solace
14 4 (0.48%) CA Agile Central
14 4 (0.48%) Cvent
14 4 (0.48%) Guidewire