SAP Contracts in London

SAP
England > London

The table below provides summary statistics for contract job vacancies advertised in London requiring knowledge or experience of SAP products and/or services. It includes a benchmarking guide to contractor rates offered in vacancies that cited SAP over the 6 months leading up to 30 April 2025, comparing them to the same period in the previous two years.

The figures below represent the IT contractor job market in general and are not representative of contractor rates within SAP SE.

6 months to
30 Apr 2025
Same period 2024 Same period 2023
Rank 39 42 69
Rank change year-on-year +3 +27 +13
Contract jobs citing SAP 677 824 930
As % of all contract jobs advertised in London 5.39% 4.62% 3.44%
As % of the Vendors category 11.88% 11.38% 8.85%
Number of daily rates quoted 390 470 540
10th Percentile £400 £410 £425
25th Percentile £500 £475 £498
Median daily rate (50th Percentile) £600 £578 £552
Median % change year-on-year +3.90% +4.62% -4.00%
75th Percentile £700 £717 £680
90th Percentile £838 £875 £825
England median daily rate £550 £550 £550
Number of hourly rates quoted 8 8 4
10th Percentile £33.55 £23.75 £16.13
25th Percentile £48.90 £27.32 £17.81
Median hourly rate £63.75 £61.50 £19.50
Median % change year-on-year +3.66% +215.38% -68.80%
75th Percentile £74.69 £86.50 £32.69
90th Percentile £80.13 £88.68 £55.08
England median hourly rate £60.00 £26.03 £45.00
% change year-on-year +130.50% -42.16% +62.51%

All Vendors
London

SAP falls under the Vendor Products and Services category. For comparison with the information above, the following table provides summary statistics for all contract job vacancies requiring knowledge or experience of all vendor products and services in London.

Contract vacancies with a requirement for knowledge or experience of vendor products and services 5,697 7,239 10,511
As % of all contract IT jobs advertised in London 45.38% 40.57% 38.88%
Number of daily rates quoted 3,739 4,965 7,443
10th Percentile £325 £300 £325
25th Percentile £425 £425 £450
Median daily rate (50th Percentile) £548 £550 £563
Median % change year-on-year -0.45% -2.22% +2.27%
75th Percentile £653 £661 £688
90th Percentile £775 £775 £798
England median daily rate £525 £520 £538
% change year-on-year +0.96% -3.26% +2.38%
Number of hourly rates quoted 93 137 127
10th Percentile £15.97 £13.86 £16.28
25th Percentile £22.27 £17.00 £21.00
Median hourly rate £29.00 £23.80 £30.75
Median % change year-on-year +21.85% -22.60% -12.14%
75th Percentile £51.25 £36.00 £57.00
90th Percentile £67.00 £62.25 £70.00
England median hourly rate £27.13 £22.50 £39.55
% change year-on-year +20.56% -43.11% +88.33%

SAP
Job Vacancy Trend in London

Job postings citing SAP as a proportion of all IT jobs advertised in London.
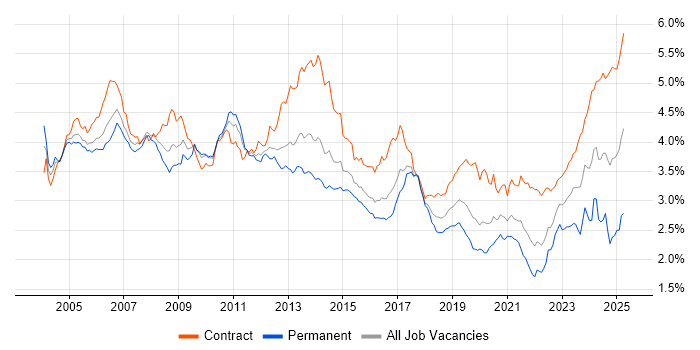
Job vacancy trend for SAP in London

SAP
Contractor Daily Rate Trend in London

3-month moving average daily rate quoted in jobs citing SAP in London.

Daily rate trend for SAP in London

SAP
Daily Rate Histogram in London

Daily rate distribution for jobs citing SAP in London over the 6 months to 30 April 2025.

Daily rate histogram for SAP in London

SAP
Contractor Hourly Rate Trend in London

3-month moving average hourly rates quoted in jobs citing SAP in London.

Hourly rate trend for SAP in London

SAP
Hourly Rate Histogram in London

Hourly rate distribution of jobs citing SAP in London over the 6 months to 30 April 2025.

Hourly rate histogram for SAP in London

SAP
Contract Job Locations in London

The table below looks at the demand and provides a guide to the median contractor rates quoted in IT jobs citing SAP within the London region over the 6 months to 30 April 2025. The 'Rank Change' column provides an indication of the change in demand within each location based on the same 6 month period last year.

Location Rank Change
on Same Period
Last Year
Matching
Contract
IT Job Ads
Median
Daily Rate
Past 6 Months
Median Daily Rate
% Change
on Same Period
Last Year
Live
Jobs
Central London +2 91 £550 -5.38% 34
South London +11 10 £495 -26.67% 1
West London -4 9 £625 -0.16% 10
East London +11 4 £563 +4.17% 5
North London 0 4 £418 +33.60%
SAP
England

SAP
Co-occurring Skills and Capabilities in London by Category

The follow tables expand on the table above by listing co-occurrences grouped by category. The same employment type, locality and period is covered with up to 20 co-occurrences shown in each of the following categories:

Application Platforms
1 6 (0.89%) NetWeaver
2 5 (0.74%) SharePoint
3 4 (0.59%) Confluence
4 3 (0.44%) MTS
5 2 (0.30%) Microsoft Exchange
6 1 (0.15%) Adobe Experience Manager
6 1 (0.15%) Apache Airflow
6 1 (0.15%) BizTalk Server
6 1 (0.15%) CMS
6 1 (0.15%) Oracle SOA Suite
6 1 (0.15%) SAS
6 1 (0.15%) WinCC
Applications
1 26 (3.84%) Microsoft Excel
2 19 (2.81%) Microsoft Office
3 9 (1.33%) Microsoft PowerPoint
3 9 (1.33%) Microsoft Project
4 5 (0.74%) MS Visio
5 2 (0.30%) Adobe After Effects
5 2 (0.30%) Adobe Creative Suite
5 2 (0.30%) Blender
5 2 (0.30%) Chatbot
5 2 (0.30%) CINEMA 4D
5 2 (0.30%) Final Cut Pro
6 1 (0.15%) AutoCAD
6 1 (0.15%) InVision
6 1 (0.15%) PTC Creo
6 1 (0.15%) Siemens NX
6 1 (0.15%) Sketch
6 1 (0.15%) Spreadsheet
Business Applications
1 221 (32.64%) SAP S/4HANA
2 35 (5.17%) SAP FI
3 29 (4.28%) SAP CO
3 29 (4.28%) SAP MDG
4 26 (3.84%) SAP FI/CO
5 21 (3.10%) Shopify
6 17 (2.51%) SAP PP
7 16 (2.36%) SAP ERP
7 16 (2.36%) SAP PS
8 13 (1.92%) SAP Retail
8 13 (1.92%) SAP SD
9 12 (1.77%) SAP HCM
9 12 (1.77%) SAP MM
10 11 (1.62%) SAP EWM
10 11 (1.62%) SAP QM
11 10 (1.48%) SAP IBP
12 8 (1.18%) SAP CAR
12 8 (1.18%) SAP GRC
12 8 (1.18%) SAP GTS
12 8 (1.18%) SAP PM
Cloud Services
1 47 (6.94%) SuccessFactors
2 44 (6.50%) Azure
3 39 (5.76%) Power Platform
4 19 (2.81%) BigCommerce
5 14 (2.07%) SaaS
6 10 (1.48%) AWS
7 9 (1.33%) Azure DevOps
8 8 (1.18%) GCP
8 8 (1.18%) Microsoft 365
9 7 (1.03%) Snowflake
10 6 (0.89%) GitHub
11 5 (0.74%) IBM Blueworks
11 5 (0.74%) Salesforce Commerce Cloud
12 4 (0.59%) Figma
12 4 (0.59%) GitHub Actions
12 4 (0.59%) IaaS
12 4 (0.59%) PaaS
12 4 (0.59%) SAP Commerce Cloud
13 3 (0.44%) Azure Data Factory
13 3 (0.44%) PowerApps
Communications & Networking
1 8 (1.18%) Firewall
2 5 (0.74%) VPN
3 4 (0.59%) Network Security
3 4 (0.59%) SSL
4 3 (0.44%) DNS
4 3 (0.44%) Intranet
5 2 (0.30%) BGP
5 2 (0.30%) DHCP
5 2 (0.30%) DSL
5 2 (0.30%) EIGRP
5 2 (0.30%) HTTP
5 2 (0.30%) Internet
5 2 (0.30%) LAN
5 2 (0.30%) NAS
5 2 (0.30%) OSPF
5 2 (0.30%) SAN
5 2 (0.30%) SMS
5 2 (0.30%) VoIP
5 2 (0.30%) WAN
5 2 (0.30%) Wireless
Database & Business Intelligence
1 38 (5.61%) Power BI
2 25 (3.69%) SAP HANA
3 22 (3.25%) Relational Database
4 20 (2.95%) BusinessObjects
5 19 (2.81%) SAP BW
6 15 (2.22%) SAP Data Services
7 14 (2.07%) Data Warehouse
8 13 (1.92%) PostgreSQL
9 9 (1.33%) NoSQL
9 9 (1.33%) SQL Server
9 9 (1.33%) Tableau
10 6 (0.89%) BusinessObjects Business Intelligence
10 6 (0.89%) Data Lake
10 6 (0.89%) Qlik Sense
11 5 (0.74%) Big Data
11 5 (0.74%) Metadata
11 5 (0.74%) Snowflake Schema
11 5 (0.74%) Spotfire
12 4 (0.59%) MS Access
12 4 (0.59%) OLTP
Development Applications
1 16 (2.36%) Jenkins
2 15 (2.22%) JIRA
3 14 (2.07%) Liquibase
4 13 (1.92%) GitLab
5 12 (1.77%) Gradle
6 11 (1.62%) JUnit
6 11 (1.62%) Mockito
7 5 (0.74%) Git
8 4 (0.59%) JMeter
9 3 (0.44%) LSMW
9 3 (0.44%) Selenium
10 2 (0.30%) Bitbucket
10 2 (0.30%) CircleCI
10 2 (0.30%) Cypress.io
10 2 (0.30%) ERwin
10 2 (0.30%) Grunt
10 2 (0.30%) Postman
10 2 (0.30%) Terragrunt
10 2 (0.30%) webpack
10 2 (0.30%) Zephyr
General
1 250 (36.93%) Finance
2 207 (30.58%) Social Skills
3 85 (12.56%) Manufacturing
3 85 (12.56%) Retail
4 71 (10.49%) Public Sector
5 69 (10.19%) Analytical Skills
6 60 (8.86%) Marketing
7 53 (7.83%) Telecoms
8 50 (7.39%) Electronics
9 43 (6.35%) Pharmaceutical
10 27 (3.99%) Presentation Skills
11 24 (3.55%) Banking
12 21 (3.10%) Legal
13 13 (1.92%) General Ledger
14 12 (1.77%) Influencing Skills
15 11 (1.62%) Aerospace
15 11 (1.62%) Organisational Skills
16 9 (1.33%) Billing
16 9 (1.33%) Inclusion and Diversity
16 9 (1.33%) Law
Job Titles
1 166 (24.52%) Consultant
2 143 (21.12%) SAP Consultant
3 96 (14.18%) Lead
4 80 (11.82%) Architect
5 73 (10.78%) Analyst
6 47 (6.94%) SAP Manager
7 42 (6.20%) Project Manager
7 42 (6.20%) Senior
8 41 (6.06%) Business Analyst
8 41 (6.06%) SAP Analyst
9 40 (5.91%) SAP Architect
10 34 (5.02%) Solutions Architect
11 30 (4.43%) Developer
12 21 (3.10%) SAP Business Analyst
13 19 (2.81%) SAP Project Manager
14 16 (2.36%) SAP CO Consultant
14 16 (2.36%) SAP S/4HANA Consultant
15 15 (2.22%) SAP FI Consultant
16 14 (2.07%) Delivery Manager
16 14 (2.07%) SAP FI/CO Consultant
Libraries, Frameworks & Software Standards
1 26 (3.84%) SAP Fiori
2 19 (2.81%) VML
2 19 (2.81%) Web Services
3 16 (2.36%) Kafka
4 15 (2.22%) REST
5 14 (2.07%) React
5 14 (2.07%) SOAP
6 12 (1.77%) Spring
7 11 (1.62%) OpenAPI
7 11 (1.62%) Spring Boot
7 11 (1.62%) Swagger
8 10 (1.48%) .NET
9 8 (1.18%) BAPI
9 8 (1.18%) SailPoint
9 8 (1.18%) SAPUI5
9 8 (1.18%) XML
10 6 (0.89%) CSS
10 6 (0.89%) LDAP
10 6 (0.89%) SAML
10 6 (0.89%) SAP PI
Miscellaneous
1 27 (3.99%) Greenfield Project
1 27 (3.99%) Onboarding
2 19 (2.81%) Legacy Systems
3 18 (2.66%) Public Cloud
4 15 (2.22%) Data Structures
4 15 (2.22%) Management Information System
5 11 (1.62%) Life Science
6 10 (1.48%) Enterprise Software
6 10 (1.48%) FMCG
6 10 (1.48%) Self-Motivation
6 10 (1.48%) Virtual Team
7 9 (1.33%) Data Protection Act
8 8 (1.18%) Reference Data
9 7 (1.03%) LIMS
9 7 (1.03%) Private Cloud
9 7 (1.03%) Product Ownership
10 5 (0.74%) Cloud Native
10 5 (0.74%) Social Media
11 4 (0.59%) e-Learning
11 4 (0.59%) IoT
Operating Systems
1 13 (1.92%) Linux
2 11 (1.62%) Windows
3 4 (0.59%) Windows Server
4 3 (0.44%) Red Hat Enterprise Linux
4 3 (0.44%) Unix
5 2 (0.30%) SUSE
5 2 (0.30%) VMS
5 2 (0.30%) Windows 10
6 1 (0.15%) Android
6 1 (0.15%) Apple iOS
6 1 (0.15%) Solaris
Processes & Methodologies
1 116 (17.13%) Problem-Solving
2 110 (16.25%) Stakeholder Management
3 108 (15.95%) Migration
4 106 (15.66%) Agile
4 106 (15.66%) ERP
5 90 (13.29%) Business Intelligence
6 70 (10.34%) Project Management
7 68 (10.04%) Analytics
8 60 (8.86%) Programme Management
9 54 (7.98%) User Acceptance Testing
9 54 (7.98%) Workshop Facilitation
10 53 (7.83%) Data Migration
11 49 (7.24%) Digital Marketing
12 46 (6.79%) Data Modelling
12 46 (6.79%) Stakeholder Engagement
13 43 (6.35%) Change Management
14 39 (5.76%) Project Delivery
14 39 (5.76%) Requirements Gathering
14 39 (5.76%) Validation
15 38 (5.61%) Process Improvement
Programming Languages
1 55 (8.12%) SQL
2 36 (5.32%) ABAP
3 30 (4.43%) Java
4 22 (3.25%) Python
5 14 (2.07%) JavaScript
5 14 (2.07%) TypeScript
6 10 (1.48%) C#
7 9 (1.33%) PowerShell
8 5 (0.74%) Bash
9 4 (0.59%) BeanShell
10 3 (0.44%) VBA
11 2 (0.30%) Groovy
11 2 (0.30%) PHP
11 2 (0.30%) R
11 2 (0.30%) SystemVerilog
11 2 (0.30%) T-SQL
12 1 (0.15%) Bicep
12 1 (0.15%) Data Analysis Expressions
12 1 (0.15%) Kotlin
12 1 (0.15%) Kusto Query Language
Qualifications
1 60 (8.86%) Security Cleared
2 58 (8.57%) Degree
3 50 (7.39%) SC Cleared
4 20 (2.95%) SAP Certification
5 12 (1.77%) BPSS Clearance
6 10 (1.48%) PMI Certification
7 9 (1.33%) Master's Degree
7 9 (1.33%) PMP
7 9 (1.33%) TOGAF Certification
8 7 (1.03%) ACCA
8 7 (1.03%) Computer Science Degree
9 5 (0.74%) CIMA
10 4 (0.59%) Cisco Certification
11 3 (0.44%) CISSP
11 3 (0.44%) ITIL Certification
12 2 (0.30%) CCNA
12 2 (0.30%) CCNP
12 2 (0.30%) CISA
12 2 (0.30%) PhD
12 2 (0.30%) PRINCE2 Certification
Quality Assurance & Compliance
1 32 (4.73%) Data Quality
2 31 (4.58%) Accessibility
3 30 (4.43%) QA
4 13 (1.92%) GDPR
4 13 (1.92%) Sarbanes-Oxley
5 11 (1.62%) IFRS
6 10 (1.48%) GRC
6 10 (1.48%) PMO
7 7 (1.03%) IFRS 9
8 3 (0.44%) GAAP
8 3 (0.44%) ISO/IEC 27001
8 3 (0.44%) ITGC
9 2 (0.30%) DICOM
9 2 (0.30%) HL7
9 2 (0.30%) NIST
9 2 (0.30%) PCI DSS
9 2 (0.30%) SOX 404
9 2 (0.30%) WCAG
10 1 (0.15%) California Consumer Privacy Act
10 1 (0.15%) HIPAA
System Software
1 13 (1.92%) Docker
2 11 (1.62%) Active Directory
3 7 (1.03%) IAG
4 2 (0.30%) Firmware
5 1 (0.15%) Oracle RAC
5 1 (0.15%) Virtual Machines
5 1 (0.15%) VMware ESXi
5 1 (0.15%) VMware Infrastructure
Systems Management
1 8 (1.18%) Terraform
2 6 (0.89%) Single Sign-On
3 5 (0.74%) Kubernetes
4 4 (0.59%) Ansible
4 4 (0.59%) HP ALM
5 2 (0.30%) Argo
5 2 (0.30%) Microsoft Intune
5 2 (0.30%) Progress Chef
5 2 (0.30%) Puppet
5 2 (0.30%) Salt
6 1 (0.15%) Control-M
6 1 (0.15%) Data Guard
6 1 (0.15%) EMC NetWorker
6 1 (0.15%) Enterprise Manager Cloud Control
6 1 (0.15%) Functional Safety
6 1 (0.15%) QRadar
6 1 (0.15%) Systems Management Server (SMS)
6 1 (0.15%) Tivoli
6 1 (0.15%) Tivoli Storage Manager
6 1 (0.15%) VxRail
Vendors
1 73 (10.78%) Ariba
2 66 (9.75%) Microsoft
3 60 (8.86%) Oracle
4 52 (7.68%) Salesforce
5 23 (3.40%) Adobe
6 19 (2.81%) Sitecore
6 19 (2.81%) Workday
7 17 (2.51%) ServiceNow
8 11 (1.62%) Databricks
9 8 (1.18%) Concur
9 8 (1.18%) OpenText
10 6 (0.89%) Qualtrics
11 5 (0.74%) BiZZdesign
11 5 (0.74%) CyberArk
11 5 (0.74%) Google
11 5 (0.74%) Informatica
11 5 (0.74%) Siemens
12 4 (0.59%) HP
12 4 (0.59%) Splunk
12 4 (0.59%) Talend