Middleware Contracts in London

Middleware
England > London

The table below provides summary statistics for contract job vacancies advertised in London requiring Middleware skills. It includes a benchmarking guide to the contractor rates offered in vacancies that cited Middleware over the 6 months leading up to 1 July 2025, comparing them to the same period in the previous two years.

6 months to
1 Jul 2025
Same period 2024 Same period 2023
Rank 241 255 250
Rank change year-on-year +14 -5 +26
Contract jobs citing Middleware 113 147 251
As % of all contract jobs advertised in London 0.88% 0.84% 0.99%
As % of the Libraries, Frameworks & Software Standards category 3.33% 3.13% 3.73%
Number of daily rates quoted 79 102 186
10th Percentile £401 £406 £444
25th Percentile £440 £488 £550
Median daily rate (50th Percentile) £600 £625 £625
Median % change year-on-year -4.00% - +1.63%
75th Percentile £725 £750 £733
90th Percentile £778 £873 £835
England median daily rate £550 £600 £575
% change year-on-year -8.33% +4.35% -2.54%
Number of hourly rates quoted 0 1 1
Median hourly rate - £70.00 £75.00
Median % change year-on-year - -6.67% -
England median hourly rate £67.75 £71.25 £65.00
% change year-on-year -4.91% +9.62% +18.18%

All Software Libraries and Frameworks
London

Middleware falls under the Software Libraries and Frameworks category. For comparison with the information above, the following table provides summary statistics for all contract job vacancies requiring technical specification, industry standards, software libraries and framework skills in London.

Contract vacancies with a requirement for technical specification, industry standards, software libraries and framework skills 3,392 4,689 6,729
As % of all contract IT jobs advertised in London 26.30% 26.83% 26.60%
Number of daily rates quoted 2,366 3,451 5,061
10th Percentile £376 £375 £413
25th Percentile £429 £461 £488
Median daily rate (50th Percentile) £550 £575 £600
Median % change year-on-year -4.35% -4.17% -
75th Percentile £713 £711 £725
90th Percentile £825 £850 £813
England median daily rate £525 £550 £550
% change year-on-year -4.55% - -4.35%
Number of hourly rates quoted 21 28 42
10th Percentile - £16.25 £31.18
25th Percentile £33.25 £23.80 £47.50
Median hourly rate £45.00 £42.50 £67.25
Median % change year-on-year +5.88% -36.80% +41.58%
75th Percentile £62.50 £61.70 £75.00
90th Percentile £87.50 £75.00 £86.20
England median hourly rate £60.00 £58.15 £65.00
% change year-on-year +3.18% -10.54% +23.81%

Middleware
Job Vacancy Trend in London

Job postings citing Middleware as a proportion of all IT jobs advertised in London.
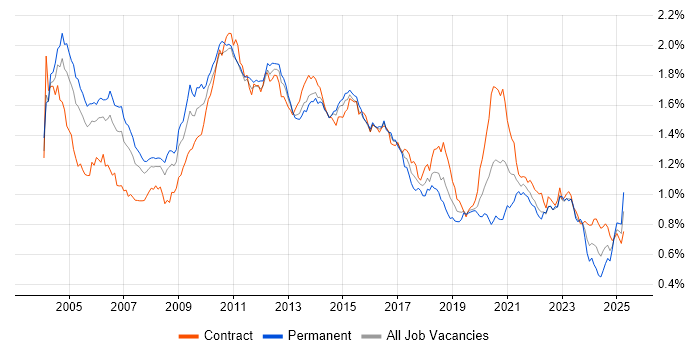
Job vacancy trend for Middleware in London

Middleware
Contractor Daily Rate Trend in London

3-month moving average daily rate quoted in jobs citing Middleware in London.

Daily rate trend for Middleware in London

Middleware
Daily Rate Histogram in London

Daily rate distribution for jobs citing Middleware in London over the 6 months to 1 July 2025.

Daily rate histogram for Middleware in London

Middleware
Contractor Hourly Rate Trend in London

3-month moving average hourly rates quoted in jobs citing Middleware in London.

Hourly rate trend for Middleware in London

Middleware
Contract Job Locations in London

The table below looks at the demand and provides a guide to the median contractor rates quoted in IT jobs citing Middleware within the London region over the 6 months to 1 July 2025. The 'Rank Change' column provides an indication of the change in demand within each location based on the same 6 month period last year.

Location Rank Change
on Same Period
Last Year
Matching
Contract
IT Job Ads
Median
Daily Rate
Past 6 Months
Median Daily Rate
% Change
on Same Period
Last Year
Live
Jobs
Central London +1 19 £601 -0.74% 38
South London - 11 £675 - 11
East London +15 3 £415 -18.60% 17
North London - 1 - -
Middleware
England

Middleware
Co-occurring Skills and Capabilities in London by Category

The follow tables expand on the table above by listing co-occurrences grouped by category. The same employment type, locality and period is covered with up to 20 co-occurrences shown in each of the following categories:

Application Platforms
1 6 (5.31%) JBoss
2 5 (4.42%) WebSphere
3 4 (3.54%) Oracle SOA Suite
4 3 (2.65%) Anypoint
4 3 (2.65%) Apache
5 2 (1.77%) CICS
5 2 (1.77%) Confluence
5 2 (1.77%) MQSeries
5 2 (1.77%) WebSphere Application Server
6 1 (0.88%) Apache Spark
6 1 (0.88%) Microsoft Exchange
6 1 (0.88%) NetWeaver
6 1 (0.88%) nginx
6 1 (0.88%) SAS
Applications
1 4 (3.54%) Microsoft Project
2 3 (2.65%) MS Visio
3 2 (1.77%) Microsoft Office
Business Applications
1 5 (4.42%) SAP S/4HANA
2 4 (3.54%) Oracle EBS
3 3 (2.65%) Dynamics CRM
3 3 (2.65%) Magento
3 3 (2.65%) Oracle 11i
3 3 (2.65%) Oracle Procure-to-Pay
4 2 (1.77%) Oracle Cash Management
4 2 (1.77%) Oracle Payables
4 2 (1.77%) Oracle Receivables
4 2 (1.77%) Oracle Retail
4 2 (1.77%) Oracle Subledger Accounting
4 2 (1.77%) SAP CX
4 2 (1.77%) Shopify
5 1 (0.88%) Oracle Assets
5 1 (0.88%) Oracle EBS R12
5 1 (0.88%) Oracle Financials
5 1 (0.88%) Oracle General Ledger
5 1 (0.88%) SAP Convergent Charging
5 1 (0.88%) SAP FSCM
5 1 (0.88%) SAP Hybris
Cloud Services
1 32 (28.32%) Azure
2 15 (13.27%) AWS
3 9 (7.96%) Azure API Management
3 9 (7.96%) GCP
3 9 (7.96%) Power Platform
4 8 (7.08%) Dynamics 365
5 7 (6.19%) SaaS
6 6 (5.31%) Boomi
6 6 (5.31%) Salesforce Sales Cloud
7 5 (4.42%) Azure DevOps
7 5 (4.42%) Azure Functions
7 5 (4.42%) Cloud Computing
7 5 (4.42%) GitHub
7 5 (4.42%) Serverless
8 4 (3.54%) Azure Data Factory
8 4 (3.54%) IaaS
8 4 (3.54%) PaaS
8 4 (3.54%) PowerApps
9 3 (2.65%) Entra ID
9 3 (2.65%) Salesforce Service Cloud
Communications & Networking
1 6 (5.31%) HTTP
1 6 (5.31%) TCP/IP
2 4 (3.54%) Multicast
3 3 (2.65%) LAN
3 3 (2.65%) SSL
3 3 (2.65%) WAN
4 2 (1.77%) HTTPS
5 1 (0.88%) FTP
5 1 (0.88%) Network Security
5 1 (0.88%) SAN
5 1 (0.88%) SWIFTNet
Database & Business Intelligence
1 6 (5.31%) KDB
1 6 (5.31%) NoSQL
1 6 (5.31%) Oracle Database
2 4 (3.54%) MS Access
2 4 (3.54%) SQL Server
2 4 (3.54%) SQL Server Reporting Services
3 3 (2.65%) Oracle Database 10g
3 3 (2.65%) RDBMS
3 3 (2.65%) Relational Database
4 2 (1.77%) Azure SQL Database
4 2 (1.77%) Big Data
4 2 (1.77%) DB2
4 2 (1.77%) Electronic Patient Records
4 2 (1.77%) IMS/DB
4 2 (1.77%) MemSQL
4 2 (1.77%) MongoDB
4 2 (1.77%) Power BI
5 1 (0.88%) Data Mart
5 1 (0.88%) MySQL
5 1 (0.88%) PostgreSQL
Development Applications
1 12 (10.62%) JIRA
2 6 (5.31%) Ant
2 6 (5.31%) Git
2 6 (5.31%) Jenkins
3 4 (3.54%) GCC
3 4 (3.54%) GDB
3 4 (3.54%) QARun
3 4 (3.54%) WinRunner
4 3 (2.65%) JUnit
4 3 (2.65%) SoapUI
4 3 (2.65%) Sonatype Nexus
4 3 (2.65%) Toad
5 2 (1.77%) Artifactory
5 2 (1.77%) Eclipse
5 2 (1.77%) IntelliJ
5 2 (1.77%) Maven
5 2 (1.77%) Postman
6 1 (0.88%) Bitbucket Server
6 1 (0.88%) ESLint
6 1 (0.88%) Subversion
General
1 51 (45.13%) Finance
2 45 (39.82%) Social Skills
3 24 (21.24%) Banking
4 19 (16.81%) Analytical Skills
5 15 (13.27%) Front Office
6 9 (7.96%) Retail
7 6 (5.31%) Financial Institution
8 5 (4.42%) International Banking
8 5 (4.42%) Investment Banking
8 5 (4.42%) Public Sector
9 4 (3.54%) Law
9 4 (3.54%) Marketing
10 3 (2.65%) General Ledger
10 3 (2.65%) Influencing Skills
11 2 (1.77%) Billing
11 2 (1.77%) Police
11 2 (1.77%) Presentation Skills
12 1 (0.88%) Back Office
12 1 (0.88%) Legal
12 1 (0.88%) Telecoms
Job Titles
1 42 (37.17%) Developer
2 31 (27.43%) Architect
3 16 (14.16%) Senior
4 11 (9.73%) Solutions Architect
5 10 (8.85%) Consultant
6 9 (7.96%) Azure Architect
6 9 (7.96%) Java Developer
7 7 (6.19%) Lead
7 7 (6.19%) Senior Developer
7 7 (6.19%) Technical Architect
8 6 (5.31%) Integration Developer
9 5 (4.42%) Designer
9 5 (4.42%) Dynamics 365 Developer
9 5 (4.42%) Oracle Consultant
9 5 (4.42%) Payroll Consultant
9 5 (4.42%) Python Developer
9 5 (4.42%) Solutions Designer
10 4 (3.54%) Senior Java Developer
10 4 (3.54%) Senior Test Analyst
10 4 (3.54%) UAT Analyst
Libraries, Frameworks & Software Standards
1 19 (16.81%) SOAP
2 18 (15.93%) REST
3 15 (13.27%) Web Services
4 14 (12.39%) Kafka
5 13 (11.50%) XML
6 11 (9.73%) FIX Protocol
7 10 (8.85%) Oracle Fusion
8 7 (6.19%) EDI
9 6 (5.31%) AngularJS
10 5 (4.42%) FpML
10 5 (4.42%) HTML
10 5 (4.42%) Lightning Web Components
10 5 (4.42%) RESTful
11 4 (3.54%) .NET
11 4 (3.54%) Boost C++ Libraries
11 4 (3.54%) IBM Integration Bus
11 4 (3.54%) STL
12 3 (2.65%) Elastic Stack
12 3 (2.65%) React
12 3 (2.65%) SAP PI
Miscellaneous
1 21 (18.58%) Foreign Exchange (FX)
2 10 (8.85%) Data Structures
3 8 (7.08%) Fixed Income
4 7 (6.19%) Algorithms
4 7 (6.19%) Derivative
4 7 (6.19%) Distributed Architecture
5 6 (5.31%) Enterprise Software
6 5 (4.42%) Management Information System
7 4 (3.54%) Equities
7 4 (3.54%) SWIFT Messaging Network
8 3 (2.65%) Distributed Applications
8 3 (2.65%) Distributed Systems
8 3 (2.65%) Legacy Applications
8 3 (2.65%) Mainframe
8 3 (2.65%) Product Ownership
8 3 (2.65%) Public Cloud
8 3 (2.65%) Virtual Team
9 2 (1.77%) NHS
9 2 (1.77%) Onboarding
9 2 (1.77%) Self-Motivation
Operating Systems
1 26 (23.01%) Linux
2 22 (19.47%) Unix
3 18 (15.93%) Windows
4 4 (3.54%) AIX
5 3 (2.65%) Red Hat Enterprise Linux
6 2 (1.77%) CentOS
6 2 (1.77%) Ubuntu
7 1 (0.88%) VMS
7 1 (0.88%) Windows Server
Processes & Methodologies
1 35 (30.97%) Agile
2 31 (27.43%) Problem-Solving
3 24 (21.24%) DevOps
4 17 (15.04%) High Availability
5 15 (13.27%) CI/CD
5 15 (13.27%) Computer Science
6 13 (11.50%) Microservices
7 12 (10.62%) Low Latency
7 12 (10.62%) Migration
8 11 (9.73%) Stakeholder Management
8 11 (9.73%) Waterfall
9 10 (8.85%) API Management
9 10 (8.85%) ERP
9 10 (8.85%) Scrum
9 10 (8.85%) SDLC
9 10 (8.85%) Technical Leadership
10 9 (7.96%) Design Patterns
10 9 (7.96%) ETL
10 9 (7.96%) Translating Business Requirements
10 9 (7.96%) User Acceptance Testing
Programming Languages
1 32 (28.32%) SQL
2 24 (21.24%) Java
3 18 (15.93%) Python
4 11 (9.73%) C++
4 11 (9.73%) PL/SQL
5 8 (7.08%) C#
5 8 (7.08%) JavaScript
6 6 (5.31%) TypeScript
7 5 (4.42%) Apex Code
7 5 (4.42%) Perl
7 5 (4.42%) Shell Script
8 4 (3.54%) Bash
8 4 (3.54%) Korn
9 3 (2.65%) Groovy
10 2 (1.77%) ABAP
10 2 (1.77%) ActionScript
10 2 (1.77%) ActionScript 2.0
10 2 (1.77%) REXX
11 1 (0.88%) Ruby
11 1 (0.88%) VBScript
Qualifications
1 18 (15.93%) Degree
2 13 (11.50%) Security Cleared
3 11 (9.73%) SC Cleared
4 10 (8.85%) Computer Science Degree
5 3 (2.65%) Azure Certification
6 1 (0.88%) DV Cleared
6 1 (0.88%) IBM Certification
6 1 (0.88%) ITIL Certification
6 1 (0.88%) PMI Certification
6 1 (0.88%) PMP
Quality Assurance & Compliance
1 9 (7.96%) QA
2 7 (6.19%) GDPR
3 3 (2.65%) GAAP
3 3 (2.65%) ISO/IEC 27001
3 3 (2.65%) SEPA
4 2 (1.77%) HIPAA
4 2 (1.77%) HL7
4 2 (1.77%) ISO 20022
4 2 (1.77%) PCI DSS
5 1 (0.88%) Accessibility
5 1 (0.88%) Data Quality
5 1 (0.88%) IFRS
5 1 (0.88%) MiFID
System Software
1 6 (5.31%) Active Directory
2 4 (3.54%) Docker
2 4 (3.54%) Virtual Machines
3 3 (2.65%) vSphere
4 1 (0.88%) VMware Infrastructure
Systems Management
1 9 (7.96%) Kubernetes
2 4 (3.54%) Ansible
3 3 (2.65%) Podman
4 2 (1.77%) Control-M
4 2 (1.77%) Prometheus
4 2 (1.77%) Puppet
4 2 (1.77%) Terraform
5 1 (0.88%) Argo
5 1 (0.88%) Microsoft Intune
5 1 (0.88%) Single Sign-On
5 1 (0.88%) vRealize
5 1 (0.88%) VxRail
Vendors
1 24 (21.24%) Oracle
2 15 (13.27%) IBM
2 15 (13.27%) Microsoft
3 14 (12.39%) Salesforce
4 13 (11.50%) MuleSoft
5 10 (8.85%) SAP
6 6 (5.31%) Google
7 5 (4.42%) Citrix
7 5 (4.42%) Databricks
7 5 (4.42%) ServiceNow
8 4 (3.54%) Solace
8 4 (3.54%) VMware
9 3 (2.65%) Adobe
9 3 (2.65%) Dell
9 3 (2.65%) Perforce
9 3 (2.65%) TIBCO
9 3 (2.65%) webMethods
10 2 (1.77%) Cerner
10 2 (1.77%) Informatica
10 2 (1.77%) NCR