Foreign Exchange (FX) Contracts in London

Foreign Exchange (FX)
England > London

The table below looks at the prevalence of the term Foreign Exchange (FX) in contract job vacancies in London. Included is a benchmarking guide to the contractor rates offered in vacancies that cited Foreign Exchange (FX) over the 6 months leading up to 1 May 2025, comparing them to the same period in the previous two years.

6 months to
1 May 2025
Same period 2024 Same period 2023
Rank 92 132 96
Rank change year-on-year +40 -36 +23
Contract jobs citing Foreign Exchange (FX) 380 323 700
As % of all contract jobs advertised in London 3.03% 1.81% 2.59%
As % of the Miscellaneous category 8.41% 5.47% 7.22%
Number of daily rates quoted 323 269 574
10th Percentile £627 £570 £550
25th Percentile £675 £663 £638
Median daily rate (50th Percentile) £775 £800 £750
Median % change year-on-year -3.13% +6.67% +3.45%
75th Percentile £875 £888 £860
90th Percentile £938 - £950
England median daily rate £775 £775 £750
% change year-on-year - +3.33% +3.45%
Number of hourly rates quoted 0 0 1
Median hourly rate - - £64.25
England median hourly rate £41.00 £70.00 £64.25
% change year-on-year -41.43% +8.95% -

All Generic Skills
London

Foreign Exchange (FX) falls under the General and Transferable Skills category. For comparison with the information above, the following table provides summary statistics for all contract job vacancies requiring generic IT skills in London.

Contract vacancies with a requirement for generic IT skills 4,516 5,909 9,701
As % of all contract IT jobs advertised in London 35.99% 33.14% 35.89%
Number of daily rates quoted 3,054 4,182 6,966
10th Percentile £325 £301 £375
25th Percentile £451 £450 £500
Median daily rate (50th Percentile) £575 £583 £600
Median % change year-on-year -1.29% -2.92% -
75th Percentile £738 £725 £750
90th Percentile £850 £850 £838
England median daily rate £548 £550 £575
% change year-on-year -0.36% -4.35% +4.55%
Number of hourly rates quoted 74 160 109
10th Percentile £15.84 £15.50 £18.93
25th Percentile £22.60 £18.93 £21.24
Median hourly rate £34.50 £26.00 £35.00
Median % change year-on-year +32.69% -25.71% -21.35%
75th Percentile £50.31 £47.81 £64.50
90th Percentile £80.05 £66.78 £83.15
England median hourly rate £33.00 £30.16 £22.50
% change year-on-year +9.42% +34.04% -16.67%

Foreign Exchange (FX)
Job Vacancy Trend in London

Job postings citing Foreign Exchange (FX) as a proportion of all IT jobs advertised in London.
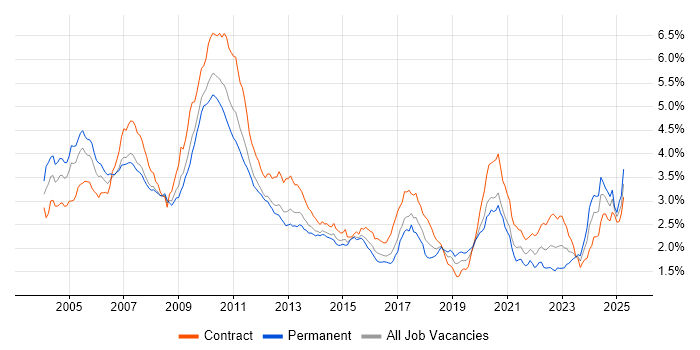
Job vacancy trend for Foreign Exchange (FX) in London

Foreign Exchange (FX)
Contractor Daily Rate Trend in London

3-month moving average daily rate quoted in jobs citing Foreign Exchange (FX) in London.

Daily rate trend for Foreign Exchange (FX) in London

Foreign Exchange (FX)
Daily Rate Histogram in London

Daily rate distribution for jobs citing Foreign Exchange (FX) in London over the 6 months to 1 May 2025.

Daily rate histogram for Foreign Exchange (FX) in London

Foreign Exchange (FX)
Contractor Hourly Rate Trend in London

3-month moving average hourly rates quoted in jobs citing Foreign Exchange (FX) in London.

Hourly rate trend for Foreign Exchange (FX) in London

Foreign Exchange (FX)
Contract Job Locations in London

The table below looks at the demand and provides a guide to the median contractor rates quoted in IT jobs citing Foreign Exchange (FX) within the London region over the 6 months to 1 May 2025. The 'Rank Change' column provides an indication of the change in demand within each location based on the same 6 month period last year.

Location Rank Change
on Same Period
Last Year
Matching
Contract
IT Job Ads
Median
Daily Rate
Past 6 Months
Median Daily Rate
% Change
on Same Period
Last Year
Live
Jobs
Central London +12 40 £700 +0.90% 25
South London +7 5 - -
Foreign Exchange (FX)
England

Foreign Exchange (FX)
Co-occurring Skills and Capabilities in London by Category

The follow tables expand on the table above by listing co-occurrences grouped by category. The same employment type, locality and period is covered with up to 20 co-occurrences shown in each of the following categories:

Application Platforms
1 55 (14.47%) Apache Airflow
2 45 (11.84%) Apache
3 3 (0.79%) SharePoint
4 2 (0.53%) Apache Spark
4 2 (0.53%) Microsoft Exchange
4 2 (0.53%) MQSeries
4 2 (0.53%) Oracle SOA Suite
5 1 (0.26%) Confluence
5 1 (0.26%) DataSynapse
5 1 (0.26%) Oracle Coherence
5 1 (0.26%) Oracle Workflow
Applications
1 8 (2.11%) Microsoft Excel
2 2 (0.53%) Adobe XD
2 2 (0.53%) Microsoft PowerPoint
2 2 (0.53%) Sketch
3 1 (0.26%) Microsoft Office
3 1 (0.26%) Microsoft Project
Business Applications
1 2 (0.53%) Fidessa
1 2 (0.53%) FLEXCUBE
1 2 (0.53%) Misys Midas
1 2 (0.53%) Oracle General Ledger
2 1 (0.26%) Oracle ERP
2 1 (0.26%) Oracle Procure-to-Pay
2 1 (0.26%) Oracle TCA
2 1 (0.26%) Orchestrade
2 1 (0.26%) SAP CO
2 1 (0.26%) SAP FI
2 1 (0.26%) SAP FI/CO
2 1 (0.26%) SAP S/4HANA
2 1 (0.26%) Summit
Cloud Services
1 81 (21.32%) AWS
2 55 (14.47%) dbt
3 45 (11.84%) Snowflake
4 41 (10.79%) GCP
5 18 (4.74%) Azure
6 17 (4.47%) Amazon EC2
6 17 (4.47%) Amazon ECS
6 17 (4.47%) Amazon EKS
6 17 (4.47%) Dagster
7 11 (2.89%) npm
7 11 (2.89%) Yarn
8 4 (1.05%) Power Platform
9 3 (0.79%) Microsoft 365
9 3 (0.79%) Power Automate
9 3 (0.79%) PowerApps
10 2 (0.53%) Copilot Studio
10 2 (0.53%) Entra ID
10 2 (0.53%) Figma
10 2 (0.53%) Microsoft Copilot
11 1 (0.26%) OCI
Communications & Networking
1 8 (2.11%) Multicast
2 4 (1.05%) Network Security
3 3 (0.79%) Firewall
4 2 (0.53%) BGP
4 2 (0.53%) IMAP
4 2 (0.53%) IOS XR
4 2 (0.53%) MPLS
4 2 (0.53%) OSPF
4 2 (0.53%) POP3
4 2 (0.53%) SMTP
4 2 (0.53%) Wireshark
5 1 (0.26%) Cisco IOS
5 1 (0.26%) DSLAM
5 1 (0.26%) FIX Connectivity
5 1 (0.26%) Remote Desktop
5 1 (0.26%) SNMP
5 1 (0.26%) SSH
5 1 (0.26%) TCP/IP
5 1 (0.26%) Telnet
Database & Business Intelligence
1 120 (31.58%) Data Lake
2 55 (14.47%) Amazon Athena
2 55 (14.47%) Apache Arrow
2 55 (14.47%) Apache Iceberg
2 55 (14.47%) Dremio
3 29 (7.63%) Apache Ignite
4 15 (3.95%) PostgreSQL
5 11 (2.89%) SQL Server
6 9 (2.37%) KDB
7 5 (1.32%) Kdb+
8 4 (1.05%) Data Mart
8 4 (1.05%) Power BI
8 4 (1.05%) Relational Database
9 3 (0.79%) RDBMS
10 2 (0.53%) Big Data
10 2 (0.53%) Data Warehouse
10 2 (0.53%) Delta Lake
10 2 (0.53%) Elasticsearch
11 1 (0.26%) Data Hub
11 1 (0.26%) Tableau
Development Applications
1 32 (8.42%) Git
2 11 (2.89%) webpack
3 7 (1.84%) Bitbucket
3 7 (1.84%) JIRA
3 7 (1.84%) TeamCity
4 5 (1.32%) Jenkins
5 4 (1.05%) GCC
5 4 (1.05%) GDB
6 2 (0.53%) Ant
6 2 (0.53%) Bitbucket Server
6 2 (0.53%) JUnit
6 2 (0.53%) Maven
7 1 (0.26%) GitLab
7 1 (0.26%) Visual Studio
General
1 312 (82.11%) Finance
2 249 (65.53%) Front Office
3 130 (34.21%) Banking
4 93 (24.47%) Investment Banking
5 91 (23.95%) Social Skills
6 65 (17.11%) Analytical Skills
7 19 (5.00%) Financial Institution
8 14 (3.68%) Back Office
9 6 (1.58%) Organisational Skills
10 4 (1.05%) French Language
11 2 (0.53%) Inclusion and Diversity
11 2 (0.53%) Law
12 1 (0.26%) Advertising
12 1 (0.26%) Corporate Banking
12 1 (0.26%) General Ledger
12 1 (0.26%) International Banking
12 1 (0.26%) Legal
12 1 (0.26%) Spanish Language
12 1 (0.26%) Telecoms
Job Titles
1 145 (38.16%) Developer
2 74 (19.47%) Software Engineer
3 69 (18.16%) Analyst
4 62 (16.32%) Senior
5 55 (14.47%) AWS Engineer
5 55 (14.47%) AWS Software Engineer
6 48 (12.63%) Business Analyst
7 40 (10.53%) Java Engineer
8 38 (10.00%) Developer/Software Engineer
8 38 (10.00%) Java Software Engineer
9 37 (9.74%) Head of Finance
10 36 (9.47%) C# Developer
10 36 (9.47%) Java Developer
11 33 (8.68%) AWS Developer
11 33 (8.68%) Python Engineer
12 31 (8.16%) C++ Developer
12 31 (8.16%) Python Software Engineer
12 31 (8.16%) Senior Developer
13 30 (7.89%) Lead
14 29 (7.63%) Product Manager
Libraries, Frameworks & Software Standards
1 57 (15.00%) React
2 48 (12.63%) NumPy
2 48 (12.63%) Pandas
3 46 (12.11%) SciPy
4 40 (10.53%) .NET
5 37 (9.74%) Protocol Buffers
6 36 (9.47%) AngularJS
6 36 (9.47%) Kafka
7 35 (9.21%) gRPC
8 33 (8.68%) ASP.NET
8 33 (8.68%) PySpark
9 27 (7.11%) Vue
10 24 (6.32%) .NET Core
11 23 (6.05%) CSS
12 22 (5.79%) Web Services
13 20 (5.26%) Node.js
13 20 (5.26%) Redux
13 20 (5.26%) WCF
14 15 (3.95%) FIX Protocol
15 14 (3.68%) HTML
Miscellaneous
1 206 (54.21%) Equities
2 205 (53.95%) Fixed Income
3 193 (50.79%) Derivative
4 172 (45.26%) Hedge funds
5 53 (13.95%) Product Ownership
6 19 (5.00%) Legacy Applications
7 15 (3.95%) Algorithms
8 12 (3.16%) Pricing Data
9 8 (2.11%) Distributed Architecture
10 7 (1.84%) Distributed Systems
11 6 (1.58%) Equity Derivative
11 6 (1.58%) Market Risk
12 5 (1.32%) Greenfield Project
12 5 (1.32%) Management Information System
13 4 (1.05%) Credit Risk
13 4 (1.05%) Legacy Systems
13 4 (1.05%) Virtual Team
14 3 (0.79%) Distributed Applications
14 3 (0.79%) Interest Rate Derivative
14 3 (0.79%) SWIFT Messaging Network
Operating Systems
1 33 (8.68%) Linux
2 20 (5.26%) Unix
3 18 (4.74%) Apple iOS
4 13 (3.42%) Windows
5 5 (1.32%) Windows Server
6 1 (0.26%) CentOS
6 1 (0.26%) Debian
6 1 (0.26%) Fedora
6 1 (0.26%) Solaris
6 1 (0.26%) SUSE
6 1 (0.26%) Ubuntu
6 1 (0.26%) Windows 10
6 1 (0.26%) Windows 8
6 1 (0.26%) Windows Server 2012
6 1 (0.26%) Windows Server 2016
6 1 (0.26%) Windows Server 2019
Processes & Methodologies
1 242 (63.68%) Agile
2 145 (38.16%) Investment Management
3 118 (31.05%) Migration
4 111 (29.21%) Roadmaps
5 98 (25.79%) Regulatory Compliance
6 97 (25.53%) Data Governance
7 86 (22.63%) Asset Management
7 86 (22.63%) Software Engineering
8 82 (21.58%) Data Management
9 74 (19.47%) Analytics
10 45 (11.84%) Problem-Solving
11 43 (11.32%) Low Latency
12 38 (10.00%) DevOps
12 38 (10.00%) Electronic Trading
13 35 (9.21%) Risk Management
14 32 (8.42%) Full-Stack Development
14 32 (8.42%) Order Management
15 28 (7.37%) Fintech
16 27 (7.11%) CI/CD
17 22 (5.79%) Front End Development
Programming Languages
1 121 (31.84%) Java
2 109 (28.68%) Python
3 83 (21.84%) JavaScript
4 77 (20.26%) TypeScript
5 64 (16.84%) SQL
6 62 (16.32%) C#
7 55 (14.47%) C++
8 7 (1.84%) Rust
9 4 (1.05%) Ruby
9 4 (1.05%) Shell Script
10 3 (0.79%) MATLAB
11 2 (0.53%) Perl
11 2 (0.53%) PL/SQL
11 2 (0.53%) PowerShell
11 2 (0.53%) T-SQL
12 1 (0.26%) Bash
12 1 (0.26%) C
12 1 (0.26%) R
Qualifications
1 35 (9.21%) Degree
2 8 (2.11%) Computer Science Degree
3 4 (1.05%) Master's Degree
4 2 (0.53%) CCNA
4 2 (0.53%) CCNP
4 2 (0.53%) CFA
4 2 (0.53%) Cisco Certification
4 2 (0.53%) MBA
5 1 (0.26%) ISTQB
5 1 (0.26%) PhD
Quality Assurance & Compliance
1 34 (8.95%) MiFID
2 8 (2.11%) EMIR
3 7 (1.84%) Data Quality
4 6 (1.58%) QA
5 2 (0.53%) Accessibility
5 2 (0.53%) Basel II
5 2 (0.53%) Basel III
5 2 (0.53%) Dodd-Frank
5 2 (0.53%) SLA
6 1 (0.26%) GDPR
6 1 (0.26%) IFRS
6 1 (0.26%) ISO 20022
6 1 (0.26%) SEPA
6 1 (0.26%) TARGET2
System Software
1 12 (3.16%) Docker
2 1 (0.26%) Active Directory
2 1 (0.26%) FreeRADIUS
2 1 (0.26%) iptables
2 1 (0.26%) Platform Symphony
Systems Management
1 11 (2.89%) Kubernetes
2 3 (0.79%) ZABBIX
3 2 (0.53%) Control-M
3 2 (0.53%) Grafana
3 2 (0.53%) Terraform
4 1 (0.26%) Ansible
4 1 (0.26%) Cacti
4 1 (0.26%) Graylog
4 1 (0.26%) ITRS Geneos
4 1 (0.26%) Kibana
4 1 (0.26%) logstash
4 1 (0.26%) Nagios
4 1 (0.26%) Netcool
4 1 (0.26%) Prometheus
4 1 (0.26%) Proxmox
4 1 (0.26%) Puppet
4 1 (0.26%) Rundeck
4 1 (0.26%) SCCM
Vendors
1 31 (8.16%) Oracle
2 15 (3.95%) Murex
3 11 (2.89%) Atlassian
4 9 (2.37%) Bloomberg
5 6 (1.58%) Microsoft
5 6 (1.58%) Reuters
5 6 (1.58%) TIBCO
6 4 (1.05%) Refinitiv
7 3 (0.79%) Calypso
7 3 (0.79%) Citrix
7 3 (0.79%) IBM
7 3 (0.79%) ION Trading
7 3 (0.79%) Nokia
8 2 (0.53%) Adobe
8 2 (0.53%) Cisco
8 2 (0.53%) CQG
8 2 (0.53%) Google
8 2 (0.53%) SAP
8 2 (0.53%) Splunk
8 2 (0.53%) Sybase