SAP S/4HANA
England > London
The table below provides summary statistics for contract job vacancies advertised in London requiring SAP S/4HANA skills. It includes a benchmarking guide to the contractor rates offered in vacancies that cited SAP S/4HANA over the 6 months leading up to 1 May 2025, comparing them to the same period in the previous two years.
| 6 months to 1 May 2025 |
Same period 2024 | Same period 2023 | |
|---|---|---|---|
| Rank | 156 | 170 | 261 |
| Rank change year-on-year | +14 | +91 | +124 |
| Contract jobs citing SAP S/4HANA | 221 | 248 | 253 |
| As % of all contract jobs advertised in London | 1.76% | 1.39% | 0.94% |
| As % of the Business Applications category | 21.41% | 17.97% | 16.62% |
| Number of daily rates quoted | 123 | 140 | 135 |
| 10th Percentile | £476 | £461 | £508 |
| 25th Percentile | £525 | £512 | £540 |
| Median daily rate (50th Percentile) | £620 | £626 | £604 |
| Median % change year-on-year | -0.96% | +3.64% | -3.36% |
| 75th Percentile | £775 | £738 | £750 |
| 90th Percentile | £1,092 | £951 | £926 |
| England median daily rate | £587 | £600 | £600 |
| % change year-on-year | -2.21% | - | - |
| Number of hourly rates quoted | 2 | 1 | 0 |
| 10th Percentile | £61.63 | - | - |
| 25th Percentile | £62.19 | £61.68 | - |
| Median hourly rate | £63.75 | £63.36 | - |
| Median % change year-on-year | +0.62% | - | - |
| 75th Percentile | £64.69 | £65.03 | - |
| 90th Percentile | £64.88 | - | - |
| England median hourly rate | £67.50 | £61.60 | £95.00 |
| % change year-on-year | +9.58% | -35.16% | +40.74% |
All Business Application Skills
London
SAP S/4HANA falls under the Business Applications category. For comparison with the information above, the following table provides summary statistics for all contract job vacancies requiring business application skills in London.
| Contract vacancies with a requirement for business application skills | 1,032 | 1,380 | 1,522 |
| As % of all contract IT jobs advertised in London | 8.22% | 7.74% | 5.63% |
| Number of daily rates quoted | 662 | 885 | 961 |
| 10th Percentile | £404 | £400 | £406 |
| 25th Percentile | £475 | £485 | £500 |
| Median daily rate (50th Percentile) | £575 | £600 | £600 |
| Median % change year-on-year | -4.17% | - | +4.35% |
| 75th Percentile | £725 | £713 | £738 |
| 90th Percentile | £838 | £825 | £825 |
| England median daily rate | £575 | £550 | £575 |
| % change year-on-year | +4.55% | -4.35% | +4.55% |
| Number of hourly rates quoted | 11 | 13 | 24 |
| 10th Percentile | - | £15.59 | £21.15 |
| 25th Percentile | £22.27 | £18.25 | £22.63 |
| Median hourly rate | £36.48 | £19.50 | £32.56 |
| Median % change year-on-year | +87.08% | -40.11% | -6.97% |
| 75th Percentile | £64.38 | £65.03 | £45.00 |
| 90th Percentile | £77.50 | £84.20 | £63.75 |
| England median hourly rate | £60.00 | £41.23 | £47.50 |
| % change year-on-year | +45.53% | -13.20% | +40.75% |
SAP S/4HANA
Job Vacancy Trend in London
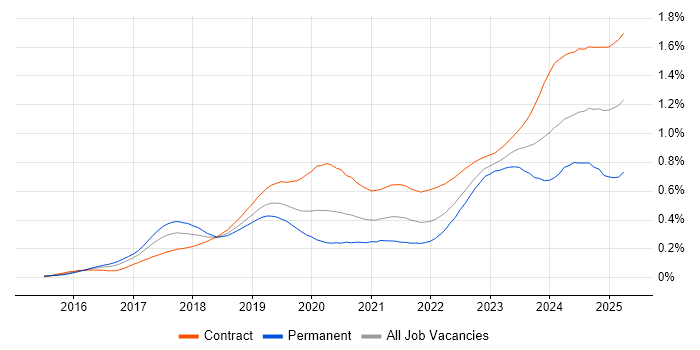
Job postings citing SAP S/4HANA as a proportion of all IT jobs advertised in London.

SAP S/4HANA
Contractor Daily Rate Trend in London
3-month moving average daily rate quoted in jobs citing SAP S/4HANA in London.
SAP S/4HANA
Daily Rate Histogram in London
Daily rate distribution for jobs citing SAP S/4HANA in London over the 6 months to 1 May 2025.
SAP S/4HANA
Contractor Hourly Rate Trend in London
3-month moving average hourly rates quoted in jobs citing SAP S/4HANA in London.
SAP S/4HANA
Contract Job Locations in London
The table below looks at the demand and provides a guide to the median contractor rates quoted in IT jobs citing SAP S/4HANA within the London region over the 6 months to 1 May 2025. The 'Rank Change' column provides an indication of the change in demand within each location based on the same 6 month period last year.
| Location | Rank Change on Same Period Last Year |
Matching Contract IT Job Ads |
Median Daily Rate Past 6 Months |
Median Daily Rate % Change on Same Period Last Year |
Live Jobs |
|---|---|---|---|---|---|
| Central London | +13 | 30 | £550 | -15.06% | 5 |
| South London | - | 2 | - | - | |
| East London | +13 | 1 | £495 | -8.33% | 1 |
| West London | +2 | 1 | - | - | 6 |
| SAP S/4HANA England |
|||||
SAP S/4HANA
Co-occurring Skills and Capabilities in London by Category
The follow tables expand on the table above by listing co-occurrences grouped by category. The same employment type, locality and period is covered with up to 20 co-occurrences shown in each of the following categories:
|
|
||||||||||||||||||||||||||||||||||||||||||||||||||||||||||||||||||||||||||||||||||||||||||||||||||||||||||||||||||||||||||||||
|
|
||||||||||||||||||||||||||||||||||||||||||||||||||||||||||||||||||||||||||||||||||||||||||||||||||||||||||||||||||||||||||||||
|
|
||||||||||||||||||||||||||||||||||||||||||||||||||||||||||||||||||||||||||||||||||||||||||||||||||||||||||||||||||||||||||||||
|
|
||||||||||||||||||||||||||||||||||||||||||||||||||||||||||||||||||||||||||||||||||||||||||||||||||||||||||||||||||||||||||||||
|
|
||||||||||||||||||||||||||||||||||||||||||||||||||||||||||||||||||||||||||||||||||||||||||||||||||||||||||||||||||||||||||||||
|
|
||||||||||||||||||||||||||||||||||||||||||||||||||||||||||||||||||||||||||||||||||||||||||||||||||||||||||||||||||||||||||||||
|
|
||||||||||||||||||||||||||||||||||||||||||||||||||||||||||||||||||||||||||||||||||||||||||||||||||||||||||||||||||||||||||||||
|
|
||||||||||||||||||||||||||||||||||||||||||||||||||||||||||||||||||||||||||||||||||||||||||||||||||||||||||||||||||||||||||||||
|
|
||||||||||||||||||||||||||||||||||||||||||||||||||||||||||||||||||||||||||||||||||||||||||||||||||||||||||||||||||||||||||||||
