Collaborative Working Contracts in London

Collaborative Working
England > London

The following table provides summary statistics for contract job vacancies advertised in London with a requirement for Collaborative Working skills. Included is a benchmarking guide to the contractor rates offered in vacancies that have cited Collaborative Working over the 6 months to 11 May 2024 with a comparison to the same period in the previous 2 years.

6 months to
11 May 2024
Same period 2023 Same period 2022
Rank 142 188 181
Rank change year-on-year +46 -7 +7
Contract jobs citing Collaborative Working 312 382 637
As % of all contract jobs advertised in London 1.77% 1.46% 1.65%
As % of the Processes & Methodologies category 1.99% 1.60% 1.79%
Number of daily rates quoted 196 247 419
10th Percentile £273 £360 £410
25th Percentile £383 £450 £488
Median daily rate (50th Percentile) £500 £550 £575
Median % change year-on-year -9.09% -4.35% +9.52%
75th Percentile £656 £681 £675
90th Percentile £745 £775 £750
England median daily rate £500 £550 £550
% change year-on-year -9.09% - +10.00%
Number of hourly rates quoted 5 11 2
10th Percentile £18.40 £30.75 £22.27
25th Percentile £22.00 £35.00 £25.54
Median hourly rate £23.00 £40.00 £31.97
Median % change year-on-year -42.50% +25.13% +41.56%
75th Percentile £24.75 £63.75 £39.29
90th Percentile £31.50 £73.75 £43.09
England median hourly rate £50.00 £51.00 £19.35
% change year-on-year -1.96% +163.57% -13.69%

All Process and Methodology Skills
London

Collaborative Working is in the Processes and Methodologies category. The following table is for comparison with the above and provides summary statistics for all contract job vacancies advertised in London with a requirement for process or methodology skills.

Contract vacancies with a requirement for process or methodology skills 15,657 23,832 35,541
As % of all contract IT jobs advertised in London 88.72% 90.97% 92.31%
Number of daily rates quoted 11,214 17,166 25,985
10th Percentile £341 £375 £388
25th Percentile £450 £475 £475
Median daily rate (50th Percentile) £550 £590 £575
Median % change year-on-year -6.78% +2.61% +9.52%
75th Percentile £681 £700 £688
90th Percentile £800 £800 £775
England median daily rate £525 £550 £538
% change year-on-year -4.55% +2.33% +7.50%
Number of hourly rates quoted 313 270 416
10th Percentile £15.96 £18.45 £17.40
25th Percentile £20.00 £22.53 £23.91
Median hourly rate £28.00 £38.25 £36.75
Median % change year-on-year -26.80% +4.08% +13.08%
75th Percentile £48.75 £63.94 £51.00
90th Percentile £66.40 £80.23 £69.06
England median hourly rate £37.18 £37.50 £25.00
% change year-on-year -0.85% +50.00% +6.38%

Collaborative Working
Job Vacancy Trend in London

Job postings citing Collaborative Working as a proportion of all IT jobs advertised in London.
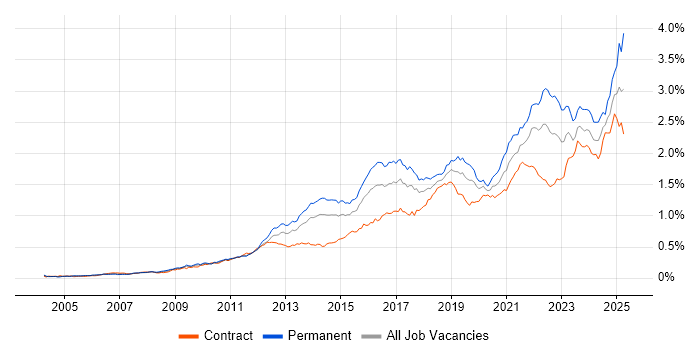
Job vacancy trend for Collaborative Working in London

Collaborative Working
Contractor Daily Rate Trend in London

3-month moving average daily rate quoted in jobs citing Collaborative Working in London.

Daily rate trend for Collaborative Working in London

Collaborative Working
Daily Rate Histogram in London

Daily rate distribution for jobs citing Collaborative Working in London over the 6 months to 11 May 2024.

Daily rate histogram for Collaborative Working in London

Collaborative Working
Contractor Hourly Rate Trend in London

3-month moving average hourly rates quoted in jobs citing Collaborative Working in London.

Hourly rate trend for Collaborative Working in London

Collaborative Working
Hourly Rate Histogram in London

Hourly rate distribution of jobs citing Collaborative Working in London over the 6 months to 11 May 2024.

Hourly rate histogram for Collaborative Working in London

Collaborative Working
Contract Job Locations in London

The table below looks at the demand and provides a guide to the median contractor rates quoted in IT jobs citing Collaborative Working within the London region over the 6 months to 11 May 2024. The 'Rank Change' column provides an indication of the change in demand within each location based on the same 6 month period last year.

Location Rank Change
on Same Period
Last Year
Matching
Contract
IT Job Ads
Median
Daily Rate
Past 6 Months
Median Daily Rate
% Change
on Same Period
Last Year
Live
Jobs
Central London +23 32 £525 -4.55% 48
South London +10 8 £575 -2.13% 11
East London 0 3 £495 +36.55% 18
West London +4 2 £300 -46.76% 21
North London - 1 £273 - 2
Collaborative Working
England

Collaborative Working
Co-occurring Skills and Capabilities in London by Category

The follow tables expand on the table above by listing co-occurrences grouped by category. The same employment type, locality and period is covered with up to 20 co-occurrences shown in each of the following categories:

Application Platforms
1 14 (4.49%) SharePoint
2 9 (2.88%) CMS
2 9 (2.88%) Confluence
3 4 (1.28%) Luigi
3 4 (1.28%) Microsoft Exchange
4 2 (0.64%) Apache
4 2 (0.64%) ArcGIS
4 2 (0.64%) SAS
5 1 (0.32%) Anypoint
5 1 (0.32%) Apache Airflow
5 1 (0.32%) Apache Spark
5 1 (0.32%) Moodle
5 1 (0.32%) nginx
5 1 (0.32%) Oracle Workflow
Applications
1 17 (5.45%) Microsoft Office
2 14 (4.49%) Microsoft Excel
3 6 (1.92%) Adobe Creative Suite
4 5 (1.60%) Microsoft Project
4 5 (1.60%) Photoshop
4 5 (1.60%) Sketch
5 4 (1.28%) Adobe Illustrator
6 3 (0.96%) Adobe Captivate
6 3 (0.96%) Chatbot
6 3 (0.96%) Microsoft PowerPoint
7 2 (0.64%) Adobe XD
7 2 (0.64%) CINEMA 4D
8 1 (0.32%) InVision
8 1 (0.32%) MS Visio
8 1 (0.32%) Spreadsheet
8 1 (0.32%) Trello
Business Applications
1 5 (1.60%) SAP S/4HANA
2 4 (1.28%) Distributed Ledger
3 2 (0.64%) SAP HCM
3 2 (0.64%) SAP HR
4 1 (0.32%) Aladdin
4 1 (0.32%) BigMachines
4 1 (0.32%) Dynamics AX
4 1 (0.32%) Oracle General Ledger
4 1 (0.32%) Oracle Procure-to-Pay
4 1 (0.32%) Remedy ITSM
4 1 (0.32%) SAP BPC
4 1 (0.32%) SimCorp Dimension
Cloud Services
1 38 (12.18%) AWS
2 34 (10.90%) Azure
3 16 (5.13%) Power Platform
4 11 (3.53%) Microsoft 365
5 9 (2.88%) Figma
5 9 (2.88%) Serverless
6 8 (2.56%) AWS Lambda
6 8 (2.56%) GCP
7 7 (2.24%) AWS CloudFormation
7 7 (2.24%) Azure DevOps
8 6 (1.92%) Amazon EC2
8 6 (1.92%) GitHub
8 6 (1.92%) PaaS
9 5 (1.60%) Amazon CloudWatch
9 5 (1.60%) Amazon S3
9 5 (1.60%) AWS CodeBuild
9 5 (1.60%) AWS CodePipeline
9 5 (1.60%) Azure Data Factory
9 5 (1.60%) Azure Monitor
9 5 (1.60%) Cloud Computing
Communications & Networking
1 9 (2.88%) VPN
2 8 (2.56%) DNS
3 7 (2.24%) Firewall
4 6 (1.92%) Internet
4 6 (1.92%) Network Security
4 6 (1.92%) TCP/IP
5 5 (1.60%) Wireless
6 4 (1.28%) HTTP
6 4 (1.28%) SSH
7 3 (0.96%) Remote Desktop
8 2 (0.64%) Broadband
8 2 (0.64%) Intranet
8 2 (0.64%) SSL
9 1 (0.32%) DHCP
Database & Business Intelligence
1 15 (4.81%) Power BI
2 11 (3.53%) Data Warehouse
3 9 (2.88%) Relational Database
4 7 (2.24%) SQL Server
5 6 (1.92%) PostgreSQL
6 5 (1.60%) Amazon QuickSight
7 4 (1.28%) Amazon Redshift
7 4 (1.28%) NoSQL
7 4 (1.28%) RDBMS
8 3 (0.96%) Tableau
9 2 (0.64%) Amazon RDS
9 2 (0.64%) Data Mart
9 2 (0.64%) Flink
9 2 (0.64%) GIS
9 2 (0.64%) Star Schema
10 1 (0.32%) Azure SQL Database
10 1 (0.32%) Data Lake
10 1 (0.32%) MongoDB
10 1 (0.32%) Oracle Database
10 1 (0.32%) Power Query
Development Applications
1 31 (9.94%) JIRA
2 14 (4.49%) Git
3 11 (3.53%) Selenium
4 9 (2.88%) JMeter
5 8 (2.56%) GitLab
6 6 (1.92%) Jenkins
7 5 (1.60%) Liquibase
8 3 (0.96%) Visual Studio
9 2 (0.64%) WebDriver
10 1 (0.32%) Appium
10 1 (0.32%) Artifactory
10 1 (0.32%) Bitbucket
10 1 (0.32%) git-flow
10 1 (0.32%) LSMW
10 1 (0.32%) Maven
10 1 (0.32%) Mockito
10 1 (0.32%) SoapUI
10 1 (0.32%) SpecFlow
10 1 (0.32%) Team Foundation Server
10 1 (0.32%) Travis CI
General
1 140 (44.87%) Social Skills
2 63 (20.19%) Public Sector
3 54 (17.31%) Finance
4 45 (14.42%) Analytical Skills
5 23 (7.37%) Marketing
6 13 (4.17%) Banking
7 11 (3.53%) Documentation Skills
7 11 (3.53%) Influencing Skills
8 9 (2.88%) Legal
9 8 (2.56%) Multimedia
9 8 (2.56%) Organisational Skills
9 8 (2.56%) Presentation Skills
10 7 (2.24%) Inclusion and Diversity
11 6 (1.92%) Financial Institution
11 6 (1.92%) Telecoms
12 5 (1.60%) Investment Banking
12 5 (1.60%) Military
13 4 (1.28%) French Language
13 4 (1.28%) German Language
13 4 (1.28%) Local Government
Job Titles
1 38 (12.18%) Analyst
1 38 (12.18%) Developer
2 30 (9.62%) Architect
3 21 (6.73%) Contracts Manager
3 21 (6.73%) Designer
4 19 (6.09%) Lead
5 18 (5.77%) Senior
6 14 (4.49%) Business Analyst
6 14 (4.49%) DevOps Engineer
7 13 (4.17%) Consultant
8 12 (3.85%) Delivery Manager
9 10 (3.21%) Azure Engineer
9 10 (3.21%) Solutions Architect
10 8 (2.56%) Data Analyst
10 8 (2.56%) Data Engineer
10 8 (2.56%) Full Stack Developer
10 8 (2.56%) IT Analyst
10 8 (2.56%) Project Manager
10 8 (2.56%) Test Manager
11 7 (2.24%) Data Manager
Libraries, Frameworks & Software Standards
1 9 (2.88%) .NET
2 8 (2.56%) AngularJS
2 8 (2.56%) Spring
2 8 (2.56%) Spring Boot
3 7 (2.24%) ADO
3 7 (2.24%) CSS
3 7 (2.24%) HTML
3 7 (2.24%) REST
3 7 (2.24%) Web Services
4 6 (1.92%) Hibernate
5 5 (1.60%) JPA
5 5 (1.60%) JSON
5 5 (1.60%) Node.js
6 4 (1.28%) GraphQL
6 4 (1.28%) Kafka
6 4 (1.28%) LDAP
6 4 (1.28%) Oracle Fusion
6 4 (1.28%) Pandas
7 3 (0.96%) SAML
7 3 (0.96%) XML
Miscellaneous
1 16 (5.13%) Product Ownership
2 12 (3.85%) Onboarding
3 10 (3.21%) Team-Oriented Environment
4 9 (2.88%) Management Information System
5 8 (2.56%) Analytical Mindset
6 7 (2.24%) e-Learning
7 6 (1.92%) Virtual Team
8 5 (1.60%) Security Posture
9 4 (1.28%) Blockchain
9 4 (1.28%) CBDC
9 4 (1.28%) Digital Media
9 4 (1.28%) FMCG
9 4 (1.28%) Podcast
9 4 (1.28%) Self-Motivation
9 4 (1.28%) Social Media
9 4 (1.28%) Web3
10 3 (0.96%) Enterprise Software
10 3 (0.96%) iPad
10 3 (0.96%) iPhone
11 2 (0.64%) IoT
Operating Systems
1 15 (4.81%) Windows
2 11 (3.53%) Linux
3 6 (1.92%) Windows 10
4 4 (1.28%) Apple iOS
5 3 (0.96%) Unix
5 3 (0.96%) Windows Server
6 1 (0.32%) Android
6 1 (0.32%) Mac OS
Processes & Methodologies
1 81 (25.96%) Agile
2 76 (24.36%) Problem-Solving
3 39 (12.50%) Project Management
4 29 (9.29%) PRINCE2
4 29 (9.29%) Supplier Management
5 27 (8.65%) CI/CD
5 27 (8.65%) DevOps
6 24 (7.69%) Computer Science
7 23 (7.37%) Business Intelligence
8 22 (7.05%) Decision-Making
8 22 (7.05%) Stakeholder Management
9 21 (6.73%) Change Management
9 21 (6.73%) Continuous Improvement
9 21 (6.73%) Data Modelling
9 21 (6.73%) Migration
10 19 (6.09%) User Experience
11 18 (5.77%) Roadmaps
12 17 (5.45%) Scrum
12 17 (5.45%) Visualisation
13 16 (5.13%) Containerisation
Programming Languages
1 31 (9.94%) Python
2 29 (9.29%) SQL
3 14 (4.49%) PowerShell
4 13 (4.17%) Java
5 12 (3.85%) C#
6 10 (3.21%) JavaScript
7 6 (1.92%) C++
8 4 (1.28%) Bash
8 4 (1.28%) Bicep
8 4 (1.28%) Data Analysis Expressions
9 3 (0.96%) PHP
9 3 (0.96%) Ruby
9 3 (0.96%) Shell Script
9 3 (0.96%) TypeScript
10 2 (0.64%) PL/SQL
11 1 (0.32%) ABAP
11 1 (0.32%) Scala
11 1 (0.32%) T-SQL
11 1 (0.32%) VB.NET
Qualifications
1 50 (16.03%) Security Cleared
2 49 (15.71%) SC Cleared
3 48 (15.38%) Degree
4 18 (5.77%) Computer Science Degree
5 7 (2.24%) Master's Degree
6 6 (1.92%) DV Cleared
7 5 (1.60%) DBS Check
8 4 (1.28%) CISM
8 4 (1.28%) CISSP
8 4 (1.28%) PMI Certification
8 4 (1.28%) PMP
9 3 (0.96%) BPSS Clearance
9 3 (0.96%) ITIL Certification
10 2 (0.64%) CISA
10 2 (0.64%) CTC Cleared
11 1 (0.32%) Azure Certification
11 1 (0.32%) CEH
11 1 (0.32%) CIPD
Quality Assurance & Compliance
1 19 (6.09%) QA
2 15 (4.81%) Accessibility
3 11 (3.53%) Data Quality
4 4 (1.28%) GDPR
5 3 (0.96%) Cyber Essentials
5 3 (0.96%) ISO/IEC 27002 (supersedes ISO/IEC 17799)
5 3 (0.96%) PMO
6 2 (0.64%) NCSC
6 2 (0.64%) NIST
6 2 (0.64%) SLA
7 1 (0.32%) Actionable Recommendations
7 1 (0.32%) Basel III
7 1 (0.32%) Government Security Classifications
7 1 (0.32%) IFRS
7 1 (0.32%) ISO/IEC 27001
7 1 (0.32%) PCI DSS
System Software
1 14 (4.49%) Active Directory
2 12 (3.85%) Docker
3 4 (1.28%) Hyper-V
3 4 (1.28%) NFS
4 3 (0.96%) VMware Infrastructure
5 1 (0.32%) BitLocker
5 1 (0.32%) Virtual Desktop
Systems Management
1 14 (4.49%) Kubernetes
2 7 (2.24%) Ansible
2 7 (2.24%) SCCM
3 6 (1.92%) Terraform
4 5 (1.60%) Microsoft Intune
5 4 (1.28%) Progress Chef
5 4 (1.28%) Puppet
6 2 (0.64%) AirWatch
6 2 (0.64%) Prometheus
7 1 (0.32%) Kibana
7 1 (0.32%) MOM
7 1 (0.32%) PingFederate
7 1 (0.32%) Salt
7 1 (0.32%) Single Sign-On
7 1 (0.32%) WSUS
Vendors
1 54 (17.31%) Microsoft
2 17 (5.45%) SAP
3 11 (3.53%) Oracle
4 10 (3.21%) ServiceNow
5 8 (2.56%) Adobe
5 8 (2.56%) Salesforce
6 5 (1.60%) Apple
6 5 (1.60%) Google
7 4 (1.28%) Freshdesk
7 4 (1.28%) SmartStream
8 3 (0.96%) Databricks
8 3 (0.96%) IBM
8 3 (0.96%) Marketo
8 3 (0.96%) Pardot
8 3 (0.96%) VMware
9 2 (0.64%) Citrix
9 2 (0.64%) CyberArk
9 2 (0.64%) MuleSoft
9 2 (0.64%) Palo Alto
9 2 (0.64%) Splunk