Inclusion and Diversity Contracts in London

Inclusion and Diversity
England > London

The table below looks at the prevalence of the term Inclusion and Diversity in contract job vacancies advertised in London. Included is a benchmarking guide to the contractor rates offered in vacancies that have cited Inclusion and Diversity over the 6 months to 3 May 2024 with a comparison to the same period over the previous 2 years.

6 months to
3 May 2024
Same period 2023 Same period 2022
Rank 111 109 350
Rank change year-on-year -2 +241 +85
Contract jobs citing Inclusion and Diversity 405 642 260
As % of all contract jobs advertised in London 2.28% 2.39% 0.67%
As % of the General category 3.61% 3.77% 1.12%
Number of daily rates quoted 343 432 197
10th Percentile £462 £465 £425
25th Percentile £556 £550 £505
Median daily rate (50th Percentile) £615 £600 £565
Median % change year-on-year +2.50% +6.19% +28.41%
75th Percentile £700 £700 £650
90th Percentile £775 £788 £750
England median daily rate £610 £600 £565
% change year-on-year +1.67% +6.19% +25.56%
Number of hourly rates quoted 6 1 0
10th Percentile £14.42 - -
25th Percentile £16.27 £38.50 -
Median hourly rate £20.57 £39.00 -
Median % change year-on-year -47.26% - -
75th Percentile £42.15 £39.50 -
90th Percentile £53.13 - -
England median hourly rate £18.80 £39.00 £50.00
% change year-on-year -51.81% -22.00% +144.89%

All General Skills
London

Inclusion and Diversity is in the General Skills category. The following table is for comparison with the above and provides summary statistics for all contract job vacancies advertised in London with a requirement for common skills.

Contract vacancies with a requirement for common skills 11,229 17,025 23,303
As % of all contract IT jobs advertised in London 63.10% 63.38% 59.82%
Number of daily rates quoted 8,007 12,319 16,805
10th Percentile £335 £375 £381
25th Percentile £450 £481 £475
Median daily rate (50th Percentile) £575 £600 £575
Median % change year-on-year -4.17% +4.35% +9.52%
75th Percentile £700 £725 £700
90th Percentile £813 £825 £797
England median daily rate £538 £550 £550
% change year-on-year -2.27% - +10.00%
Number of hourly rates quoted 246 217 300
10th Percentile £16.00 £16.52 £19.77
25th Percentile £18.25 £21.24 £25.68
Median hourly rate £28.50 £32.00 £37.50
Median % change year-on-year -10.94% -14.67% +35.72%
75th Percentile £43.75 £58.75 £49.81
90th Percentile £65.00 £70.00 £65.08
England median hourly rate £30.16 £32.50 £21.50
% change year-on-year -7.20% +51.16% -4.44%

Inclusion and Diversity
Job Vacancy Trend in London

Job postings citing Inclusion and Diversity as a proportion of all IT jobs advertised in London.
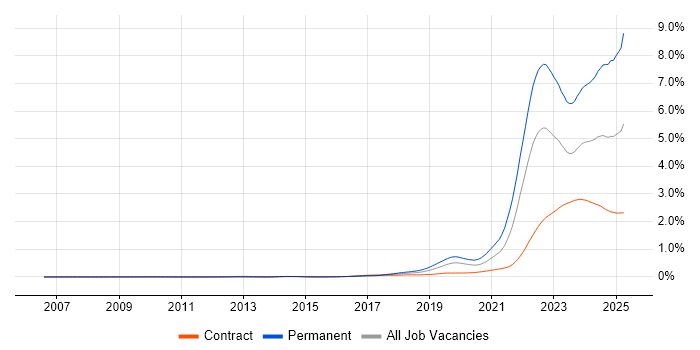
Job vacancy trend for Inclusion and Diversity in London

Inclusion and Diversity
Contractor Daily Rate Trend in London

3-month moving average daily rate quoted in jobs citing Inclusion and Diversity in London.

Daily rate trend for Inclusion and Diversity in London

Inclusion and Diversity
Daily Rate Histogram in London

Daily rate distribution for jobs citing Inclusion and Diversity in London over the 6 months to 3 May 2024.

Daily rate histogram for Inclusion and Diversity in London

Inclusion and Diversity
Contractor Hourly Rate Trend in London

3-month moving average hourly rates quoted in jobs citing Inclusion and Diversity in London.

Hourly rate trend for Inclusion and Diversity in London

Inclusion and Diversity
Hourly Rate Histogram in London

Hourly rate distribution of jobs citing Inclusion and Diversity in London over the 6 months to 3 May 2024.

Hourly rate histogram for Inclusion and Diversity in London

Inclusion and Diversity
Contract Job Locations in London

The table below looks at the demand and provides a guide to the median contractor rates quoted in IT jobs citing Inclusion and Diversity within the London region over the 6 months to 3 May 2024. The 'Rank Change' column provides an indication of the change in demand within each location based on the same 6 month period last year.

Location Rank Change
on Same Period
Last Year
Matching
Contract
IT Job Ads
Median
Daily Rate
Past 6 Months
Median Daily Rate
% Change
on Same Period
Last Year
Live
Jobs
Central London +48 7 £650 +15.56% 56
South London +13 2 - - 7
East London - 1 - - 57
Inclusion and Diversity
England

Inclusion and Diversity
Co-occurring Skills and Capabilities in London by Category

The follow tables expand on the table above by listing co-occurrences grouped by category. The same employment type, locality and period is covered with up to 20 co-occurrences shown in each of the following categories:

Application Platforms
1 5 (1.23%) CMS
2 4 (0.99%) Apache Spark
2 4 (0.99%) Drupal
3 2 (0.49%) Confluence
3 2 (0.49%) Mendix
3 2 (0.49%) nginx
4 1 (0.25%) Ethereum
4 1 (0.25%) Hyperledger
4 1 (0.25%) SAS
4 1 (0.25%) SharePoint
Applications
1 12 (2.96%) Microsoft Office
2 5 (1.23%) Microsoft Excel
3 4 (0.99%) InVision
3 4 (0.99%) Sketch
3 4 (0.99%) Spreadsheet
4 1 (0.25%) Adobe Creative Suite
4 1 (0.25%) Adobe Illustrator
4 1 (0.25%) Microsoft PowerPoint
4 1 (0.25%) Microsoft Project
4 1 (0.25%) Photoshop
4 1 (0.25%) UserZoom
Business Applications
1 4 (0.99%) ION MarketView
2 1 (0.25%) Aladdin
2 1 (0.25%) HealthRoster
2 1 (0.25%) Markit EDM
2 1 (0.25%) Oracle ERP
2 1 (0.25%) Payment Gateway
2 1 (0.25%) SAP CX
2 1 (0.25%) SAP Hybris
2 1 (0.25%) SAP S/4HANA
2 1 (0.25%) SAP SD
2 1 (0.25%) thinkFolio
Cloud Services
1 51 (12.59%) AWS
2 44 (10.86%) Azure
3 19 (4.69%) Power Platform
4 11 (2.72%) Microsoft 365
5 10 (2.47%) Boomi
6 8 (1.98%) Snowflake
7 7 (1.73%) GCP
8 6 (1.48%) GitHub
9 5 (1.23%) Serverless
10 4 (0.99%) Amazon ECS
10 4 (0.99%) Azure DevOps
10 4 (0.99%) Azure Monitor
10 4 (0.99%) Cloud Computing
10 4 (0.99%) Entra ID
10 4 (0.99%) Figma
10 4 (0.99%) IaaS
10 4 (0.99%) PaaS
11 2 (0.49%) AWS CloudFormation
11 2 (0.49%) SaaS
11 2 (0.49%) SuccessFactors
Communications & Networking
1 7 (1.73%) Kerberos
2 5 (1.23%) Network Security
2 5 (1.23%) SSL
3 4 (0.99%) Firewall
4 3 (0.74%) Cisco ASA
4 3 (0.74%) LAN
4 3 (0.74%) WAN
5 2 (0.49%) BGP
5 2 (0.49%) DNS
5 2 (0.49%) IPsec
5 2 (0.49%) OSPF
5 2 (0.49%) TCP/IP
5 2 (0.49%) VPN
5 2 (0.49%) Wireless
5 2 (0.49%) WLAN
6 1 (0.25%) Intranet
6 1 (0.25%) VoIP
6 1 (0.25%) Wi-Fi
Database & Business Intelligence
1 21 (5.19%) Data Warehouse
2 19 (4.69%) Power BI
3 12 (2.96%) SQL Server Integration Services
4 9 (2.22%) SQL Server
4 9 (2.22%) SQL Server Analysis Services
5 8 (1.98%) SQL Server Reporting Services
6 7 (1.73%) NoSQL
7 6 (1.48%) MySQL
8 4 (0.99%) KDB
9 3 (0.74%) PostgreSQL
10 2 (0.49%) Amazon RDS
10 2 (0.49%) Azure SQL Data Warehouse
11 1 (0.25%) Data Lake
11 1 (0.25%) Data Vault
11 1 (0.25%) Elasticsearch
11 1 (0.25%) Hadoop
11 1 (0.25%) MongoDB
11 1 (0.25%) Oracle Database
11 1 (0.25%) SAP HANA
11 1 (0.25%) Tableau
Development Applications
1 11 (2.72%) JIRA
2 7 (1.73%) Selenium
2 7 (1.73%) SpecFlow
3 6 (1.48%) GitLab
4 5 (1.23%) Gradle
4 5 (1.23%) Jenkins
4 5 (1.23%) Maven
5 4 (0.99%) Axure RP
5 4 (0.99%) Eclipse
5 4 (0.99%) Sonatype Nexus
5 4 (0.99%) TeamCity
6 3 (0.74%) Git
7 2 (0.49%) CircleCI
7 2 (0.49%) Cypress.io
7 2 (0.49%) webpack
8 1 (0.25%) Atlassian Bamboo
8 1 (0.25%) Bitbucket
8 1 (0.25%) Oracle Forms
8 1 (0.25%) Terragrunt
8 1 (0.25%) VisualWorks
General
1 127 (31.36%) Social Skills
2 91 (22.47%) Finance
3 21 (5.19%) Law
4 15 (3.70%) Banking
5 14 (3.46%) Analytical Skills
6 8 (1.98%) Marketing
7 7 (1.73%) Front Office
8 6 (1.48%) Influencing Skills
8 6 (1.48%) Public Sector
9 5 (1.23%) Presentation Skills
10 4 (0.99%) Investment Banking
10 4 (0.99%) Publishing
11 3 (0.74%) Legal
11 3 (0.74%) Retail
12 2 (0.49%) Military
12 2 (0.49%) Retail Banking
13 1 (0.25%) Advertising
13 1 (0.25%) Fire and Rescue
13 1 (0.25%) Local Government
13 1 (0.25%) Telecoms
Job Titles
1 118 (29.14%) Analyst
2 85 (20.99%) Business Analyst
3 52 (12.84%) Developer
3 52 (12.84%) Project Manager
4 47 (11.60%) Senior
5 42 (10.37%) Architect
6 34 (8.40%) Insurance Business Analyst
7 27 (6.67%) Solutions Architect
8 23 (5.68%) Lead
9 18 (4.44%) Senior Analyst
10 17 (4.20%) Senior Business Analyst
11 15 (3.70%) Data Analyst
12 13 (3.21%) C# Developer
12 13 (3.21%) Consultant
13 12 (2.96%) Product Owner
14 11 (2.72%) Business Intelligence Analyst
14 11 (2.72%) Quality Analyst
14 11 (2.72%) Senior Manager
15 10 (2.47%) Power BI Analyst
15 10 (2.47%) Test Analyst
Libraries, Frameworks & Software Standards
1 11 (2.72%) JSON
2 10 (2.47%) .NET
3 7 (1.73%) KnockoutJS
4 5 (1.23%) React
4 5 (1.23%) REST
5 4 (0.99%) .NET Core
5 4 (0.99%) Catalyst
5 4 (0.99%) Node.js
6 3 (0.74%) EDI
6 3 (0.74%) HTML
6 3 (0.74%) Kafka
7 2 (0.49%) CSS
7 2 (0.49%) NumPy
7 2 (0.49%) OAuth
7 2 (0.49%) OpenID
7 2 (0.49%) RESTful
7 2 (0.49%) SAML
7 2 (0.49%) SPML
7 2 (0.49%) Spring
7 2 (0.49%) XML
Miscellaneous
1 27 (6.67%) Reinsurance
2 16 (3.95%) Product Ownership
3 8 (1.98%) Management Information System
4 7 (1.73%) Analytical Mindset
4 7 (1.73%) Distributed Systems
4 7 (1.73%) Onboarding
5 6 (1.48%) Enterprise Software
5 6 (1.48%) Self-Motivation
6 5 (1.23%) PKI
7 4 (0.99%) Foreign Exchange (FX)
8 3 (0.74%) Data Centre
8 3 (0.74%) NHS
8 3 (0.74%) Smartphone
8 3 (0.74%) Tandem
9 2 (0.49%) Algorithms
9 2 (0.49%) Blog
9 2 (0.49%) CMDB
9 2 (0.49%) FMCG
9 2 (0.49%) Legacy Applications
9 2 (0.49%) Public Cloud
Operating Systems
1 8 (1.98%) Windows
2 6 (1.48%) Linux
3 3 (0.74%) Unix
4 2 (0.49%) Windows 10
4 2 (0.49%) Windows Server
Processes & Methodologies
1 114 (28.15%) Agile
2 53 (13.09%) Migration
3 47 (11.60%) Stakeholder Engagement
4 36 (8.89%) Stakeholder Management
5 30 (7.41%) Mentoring
6 26 (6.42%) Test Automation
7 25 (6.17%) Problem-Solving
7 25 (6.17%) Project Management
8 24 (5.93%) Business Intelligence
9 23 (5.68%) DevOps
10 20 (4.94%) Data Modelling
10 20 (4.94%) Target Operating Model
10 20 (4.94%) User Acceptance Testing
11 19 (4.69%) Scrum
12 17 (4.20%) Data Migration
13 16 (3.95%) Cybersecurity
14 15 (3.70%) CI/CD
15 14 (3.46%) User Experience
16 13 (3.21%) User Stories
16 13 (3.21%) Workshop Facilitation
Programming Languages
1 45 (11.11%) SQL
2 28 (6.91%) Python
3 19 (4.69%) C#
4 16 (3.95%) Java
5 14 (3.46%) JavaScript
6 8 (1.98%) PowerShell
7 5 (1.23%) Perl
7 5 (1.23%) PHP
8 4 (0.99%) TypeScript
9 3 (0.74%) Ruby
10 2 (0.49%) Bash
10 2 (0.49%) Scala
11 1 (0.25%) Bicep
11 1 (0.25%) C++
11 1 (0.25%) Go
11 1 (0.25%) Groovy
11 1 (0.25%) Shell Script
11 1 (0.25%) Smalltalk
11 1 (0.25%) Solidity
Qualifications
1 20 (4.94%) Degree
2 11 (2.72%) Security Cleared
3 9 (2.22%) SC Cleared
4 4 (0.99%) Azure Certification
5 3 (0.74%) CISM
5 3 (0.74%) CISSP
6 2 (0.49%) CISA
6 2 (0.49%) Microsoft Certification
7 1 (0.25%) CCIE
7 1 (0.25%) Cisco Certification
7 1 (0.25%) CTC Cleared
7 1 (0.25%) DV Cleared
7 1 (0.25%) ISEB
7 1 (0.25%) ISTQB
7 1 (0.25%) OCP
7 1 (0.25%) Oracle Certification
7 1 (0.25%) PMI Certification
7 1 (0.25%) PMP
7 1 (0.25%) Postgraduate
7 1 (0.25%) SAP Certification
Quality Assurance & Compliance
1 12 (2.96%) Data Quality
2 9 (2.22%) QA
3 7 (1.73%) Accessibility
3 7 (1.73%) PMO
4 6 (1.48%) PCI DSS
5 5 (1.23%) NIST
6 4 (0.99%) ISO/IEC 27001
7 3 (0.74%) Cyber Essentials
7 3 (0.74%) Sarbanes-Oxley
8 2 (0.49%) ISO/IEC 27002 (supersedes ISO/IEC 17799)
9 1 (0.25%) COBIT
9 1 (0.25%) Cyber Essentials PLUS
9 1 (0.25%) GDPR
9 1 (0.25%) GRC
9 1 (0.25%) NCSC
9 1 (0.25%) SLA
System Software
1 5 (1.23%) Docker
2 3 (0.74%) Active Directory
3 2 (0.49%) Hyper-V
4 1 (0.25%) Virtual Desktop
Systems Management
1 13 (3.21%) Kubernetes
2 10 (2.47%) Terraform
3 3 (0.74%) Ansible
4 2 (0.49%) Puppet
5 1 (0.25%) Argo
5 1 (0.25%) Grafana
5 1 (0.25%) Kibana
5 1 (0.25%) logstash
5 1 (0.25%) Progress Chef
5 1 (0.25%) Prometheus
5 1 (0.25%) SCCM
Vendors
1 28 (6.91%) Microsoft
2 9 (2.22%) ServiceNow
3 7 (1.73%) Okta
4 5 (1.23%) Cisco
4 5 (1.23%) Guidewire
4 5 (1.23%) Palo Alto
4 5 (1.23%) Salesforce
4 5 (1.23%) VMware
5 4 (0.99%) Databricks
5 4 (0.99%) Hotjar
5 4 (0.99%) ION Trading
5 4 (0.99%) Screaming Frog
6 3 (0.74%) Oracle
6 3 (0.74%) Veeam
7 2 (0.49%) Atlassian
7 2 (0.49%) CA
7 2 (0.49%) Fortinet
7 2 (0.49%) Ivanti
7 2 (0.49%) Juniper
7 2 (0.49%) SAP