Management Information System Contracts in London

Management Information Systems
England > London

The table below looks at the prevalence of the term Management Information System in contract job vacancies in London. Included is a benchmarking guide to the contractor rates offered in vacancies that cited Management Information System over the 6 months leading up to 1 May 2025, comparing them to the same period in the previous two years.

6 months to
1 May 2025
Same period 2024 Same period 2023
Rank 146 103 135
Rank change year-on-year -43 +32 +8
Contract jobs citing Management Information System 238 395 522
As % of all contract jobs advertised in London 1.90% 2.22% 1.93%
As % of the Miscellaneous category 5.27% 6.68% 5.38%
Number of daily rates quoted 127 234 276
10th Percentile £220 £225 £300
25th Percentile £316 £350 £425
Median daily rate (50th Percentile) £525 £533 £550
Median % change year-on-year -1.41% -3.18% -
75th Percentile £676 £675 £644
90th Percentile £780 £850 £738
England median daily rate £525 £520 £530
% change year-on-year +0.96% -1.89% +0.95%
Number of hourly rates quoted 10 22 16
10th Percentile £22.24 £11.95 £17.88
25th Percentile £22.65 £16.25 £21.24
Median hourly rate £28.29 £22.75 £22.49
Median % change year-on-year +24.33% +1.18% -18.24%
75th Percentile £33.18 £28.34 £23.73
90th Percentile £93.88 £47.80 £29.38
England median hourly rate £50.00 £22.75 £10.63
% change year-on-year +119.78% +114.02% -53.78%

All Generic Skills
London

Management Information System falls under the General and Transferable Skills category. For comparison with the information above, the following table provides summary statistics for all contract job vacancies requiring generic IT skills in London.

Contract vacancies with a requirement for generic IT skills 4,516 5,909 9,701
As % of all contract IT jobs advertised in London 35.99% 33.14% 35.89%
Number of daily rates quoted 3,054 4,182 6,966
10th Percentile £325 £301 £375
25th Percentile £451 £450 £500
Median daily rate (50th Percentile) £575 £583 £600
Median % change year-on-year -1.29% -2.92% -
75th Percentile £738 £725 £750
90th Percentile £850 £850 £838
England median daily rate £548 £550 £575
% change year-on-year -0.36% -4.35% +4.55%
Number of hourly rates quoted 74 160 109
10th Percentile £15.84 £15.50 £18.93
25th Percentile £22.60 £18.93 £21.24
Median hourly rate £34.50 £26.00 £35.00
Median % change year-on-year +32.69% -25.71% -21.35%
75th Percentile £50.31 £47.81 £64.50
90th Percentile £80.05 £66.78 £83.15
England median hourly rate £33.00 £30.16 £22.50
% change year-on-year +9.42% +34.04% -16.67%

Management Information System
Job Vacancy Trend in London

Job postings citing Management Information System as a proportion of all IT jobs advertised in London.
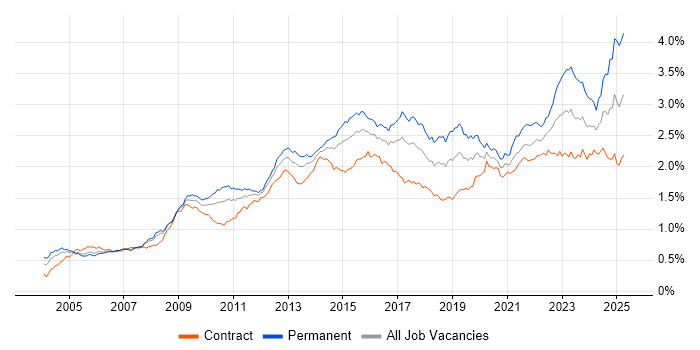
Job vacancy trend for Management Information System in London

Management Information System
Contractor Daily Rate Trend in London

3-month moving average daily rate quoted in jobs citing Management Information System in London.

Daily rate trend for Management Information System in London

Management Information System
Daily Rate Histogram in London

Daily rate distribution for jobs citing Management Information System in London over the 6 months to 1 May 2025.

Daily rate histogram for Management Information System in London

Management Information System
Contractor Hourly Rate Trend in London

3-month moving average hourly rates quoted in jobs citing Management Information System in London.

Hourly rate trend for Management Information System in London

Management Information System
Hourly Rate Histogram in London

Hourly rate distribution of jobs citing Management Information System in London over the 6 months to 1 May 2025.

Hourly rate histogram for Management Information System in London

Management Information System
Contract Job Locations in London

The table below looks at the demand and provides a guide to the median contractor rates quoted in IT jobs citing Management Information System within the London region over the 6 months to 1 May 2025. The 'Rank Change' column provides an indication of the change in demand within each location based on the same 6 month period last year.

Location Rank Change
on Same Period
Last Year
Matching
Contract
IT Job Ads
Median
Daily Rate
Past 6 Months
Median Daily Rate
% Change
on Same Period
Last Year
Live
Jobs
Central London -2 47 £625 +8.70% 23
West London +8 5 £358 +2.14% 15
East London -6 5 £625 -3.85% 3
Management Information System
England

Management Information System
Co-occurring Skills and Capabilities in London by Category

The follow tables expand on the table above by listing co-occurrences grouped by category. The same employment type, locality and period is covered with up to 20 co-occurrences shown in each of the following categories:

Application Platforms
1 12 (5.04%) SharePoint
2 10 (4.20%) CMS
3 5 (2.10%) Confluence
4 3 (1.26%) Drupal
4 3 (1.26%) Microsoft Exchange
5 2 (0.84%) Oracle Workflow
5 2 (0.84%) WebSphere
6 1 (0.42%) Apache
6 1 (0.42%) Headless CMS
6 1 (0.42%) JBoss
6 1 (0.42%) SAS
Applications
1 22 (9.24%) Microsoft Excel
2 17 (7.14%) MS Visio
3 12 (5.04%) Microsoft PowerPoint
4 11 (4.62%) Microsoft Office
5 3 (1.26%) Microsoft Project
6 2 (0.84%) Adobe Creative Suite
6 2 (0.84%) Revit
6 2 (0.84%) Spreadsheet
7 1 (0.42%) Adobe Premiere
7 1 (0.42%) Adobe XD
7 1 (0.42%) AutoCAD
7 1 (0.42%) Camtasia
7 1 (0.42%) Final Cut Pro
7 1 (0.42%) Photoshop
Business Applications
1 4 (1.68%) SAP ERP
2 3 (1.26%) Oracle ERP
3 2 (0.84%) Oracle Financials
3 2 (0.84%) SAP MDG
3 2 (0.84%) SAP S/4HANA
4 1 (0.42%) Remedy ITSM
4 1 (0.42%) Salesforce CRM
4 1 (0.42%) SAP Business ByDesign
4 1 (0.42%) Temenos T24
Cloud Services
1 52 (21.85%) Azure
2 34 (14.29%) AWS
3 20 (8.40%) GCP
4 19 (7.98%) Power Platform
5 17 (7.14%) Microsoft 365
6 9 (3.78%) SaaS
7 8 (3.36%) Google Workspace
8 7 (2.94%) Azure AKS
8 7 (2.94%) Entra ID
8 7 (2.94%) Microsoft Purview
8 7 (2.94%) OCI
9 5 (2.10%) Azure DevOps
9 5 (2.10%) Cloud Computing
9 5 (2.10%) PowerApps
10 4 (1.68%) Azure Sentinel
10 4 (1.68%) IaaS
10 4 (1.68%) PaaS
10 4 (1.68%) SuccessFactors
11 3 (1.26%) Azure Functions
11 3 (1.26%) Dynamics 365
Communications & Networking
1 10 (4.20%) Firewall
2 8 (3.36%) Network Security
3 5 (2.10%) NAS
4 4 (1.68%) DNS
4 4 (1.68%) VPN
5 3 (1.26%) Intranet
5 3 (1.26%) TCP/IP
6 2 (0.84%) DHCP
6 2 (0.84%) HTTP
6 2 (0.84%) Intrusion Detection
6 2 (0.84%) IPsec
6 2 (0.84%) SAN
6 2 (0.84%) Wireless
7 1 (0.42%) BIG-IP
7 1 (0.42%) IGMP
7 1 (0.42%) iSCSI
7 1 (0.42%) SMS
7 1 (0.42%) SMTP
7 1 (0.42%) SNMP
7 1 (0.42%) Wi-Fi
Database & Business Intelligence
1 14 (5.88%) Power BI
2 7 (2.94%) Power Query
3 5 (2.10%) PostgreSQL
3 5 (2.10%) SQL Server
4 4 (1.68%) Metadata
4 4 (1.68%) Oracle Reports
4 4 (1.68%) SQL Server Reporting Services
4 4 (1.68%) Tableau
5 3 (1.26%) Azure SQL Database
5 3 (1.26%) BusinessObjects
5 3 (1.26%) Data Mining
5 3 (1.26%) NoSQL
6 2 (0.84%) Big Data
6 2 (0.84%) Data Warehouse
6 2 (0.84%) MongoDB
6 2 (0.84%) MS Access
6 2 (0.84%) Oracle Database
6 2 (0.84%) Relational Database
6 2 (0.84%) SAP Data Services
7 1 (0.42%) Parquet
Development Applications
1 10 (4.20%) JIRA
2 5 (2.10%) Jenkins
3 3 (1.26%) Git
4 2 (0.84%) CircleCI
4 2 (0.84%) Selenium
4 2 (0.84%) Sonatype Nexus
5 1 (0.42%) Artifactory
5 1 (0.42%) Axure RP
5 1 (0.42%) Balsamiq
5 1 (0.42%) Bitbucket Server
5 1 (0.42%) Browser DevTools
5 1 (0.42%) Cucumber
5 1 (0.42%) GitLab
5 1 (0.42%) Maven
5 1 (0.42%) Postman
5 1 (0.42%) Team Foundation Server
5 1 (0.42%) TeamCity
5 1 (0.42%) TestRail
5 1 (0.42%) Vite
5 1 (0.42%) webpack
General
1 99 (41.60%) Social Skills
2 58 (24.37%) Finance
3 52 (21.85%) Analytical Skills
4 28 (11.76%) Public Sector
5 24 (10.08%) Banking
6 19 (7.98%) Presentation Skills
7 16 (6.72%) Legal
8 8 (3.36%) Investment Banking
8 8 (3.36%) Marketing
9 7 (2.94%) Financial Institution
9 7 (2.94%) Local Government
10 6 (2.52%) Retail
11 5 (2.10%) Back Office
11 5 (2.10%) Documentation Skills
11 5 (2.10%) Organisational Skills
12 4 (1.68%) Police
12 4 (1.68%) Publishing
13 3 (1.26%) Law
13 3 (1.26%) Telecoms
14 2 (0.84%) Military
Job Titles
1 46 (19.33%) Analyst
2 36 (15.13%) Architect
3 26 (10.92%) Senior
4 19 (7.98%) Lead
5 17 (7.14%) Business Analyst
6 16 (6.72%) Solutions Architect
7 14 (5.88%) Consultant
8 12 (5.04%) Developer
9 9 (3.78%) Data Analyst
9 9 (3.78%) Integration Architect
9 9 (3.78%) Security Architect
9 9 (3.78%) Security Engineer
10 8 (3.36%) IT Manager
10 8 (3.36%) Senior Architect
10 8 (3.36%) Technical Architect
10 8 (3.36%) Technical Solutions Architect
10 8 (3.36%) Technology Specialist
11 7 (2.94%) Project Manager
12 5 (2.10%) Senior Developer
12 5 (2.10%) Trainer
Libraries, Frameworks & Software Standards
1 13 (5.46%) Kafka
2 9 (3.78%) CSS
2 9 (3.78%) HTML
3 7 (2.94%) OAuth
3 7 (2.94%) OpenID
3 7 (2.94%) SailPoint
3 7 (2.94%) SAML
4 6 (2.52%) .NET
5 5 (2.10%) Oracle Fusion
6 4 (1.68%) Middleware
6 4 (1.68%) Node.js
6 4 (1.68%) REST
7 3 (1.26%) D3.js
7 3 (1.26%) Elastic Stack
7 3 (1.26%) FIX Protocol
7 3 (1.26%) FpML
7 3 (1.26%) Web Services
7 3 (1.26%) XML
8 2 (0.84%) Bootstrap
8 2 (0.84%) Vue
Miscellaneous
1 14 (5.88%) Security Posture
2 11 (4.62%) Data Centre
3 7 (2.94%) Derivative
3 7 (2.94%) Onboarding
4 6 (2.52%) Legacy Systems
5 5 (2.10%) Foreign Exchange (FX)
6 4 (1.68%) Cyber Threat
6 4 (1.68%) Data Protection Act
6 4 (1.68%) Fixed Income
6 4 (1.68%) Freedom of Information
7 3 (1.26%) BYOD
7 3 (1.26%) Market Risk
7 3 (1.26%) Private Cloud
7 3 (1.26%) Product Ownership
7 3 (1.26%) Public Cloud
7 3 (1.26%) Self-Motivation
7 3 (1.26%) Team-Oriented Environment
8 2 (0.84%) Equities
8 2 (0.84%) Learning Management System
8 2 (0.84%) Life Science
Operating Systems
1 16 (6.72%) Windows
2 15 (6.30%) Linux
3 3 (1.26%) Windows 10
4 2 (0.84%) Red Hat Enterprise Linux
4 2 (0.84%) Windows Server
5 1 (0.42%) Apple iOS
5 1 (0.42%) Mac OS X
5 1 (0.42%) zOS
Processes & Methodologies
1 63 (26.47%) Problem-Solving
2 53 (22.27%) Risk Management
3 42 (17.65%) Project Management
4 39 (16.39%) Computer Science
4 39 (16.39%) Stakeholder Management
5 37 (15.55%) Agile
6 34 (14.29%) Information Security
7 32 (13.45%) Cybersecurity
8 30 (12.61%) Decision-Making
9 28 (11.76%) Information Management
10 25 (10.50%) Data Management
11 24 (10.08%) Continuous Improvement
12 23 (9.66%) Analytics
12 23 (9.66%) DevOps
13 21 (8.82%) Change Management
14 20 (8.40%) Cloud Security
14 20 (8.40%) Roadmaps
15 19 (7.98%) CI/CD
15 19 (7.98%) Collaborative Working
15 19 (7.98%) ERP
Programming Languages
1 31 (13.03%) SQL
2 22 (9.24%) Java
3 19 (7.98%) Python
4 12 (5.04%) PowerShell
5 10 (4.20%) JavaScript
6 6 (2.52%) VBA
7 5 (2.10%) Bash
8 4 (1.68%) TypeScript
9 2 (0.84%) C#
9 2 (0.84%) Kotlin
9 2 (0.84%) Shell Script
10 1 (0.42%) Assembly Language
10 1 (0.42%) C
10 1 (0.42%) JCL
10 1 (0.42%) Perl
10 1 (0.42%) PHP
10 1 (0.42%) PL/SQL
10 1 (0.42%) R
10 1 (0.42%) REXX
10 1 (0.42%) T-SQL
Qualifications
1 62 (26.05%) Degree
2 36 (15.13%) Security Cleared
3 32 (13.45%) SC Cleared
4 24 (10.08%) Computer Science Degree
5 22 (9.24%) CISSP
6 11 (4.62%) CISA
7 10 (4.20%) Microsoft Certification
8 8 (3.36%) Cisco Certification
9 6 (2.52%) CCSP
9 6 (2.52%) GCIH
10 5 (2.10%) (ISC)2 CCSP
10 5 (2.10%) AWS Certification
10 5 (2.10%) CISM
10 5 (2.10%) Master's Degree
10 5 (2.10%) OCP
10 5 (2.10%) Oracle Certification
11 4 (1.68%) Azure Certification
11 4 (1.68%) CESG Certified Professional
11 4 (1.68%) ISO 27001 Lead Auditor
11 4 (1.68%) ISO 27001 Lead Implementer
Quality Assurance & Compliance
1 36 (15.13%) ISO/IEC 27001
2 24 (10.08%) NIST
3 19 (7.98%) GDPR
4 13 (5.46%) Accessibility
4 13 (5.46%) Data Quality
5 11 (4.62%) QA
5 11 (4.62%) Sarbanes-Oxley
5 11 (4.62%) SLA
6 10 (4.20%) GRC
7 6 (2.52%) COBIT
7 6 (2.52%) ISO/IEC 27002 (supersedes ISO/IEC 17799)
7 6 (2.52%) PMO
8 5 (2.10%) HIPAA
9 3 (1.26%) COSO
9 3 (1.26%) ISO/IEC 27005
10 2 (0.84%) Dodd-Frank
10 2 (0.84%) EMIR
10 2 (0.84%) NCSC
10 2 (0.84%) NIST 800
10 2 (0.84%) SOC 2
System Software
1 14 (5.88%) Active Directory
2 4 (1.68%) Docker
3 3 (1.26%) Virtual Desktop
3 3 (1.26%) Virtual Machines
4 2 (0.84%) Hyper-V
4 2 (0.84%) VMware Infrastructure
5 1 (0.42%) Time Sharing Option
5 1 (0.42%) VMware NSX
5 1 (0.42%) vSphere
Systems Management
1 12 (5.04%) Kubernetes
1 12 (5.04%) Terraform
2 4 (1.68%) Ansible
2 4 (1.68%) RSA Archer
3 3 (1.26%) Puppet
3 3 (1.26%) Single Sign-On
4 2 (0.84%) CASB
4 2 (0.84%) Grafana
5 1 (0.42%) Microsoft Intune
5 1 (0.42%) OMEGAMON
5 1 (0.42%) PaperCut
5 1 (0.42%) Podman
5 1 (0.42%) Progress Chef
5 1 (0.42%) Prometheus
Vendors
1 64 (26.89%) Microsoft
2 26 (10.92%) Oracle
3 15 (6.30%) SAP
4 14 (5.88%) ServiceNow
5 12 (5.04%) Google
6 6 (2.52%) Salesforce
7 5 (2.10%) Adobe
7 5 (2.10%) Splunk
8 4 (1.68%) HP
8 4 (1.68%) IBM
9 3 (1.26%) Cisco
9 3 (1.26%) Dell
9 3 (1.26%) Remedy
10 2 (0.84%) Autodesk
10 2 (0.84%) CheckPoint
10 2 (0.84%) CyberArk
10 2 (0.84%) ForgeRock
10 2 (0.84%) Informatica
10 2 (0.84%) VMware
10 2 (0.84%) Workday