Google Contract Job Trends in London

Google
England > London

The table below provides summary statistics for contract job vacancies advertised in London requiring knowledge or experience of Google products and/or services. It includes a benchmarking guide to contractor rates offered in vacancies that cited Google over the 6 months leading up to 16 October 2025, comparing them to the same period in the previous two years.

The figures below represent the IT contractor job market in general and are not representative of contractor rates within Google.

6 months to
16 Oct 2025
Same period 2024 Same period 2023
Rank 95 96 92
Rank change year-on-year +1 -4 +15
Contract jobs citing Google 423 417 536
As % of all contract jobs in London 3.16% 2.60% 2.58%
As % of the Vendors category 6.81% 5.96% 6.26%
Number of daily rates quoted 249 264 371
10th Percentile £275 £316 £288
25th Percentile £413 £420 £450
Median daily rate (50th Percentile) £510 £575 £600
Median % change year-on-year -11.30% -4.17% -
75th Percentile £623 £700 £700
90th Percentile £819 £775 £775
England median daily rate £495 £525 £550
% change year-on-year -5.71% -4.55% -4.35%
Number of hourly rates quoted 10 14 8
10th Percentile £30.79 £27.26 £15.58
25th Percentile £32.25 £30.69 £17.00
Median hourly rate £44.47 £40.75 £25.75
Median % change year-on-year +9.13% +58.25% -20.77%
75th Percentile £63.00 £44.31 £32.50
90th Percentile £64.58 £54.51 £42.25
England median hourly rate £21.92 £70.00 £32.32
% change year-on-year -68.69% +116.58% -7.66%

All Vendors
London

Google falls under the Vendor Products and Services category. For comparison with the information above, the following table provides summary statistics for all contract job vacancies requiring knowledge or experience of all vendor products and services in London.

Contract vacancies with a requirement for knowledge or experience of vendor products and services 6,212 6,997 8,557
As % of all contract IT jobs advertised in London 46.40% 43.59% 41.25%
Number of daily rates quoted 4,035 4,416 5,948
10th Percentile £325 £313 £313
25th Percentile £421 £425 £438
Median daily rate (50th Percentile) £525 £535 £550
Median % change year-on-year -1.87% -2.73% -4.35%
75th Percentile £650 £650 £675
90th Percentile £747 £750 £775
England median daily rate £508 £525 £525
% change year-on-year -3.33% - -2.33%
Number of hourly rates quoted 120 73 114
10th Percentile £17.40 £18.20 £17.00
25th Percentile £23.00 £24.50 £23.00
Median hourly rate £25.15 £35.00 £40.25
Median % change year-on-year -28.14% -13.04% +61.00%
75th Percentile £37.81 £65.00 £60.00
90th Percentile £63.88 £90.15 £76.18
England median hourly rate £25.08 £35.00 £44.50
% change year-on-year -28.36% -21.35% +85.42%

Google
Job Vacancy Trend in London

Historical trend showing the proportion of contract IT job postings citing Google relative to all contract IT jobs advertised in London.
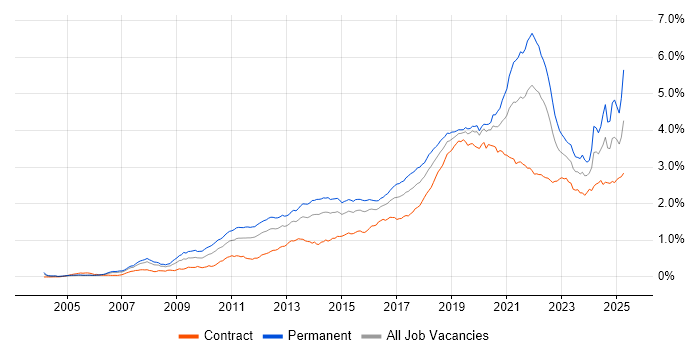
Google job vacancy trend in London

Google
Daily Rate Trend in London

Contractor daily rate distribution trend for jobs in London citing Google.

Contractor daily rate distribution trend for jobs in London citing Google

Google
Daily Rate Histogram in London

Daily rate distribution for jobs citing Google in London over the 6 months to 16 October 2025.

Daily rate histogram for Google in London

Google
Hourly Rate Trend in London

Contractor hourly rate distribution trend for jobs in London citing Google.

Contractor hourly rate distribution trend for jobs in London citing Google

Google
Hourly Rate Histogram in London

Hourly rate distribution of jobs citing Google in London over the 6 months to 16 October 2025.

Hourly rate histogram for Google in London

Google
Contract Job Locations in London

The table below looks at the demand and provides a guide to the median contractor rates quoted in IT jobs citing Google within the London region over the 6 months to 16 October 2025. The 'Rank Change' column provides an indication of the change in demand within each location based on the same 6 month period last year.

Location Rank Change
on Same Period
Last Year
Matching
Contract
IT Job Ads
Median
Daily Rate
Past 6 Months
Median Daily Rate
% Change
on Same Period
Last Year
Live
Jobs
Central London +14 67 £605 +5.22% 125
West London +1 7 £525 +31.25% 19
South London -2 2 £475 -17.39% 2
North London - 1 - - 2
Google
England

Google
Co-Occurring Skills & Capabilities in London by Category

The following tables expand on the one above by listing co-occurrences grouped by category. They cover the same employment type, locality and period, with up to 20 co-occurrences shown in each category:

Application Platforms
1 16 (3.78%) Apache Airflow
2 13 (3.07%) Apache
3 12 (2.84%) Apache Spark
4 9 (2.13%) Confluence
5 7 (1.65%) SharePoint
6 6 (1.42%) Jupyter
7 5 (1.18%) CMS
8 4 (0.95%) Microsoft Exchange
9 3 (0.71%) Ethereum
9 3 (0.71%) Hyperledger
10 2 (0.47%) Tomcat
11 1 (0.24%) Adobe Experience Manager
11 1 (0.24%) Headless CMS
11 1 (0.24%) Luigi
11 1 (0.24%) SAS
11 1 (0.24%) WordPress
Applications
1 12 (2.84%) Microsoft Excel
2 9 (2.13%) Microsoft Office
3 4 (0.95%) Chatbot
3 4 (0.95%) Microsoft Project
4 3 (0.71%) Sketch
4 3 (0.71%) Spreadsheet
5 2 (0.47%) Maya
5 2 (0.47%) MS Visio
6 1 (0.24%) Adobe Illustrator
6 1 (0.24%) Adobe XD
6 1 (0.24%) InDesign
6 1 (0.24%) Microsoft PowerPoint
6 1 (0.24%) Photoshop
Business Applications
1 7 (1.65%) Dynamics CRM
2 2 (0.47%) Salesforce CRM
3 1 (0.24%) Eloqua
3 1 (0.24%) Magento
3 1 (0.24%) Shopify
3 1 (0.24%) WebTrends
Cloud Services
1 268 (63.36%) GCP
2 101 (23.88%) Azure
3 91 (21.51%) AWS
4 57 (13.48%) Google Kubernetes Engine
5 54 (12.77%) GitHub
6 39 (9.22%) Google Workspace
7 29 (6.86%) SaaS
8 28 (6.62%) Cloud Run
9 27 (6.38%) Power Platform
10 25 (5.91%) Google Analytics
11 23 (5.44%) GitHub Actions
12 20 (4.73%) Microsoft 365
13 19 (4.49%) Cloud Functions
14 18 (4.26%) Cloud Computing
15 16 (3.78%) IaaS
16 15 (3.55%) PaaS
17 14 (3.31%) Entra ID
18 13 (3.07%) Figma
18 13 (3.07%) Google Play
18 13 (3.07%) Google Sheets
Communications & Networking
1 22 (5.20%) DNS
2 21 (4.96%) Firewall
3 9 (2.13%) HTTP
4 7 (1.65%) TCP/IP
4 7 (1.65%) VPN
5 4 (0.95%) DHCP
5 4 (0.95%) Network Security
6 3 (0.71%) Bluetooth
6 3 (0.71%) SMTP
6 3 (0.71%) SSL
6 3 (0.71%) Wi-Fi
7 2 (0.47%) DKIM
7 2 (0.47%) DMARC
7 2 (0.47%) Intranet
8 1 (0.24%) BGP
8 1 (0.24%) Broadband
8 1 (0.24%) Extranet
8 1 (0.24%) Internet
8 1 (0.24%) LAN
8 1 (0.24%) VRRP
Database & Business Intelligence
1 77 (18.20%) BigQuery
2 31 (7.33%) Data Warehouse
3 25 (5.91%) Power BI
4 23 (5.44%) Big Data
5 20 (4.73%) Tableau
6 18 (4.26%) Looker
7 15 (3.55%) Data Lake
8 11 (2.60%) Amazon Redshift
8 11 (2.60%) PostgreSQL
9 10 (2.36%) Metadata
10 8 (1.89%) MongoDB
10 8 (1.89%) NoSQL
10 8 (1.89%) Snowflake Schema
10 8 (1.89%) SQL Server
11 7 (1.65%) Hadoop
12 6 (1.42%) Mixpanel
13 5 (1.18%) Electronic Patient Records
13 5 (1.18%) MySQL
13 5 (1.18%) Redis
14 4 (0.95%) SQL Server Integration Services
Development Applications
1 46 (10.87%) Jenkins
2 36 (8.51%) Git
3 19 (4.49%) GitLab
4 18 (4.26%) JIRA
5 14 (3.31%) SonarQube
6 9 (2.13%) Gradle
7 8 (1.89%) Sonatype Nexus
8 7 (1.65%) Cypress.io
8 7 (1.65%) Maven
9 6 (1.42%) Selenium
9 6 (1.42%) Visual Website Optimizer
10 4 (0.95%) Browser DevTools
10 4 (0.95%) ER Studio
10 4 (0.95%) Vite
10 4 (0.95%) webpack
11 3 (0.71%) Android Studio
11 3 (0.71%) CircleCI
11 3 (0.71%) TeamCity
12 2 (0.47%) Eclipse
12 2 (0.47%) JUnit
General
1 122 (28.84%) Social Skills
2 106 (25.06%) Finance
3 55 (13.00%) Analytical Skills
4 49 (11.58%) Banking
5 43 (10.17%) Marketing
6 17 (4.02%) Public Sector
7 15 (3.55%) Pharmaceutical
8 13 (3.07%) Retail
8 13 (3.07%) Telecoms
9 12 (2.84%) Inclusion and Diversity
10 10 (2.36%) Advertising
11 9 (2.13%) Financial Institution
11 9 (2.13%) Legal
11 9 (2.13%) Presentation Skills
12 8 (1.89%) Investment Banking
12 8 (1.89%) Publishing
13 7 (1.65%) Influencing Skills
14 4 (0.95%) Documentation Skills
15 3 (0.71%) Digital Health
15 3 (0.71%) Organisational Skills
Job Titles
1 63 (14.89%) Architect
2 53 (12.53%) Senior
3 49 (11.58%) GCP Engineer
4 43 (10.17%) Developer
5 39 (9.22%) Analyst
6 29 (6.86%) DevOps Engineer
7 25 (5.91%) Lead
8 23 (5.44%) Solutions Architect
9 21 (4.96%) Data Engineer
9 21 (4.96%) GCP DevOps
9 21 (4.96%) GCP DevOps Engineer
10 17 (4.02%) GCP Architect
11 16 (3.78%) Cloud Engineer
12 15 (3.55%) Security Engineer
13 14 (3.31%) Data Analyst
13 14 (3.31%) Senior Architect
14 13 (3.07%) Artificial Intelligence Engineer
14 13 (3.07%) Software Engineer
15 11 (2.60%) Enterprise Architect
16 10 (2.36%) Data Architect
Libraries, Frameworks & Software Standards
1 29 (6.86%) RESTful
2 27 (6.38%) React
3 20 (4.73%) Node.js
4 19 (4.49%) FastAPI
5 17 (4.02%) CSS
5 17 (4.02%) HTML
5 17 (4.02%) Kafka
6 14 (3.31%) React Native
7 13 (3.07%) OAuth
8 12 (2.84%) LangGraph
8 12 (2.84%) pytest
8 12 (2.84%) Spring
9 11 (2.60%) TensorFlow
10 10 (2.36%) Redux
11 9 (2.13%) AngularJS
11 9 (2.13%) HTML5
11 9 (2.13%) Next.js
11 9 (2.13%) PyTorch
11 9 (2.13%) Spring Boot
12 8 (1.89%) LangChain
Miscellaneous
1 58 (13.71%) Cloud Native
2 21 (4.96%) Onboarding
3 19 (4.49%) Mobile App
4 14 (3.31%) AI Agents
4 14 (3.31%) Life Science
5 13 (3.07%) Genomics
6 12 (2.84%) Analytical Mindset
7 11 (2.60%) Data Centre
7 11 (2.60%) Distributed Systems
8 9 (2.13%) Hybrid Cloud
8 9 (2.13%) Legacy Systems
8 9 (2.13%) Social Media
9 8 (1.89%) Data Protection Act
9 8 (1.89%) NHS
10 7 (1.65%) Data Structures
10 7 (1.65%) Management Information System
10 7 (1.65%) Product Ownership
10 7 (1.65%) Virtual Team
11 6 (1.42%) Algorithms
12 5 (1.18%) Self-Motivation
Operating Systems
1 21 (4.96%) Android
2 18 (4.26%) Linux
3 15 (3.55%) Apple iOS
4 14 (3.31%) Windows
5 8 (1.89%) Unix
6 6 (1.42%) Mac OS
7 2 (0.47%) Mac OS X
7 2 (0.47%) Windows 10
7 2 (0.47%) Windows 8
7 2 (0.47%) Windows XP
8 1 (0.24%) Windows Server
8 1 (0.24%) Windows Server 2003
Processes & Methodologies
1 125 (29.55%) DevOps
2 120 (28.37%) CI/CD
3 104 (24.59%) Agile
4 86 (20.33%) Analytics
5 78 (18.44%) Problem-Solving
6 74 (17.49%) AI
7 73 (17.26%) Containerisation
8 60 (14.18%) Infrastructure as Code
9 58 (13.71%) Migration
10 53 (12.53%) Data Modelling
10 53 (12.53%) Machine Learning
11 42 (9.93%) ETL
12 40 (9.46%) User Experience
13 38 (8.98%) Data Integration
14 37 (8.75%) Cloud Security
14 37 (8.75%) Microservices
15 34 (8.04%) Business Intelligence
15 34 (8.04%) Data Governance
16 33 (7.80%) Test Automation
17 32 (7.57%) Stakeholder Management
Programming Languages
1 135 (31.91%) Python
2 84 (19.86%) SQL
3 47 (11.11%) Java
4 35 (8.27%) JavaScript
5 25 (5.91%) TypeScript
6 24 (5.67%) Bash
7 22 (5.20%) PowerShell
8 9 (2.13%) Go
8 9 (2.13%) Kotlin
9 8 (1.89%) Kusto Query Language
9 8 (1.89%) R
9 8 (1.89%) Shell Script
10 6 (1.42%) Bicep
10 6 (1.42%) Ruby
11 5 (1.18%) C++
12 4 (0.95%) Groovy
12 4 (0.95%) Scala
13 3 (0.71%) Swift
14 2 (0.47%) Data Analysis Expressions
14 2 (0.47%) Rust
Qualifications
1 44 (10.40%) Degree
2 23 (5.44%) Security Cleared
3 21 (4.96%) SC Cleared
4 14 (3.31%) Computer Science Degree
5 11 (2.60%) CISSP
6 5 (1.18%) Cisco Certification
7 4 (0.95%) (ISC)2 CCSP
7 4 (0.95%) Azure Certification
7 4 (0.95%) CCSP
7 4 (0.95%) MCP
8 3 (0.71%) AWS Certification
8 3 (0.71%) BPSS Clearance
8 3 (0.71%) CCNA
8 3 (0.71%) CEH
8 3 (0.71%) CompTIA Security+
8 3 (0.71%) GCIH
8 3 (0.71%) Master's Degree
8 3 (0.71%) OSCP
9 2 (0.47%) DV Cleared
9 2 (0.47%) Network+ Certification
Quality Assurance & Compliance
1 27 (6.38%) GDPR
2 25 (5.91%) Data Quality
3 20 (4.73%) Accessibility
4 16 (3.78%) ISO/IEC 27001
5 8 (1.89%) QA
6 7 (1.65%) NIST
7 6 (1.42%) SOC 2
7 6 (1.42%) WCAG
8 4 (0.95%) HIPAA
8 4 (0.95%) NCSC
9 3 (0.71%) HL7
9 3 (0.71%) SLA
10 2 (0.47%) California Consumer Privacy Act
10 2 (0.47%) Cyber Essentials
10 2 (0.47%) DICOM
10 2 (0.47%) GRC
10 2 (0.47%) Section 508
11 1 (0.24%) Cyber Essentials PLUS
11 1 (0.24%) EU AI Act
11 1 (0.24%) LOINC
System Software
1 89 (21.04%) Docker
2 17 (4.02%) Active Directory
3 5 (1.18%) Squid
3 5 (1.18%) VMware Infrastructure
4 4 (0.95%) Snort
5 2 (0.47%) Firmware
5 2 (0.47%) vSphere
5 2 (0.47%) XenApp
6 1 (0.24%) BitLocker
6 1 (0.24%) Hyper-V
6 1 (0.24%) KVM
6 1 (0.24%) Microsoft App-V
6 1 (0.24%) Terminal Services
6 1 (0.24%) VMware ESXi
Systems Management
1 88 (20.80%) Kubernetes
2 74 (17.49%) Terraform
3 15 (3.55%) Ansible
4 12 (2.84%) Argo
5 9 (2.13%) Grafana
6 8 (1.89%) Single Sign-On
7 7 (1.65%) Istio
7 7 (1.65%) Prometheus
7 7 (1.65%) Puppet
8 6 (1.42%) Microsoft Intune
9 4 (0.95%) Nessus
9 4 (0.95%) Nexpose
9 4 (0.95%) Suricata
10 3 (0.71%) NetBackup
11 2 (0.47%) CSIRT
11 2 (0.47%) Jamf Pro
11 2 (0.47%) McAfee ePO
11 2 (0.47%) Norton AntiVirus
11 2 (0.47%) Oracle RMAN
11 2 (0.47%) Systems Management Server (SMS)
Vendors
1 79 (18.68%) Microsoft
2 17 (4.02%) OpenAI
2 17 (4.02%) Splunk
3 16 (3.78%) Salesforce
4 13 (3.07%) Adobe
4 13 (3.07%) Databricks
5 12 (2.84%) Apple
6 11 (2.60%) Cisco
7 10 (2.36%) Amplitude
7 10 (2.36%) CrowdStrike
7 10 (2.36%) Okta
7 10 (2.36%) Oracle
7 10 (2.36%) Palo Alto
7 10 (2.36%) SAP
8 9 (2.13%) MuleSoft
9 8 (1.89%) Optimizely
10 7 (1.65%) Informatica
10 7 (1.65%) VMware
11 6 (1.42%) Hotjar
11 6 (1.42%) Qualys