Mentoring Jobs in the Midlands

Mentorship
England > Midlands

The table below provides summary statistics for permanent job vacancies advertised in the Midlands requiring Mentoring skills. It includes a benchmarking guide to the annual salaries offered in vacancies that cited Mentoring over the 6 months leading up to 12 May 2025, comparing them to the same period in the previous two years.

6 months to
12 May 2025
Same period 2024 Same period 2023
Rank 14 21 8
Rank change year-on-year +7 -13 +27
Permanent jobs citing Mentoring 649 850 1,463
As % of all permanent jobs advertised in the Midlands 9.18% 7.15% 15.82%
As % of the Processes & Methodologies category 10.02% 8.72% 16.39%
Number of salaries quoted 228 600 262
10th Percentile £31,100 £24,000 £37,500
25th Percentile £46,250 £35,000 £42,500
Median annual salary (50th Percentile) £60,000 £50,000 £57,500
Median % change year-on-year +20.00% -13.04% +9.52%
75th Percentile £72,500 £67,625 £72,500
90th Percentile £77,875 £84,964 £80,000
England median annual salary £65,000 £62,500 £70,000
% change year-on-year +4.00% -10.71% +7.69%

All Process and Methodology Skills
Midlands

Mentoring falls under the Processes and Methodologies category. For comparison with the information above, the following table provides summary statistics for all permanent job vacancies requiring process or methodology skills in the Midlands.

Permanent vacancies with a requirement for process or methodology skills 6,479 9,747 8,924
As % of all permanent jobs advertised in the Midlands 91.67% 82.00% 96.52%
Number of salaries quoted 2,672 7,160 4,510
10th Percentile £27,500 £26,250 £30,000
25th Percentile £35,000 £34,834 £38,362
Median annual salary (50th Percentile) £50,000 £47,500 £52,500
Median % change year-on-year +5.26% -9.52% +5.00%
75th Percentile £63,750 £62,270 £67,500
90th Percentile £76,250 £75,000 £77,500
England median annual salary £57,500 £55,000 £62,500
% change year-on-year +4.55% -12.00% +4.17%

Mentoring
Job Vacancy Trend in the Midlands

Job postings citing Mentoring as a proportion of all IT jobs advertised in the Midlands.
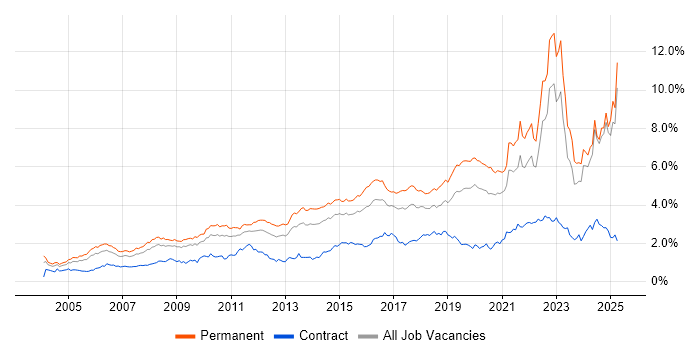
Job vacancy trend for Mentoring in the Midlands

Mentoring
Salary Trend in the Midlands

3-month moving average salary quoted in jobs citing Mentoring in the Midlands.

Salary trend for Mentoring in the Midlands

Mentoring
Salary Histogram in the Midlands

Salary distribution for jobs citing Mentoring in the Midlands over the 6 months to 12 May 2025.

Salary histogram for Mentoring in the Midlands

Mentoring
Job Locations in the Midlands

The table below looks at the demand and provides a guide to the median salaries quoted in IT jobs citing Mentoring within the Midlands region over the 6 months to 12 May 2025. The 'Rank Change' column provides an indication of the change in demand within each location based on the same 6 month period last year.

Location Rank Change
on Same Period
Last Year
Matching
Permanent
IT Job Ads
Median Salary
Past 6 Months
Median Salary
% Change
on Same Period
Last Year
Live
Jobs
East Midlands +12 350 £59,000 +32.76% 162
West Midlands -9 297 £62,500 +10.87% 225
Mentoring
England

Mentoring
Co-occurring Skills and Capabilities in the Midlands by Category

The follow tables expand on the table above by listing co-occurrences grouped by category. The same employment type, locality and period is covered with up to 20 co-occurrences shown in each of the following categories:

Application Platforms
1 15 (2.31%) Microsoft Exchange
2 3 (0.46%) CMS
2 3 (0.46%) SharePoint
3 2 (0.31%) Apache
3 2 (0.31%) Confluence
3 2 (0.31%) Headless CMS
3 2 (0.31%) Jupyter
3 2 (0.31%) Oracle SOA Suite
4 1 (0.15%) Apache Spark
4 1 (0.15%) Mendix
Applications
1 21 (3.24%) Microsoft Office
2 9 (1.39%) Microsoft Excel
3 6 (0.92%) Microsoft PowerPoint
4 2 (0.31%) Adobe Creative Suite
4 2 (0.31%) Adobe XD
4 2 (0.31%) Microsoft Project
4 2 (0.31%) Moqups
4 2 (0.31%) Sketch
5 1 (0.15%) ProjectWise
Business Applications
1 22 (3.39%) Dynamics AX
2 10 (1.54%) Oracle EBS
3 8 (1.23%) Salesforce CRM
4 7 (1.08%) SAP S/4HANA
5 4 (0.62%) Oracle Applications
5 4 (0.62%) Oracle ERP
5 4 (0.62%) PeopleSoft HCM
6 3 (0.46%) Magento
6 3 (0.46%) Shopify
7 1 (0.15%) Dynamics CRM
7 1 (0.15%) Maximo
7 1 (0.15%) SAP MDM
Cloud Services
1 111 (17.10%) Azure
2 77 (11.86%) AWS
3 60 (9.24%) SaaS
4 35 (5.39%) Microsoft 365
5 22 (3.39%) Azure DevOps
6 20 (3.08%) PaaS
7 17 (2.62%) Entra ID
8 12 (1.85%) IaaS
9 9 (1.39%) GitHub
9 9 (1.39%) GitHub Actions
9 9 (1.39%) Serverless
10 8 (1.23%) AWS CloudFormation
10 8 (1.23%) GCP
10 8 (1.23%) Miro
11 7 (1.08%) AWS Lambda
11 7 (1.08%) Power Platform
12 6 (0.92%) Figma
13 5 (0.77%) Azure Data Factory
14 4 (0.62%) Amazon S3
14 4 (0.62%) Dynamics 365
Communications & Networking
1 180 (27.73%) Wi-Fi
1 180 (27.73%) Wireless
2 179 (27.58%) 5G
2 179 (27.58%) Bluetooth
2 179 (27.58%) GSM
2 179 (27.58%) LTE
2 179 (27.58%) UMTS
3 35 (5.39%) Network Security
4 28 (4.31%) Internet
5 27 (4.16%) WLAN
6 21 (3.24%) Broadband
7 20 (3.08%) Firewall
7 20 (3.08%) VPN
8 19 (2.93%) LAN
8 19 (2.93%) WAN
9 17 (2.62%) TCP/IP
10 4 (0.62%) DNS
11 3 (0.46%) DHCP
12 2 (0.31%) HTTP
12 2 (0.31%) IPsec
Database & Business Intelligence
1 24 (3.70%) SQL Server
2 18 (2.77%) NoSQL
3 12 (1.85%) Tableau
4 9 (1.39%) MongoDB
5 8 (1.23%) Data Lake
6 7 (1.08%) Elasticsearch
7 6 (0.92%) Data Warehouse
7 6 (0.92%) Relational Database
8 5 (0.77%) Big Data
8 5 (0.77%) Oracle Database
8 5 (0.77%) Power BI
8 5 (0.77%) RDBMS
9 4 (0.62%) Azure SQL Database
9 4 (0.62%) MySQL
10 3 (0.46%) Amazon Redshift
10 3 (0.46%) PostgreSQL
11 2 (0.31%) DynamoDB
11 2 (0.31%) Metadata
12 1 (0.15%) Azure SQL Data Warehouse
12 1 (0.15%) Metadata Repository
Development Applications
1 54 (8.32%) JIRA
2 44 (6.78%) Selenium
3 32 (4.93%) Cucumber
4 24 (3.70%) SonarQube
5 18 (2.77%) Git
6 17 (2.62%) Bitbucket
7 16 (2.47%) GitLab
7 16 (2.47%) Maven
7 16 (2.47%) Sonatype Nexus
8 15 (2.31%) Robot Framework
9 7 (1.08%) Postman
10 4 (0.62%) Jaeger
10 4 (0.62%) JUnit
10 4 (0.62%) Storybook
11 2 (0.31%) Cypress.io
11 2 (0.31%) Eclipse
11 2 (0.31%) Eclipse RCP
11 2 (0.31%) ERwin
11 2 (0.31%) Jenkins
11 2 (0.31%) NUnit
General
1 181 (27.89%) Electronics
2 115 (17.72%) Finance
3 112 (17.26%) Social Skills
4 91 (14.02%) Inclusion and Diversity
5 85 (13.10%) Retail
6 61 (9.40%) Telecoms
7 45 (6.93%) Games
8 44 (6.78%) Manufacturing
9 34 (5.24%) Public Sector
10 32 (4.93%) Analytical Skills
11 31 (4.78%) Marketing
12 19 (2.93%) Banking
13 17 (2.62%) Investment Banking
14 16 (2.47%) Corporate Banking
14 16 (2.47%) Law
15 13 (2.00%) Organisational Skills
16 11 (1.69%) Presentation Skills
17 10 (1.54%) Billing
18 6 (0.92%) Legal
19 3 (0.46%) Multimedia
Job Titles
1 196 (30.20%) Test Engineer
2 179 (27.58%) Electronics Engineer
2 179 (27.58%) Electronics Test Engineer
3 101 (15.56%) Lead
4 91 (14.02%) Senior
5 53 (8.17%) IT Support
6 47 (7.24%) Support Engineer
7 29 (4.47%) IT Engineer
8 28 (4.31%) IT Support Engineer
9 27 (4.16%) Software Engineer
10 25 (3.85%) Developer
11 23 (3.54%) Consultant
11 23 (3.54%) Risk Manager
11 23 (3.54%) Technology Risk Manager
12 21 (3.24%) Architect
12 21 (3.24%) Automation Engineer
13 20 (3.08%) Team Leader
14 19 (2.93%) Analyst
15 18 (2.77%) Validation Engineer
16 17 (2.62%) Oracle Consultant
Libraries, Frameworks & Software Standards
1 36 (5.55%) React
2 25 (3.85%) HTML
3 24 (3.70%) CSS
4 23 (3.54%) REST
5 21 (3.24%) Jest
5 21 (3.24%) Spring
6 20 (3.08%) .NET
6 20 (3.08%) RESTful
7 19 (2.93%) HTML5
7 19 (2.93%) Kafka
7 19 (2.93%) Spring Boot
8 18 (2.77%) CSS3
8 18 (2.77%) Redux
9 17 (2.62%) Node.js
10 16 (2.47%) JPA
10 16 (2.47%) Sass
11 11 (1.69%) AngularJS
12 9 (1.39%) ARM Templates
13 8 (1.23%) Azure Blueprints
13 8 (1.23%) Vue
Miscellaneous
1 224 (34.51%) Driving Licence
2 45 (6.93%) Blockchain
2 45 (6.93%) Robotics
3 40 (6.16%) Management Information System
4 39 (6.01%) Product Ownership
5 35 (5.39%) Onboarding
6 28 (4.31%) Enterprise Software
7 20 (3.08%) SCADA
8 18 (2.77%) Linux Command Line
8 18 (2.77%) Operational Technology
9 17 (2.62%) Hybrid Cloud
9 17 (2.62%) Self-Motivation
10 15 (2.31%) e-Learning
11 11 (1.69%) Social Media
12 8 (1.23%) Legacy Code
13 7 (1.08%) Mobile App
13 7 (1.08%) NHS
14 6 (0.92%) Legacy Systems
15 5 (0.77%) Algorithms
15 5 (0.77%) Cloud Native
Operating Systems
1 83 (12.79%) Windows
2 69 (10.63%) Linux
3 28 (4.31%) Windows Server
4 15 (2.31%) Windows Server 2016
4 15 (2.31%) Windows Server 2019
5 5 (0.77%) Android
5 5 (0.77%) Apple iOS
6 4 (0.62%) Unix
7 3 (0.46%) Red Hat Enterprise Linux
8 2 (0.31%) Oracle Linux
9 1 (0.15%) Windows 10
Processes & Methodologies
1 315 (48.54%) Coaching
2 209 (32.20%) Validation
3 182 (28.04%) Test Strategy
4 180 (27.73%) Customer Requirements
5 179 (27.58%) Verification and Validation
6 146 (22.50%) Agile
7 118 (18.18%) Problem-Solving
8 88 (13.56%) Analytics
9 85 (13.10%) DevOps
10 79 (12.17%) Artificial Intelligence
11 71 (10.94%) Computer Science
12 69 (10.63%) Test Automation
13 66 (10.17%) Software Engineering
14 64 (9.86%) Roadmaps
15 53 (8.17%) Data Analytics
16 49 (7.55%) Cybersecurity
16 49 (7.55%) ITIL
17 47 (7.24%) Continuous Improvement
17 47 (7.24%) Project Delivery
18 46 (7.09%) Creative Thinking
Programming Languages
1 66 (10.17%) SQL
2 65 (10.02%) JavaScript
3 49 (7.55%) Python
4 37 (5.70%) PowerShell
5 34 (5.24%) C#
5 34 (5.24%) Java
6 31 (4.78%) TypeScript
7 23 (3.54%) Bash
8 13 (2.00%) PHP
9 6 (0.92%) Go
10 3 (0.46%) PL/SQL
11 2 (0.31%) Ada
11 2 (0.31%) C
11 2 (0.31%) C++
11 2 (0.31%) Rust
11 2 (0.31%) Shell Script
12 1 (0.15%) Kotlin
12 1 (0.15%) Perl
12 1 (0.15%) VB.NET
Qualifications
1 324 (49.92%) Degree
2 182 (28.04%) HND
3 48 (7.40%) Computer Science Degree
4 40 (6.16%) CCNA
4 40 (6.16%) Cisco Certification
5 36 (5.55%) Microsoft Certification
6 35 (5.39%) CCNP
6 35 (5.39%) MCP
6 35 (5.39%) MCSE
6 35 (5.39%) Security Cleared
7 27 (4.16%) LPIC
8 22 (3.39%) CISA
8 22 (3.39%) ISACA
9 19 (2.93%) ISTQB
10 18 (2.77%) SC Cleared
11 17 (2.62%) BPSS Clearance
12 11 (1.69%) DBS Check
13 10 (1.54%) Master's Degree
14 9 (1.39%) Azure Certification
14 9 (1.39%) CISSP
Quality Assurance & Compliance
1 71 (10.94%) QA
2 45 (6.93%) ITGC
3 21 (3.24%) Accessibility
4 11 (1.69%) ISO/IEC 27001
5 8 (1.23%) NCSC
6 7 (1.08%) Data Quality
6 7 (1.08%) GDPR
7 3 (0.46%) Cyber Essentials
7 3 (0.46%) PMO
7 3 (0.46%) SLA
8 2 (0.31%) NIST
8 2 (0.31%) PMBOK
9 1 (0.15%) GMP
9 1 (0.15%) GRC
System Software
1 42 (6.47%) Docker
2 36 (5.55%) Active Directory
3 17 (2.62%) VMware Infrastructure
4 15 (2.31%) XenApp
Systems Management
1 40 (6.16%) Kubernetes
2 17 (2.62%) Terraform
3 16 (2.47%) Ansible
3 16 (2.47%) Microsoft Intune
4 5 (0.77%) Prometheus
5 4 (0.62%) Argo
5 4 (0.62%) Kustomize
6 3 (0.46%) Single Sign-On
7 2 (0.31%) Autotask
7 2 (0.31%) Progress Chef
7 2 (0.31%) Puppet
8 1 (0.15%) CSIRT
8 1 (0.15%) Grafana
8 1 (0.15%) Marathon
8 1 (0.15%) SCCM
8 1 (0.15%) SCOM
Vendors
1 81 (12.48%) Microsoft
2 52 (8.01%) Oracle
3 46 (7.09%) Cisco
4 34 (5.24%) SAP
5 18 (2.77%) Red Hat
6 17 (2.62%) VMware
7 16 (2.47%) Commvault
7 16 (2.47%) Databricks
7 16 (2.47%) Solace
8 15 (2.31%) CheckPoint
8 15 (2.31%) Citrix
8 15 (2.31%) IBM
8 15 (2.31%) Meraki
8 15 (2.31%) SonicWALL
9 11 (1.69%) Google
9 11 (1.69%) Salesforce
10 6 (0.92%) OpenAI
10 6 (0.92%) ServiceNow
11 4 (0.62%) Hyperion
11 4 (0.62%) JD Edwards