Computer Science Jobs in the North of England

Computer Science
England > North of England

The table below provides summary statistics for permanent job vacancies advertised in the North of England requiring Computer Science skills. It includes a benchmarking guide to the annual salaries offered in vacancies that cited Computer Science over the 6 months leading up to 29 May 2025, comparing them to the same period in the previous two years.

6 months to
29 May 2025
Same period 2024 Same period 2023
Rank 70 54 127
Rank change year-on-year -16 +73 -49
Permanent jobs citing Computer Science 486 663 447
As % of all permanent jobs advertised in the North of England 4.19% 3.64% 2.70%
As % of the Processes & Methodologies category 4.44% 4.45% 2.79%
Number of salaries quoted 285 506 281
10th Percentile £32,500 £27,500 £36,250
25th Percentile £33,250 £34,000 £40,000
Median annual salary (50th Percentile) £45,000 £47,750 £55,000
Median % change year-on-year -5.76% -13.18% +37.50%
75th Percentile £72,750 £67,250 £60,899
90th Percentile £80,100 £85,000 £75,000
England median annual salary £60,000 £60,000 £65,000
% change year-on-year - -7.69% +8.33%

All Process and Methodology Skills
North of England

Computer Science falls under the Processes and Methodologies category. For comparison with the information above, the following table provides summary statistics for all permanent job vacancies requiring process or methodology skills in the North of England.

Permanent vacancies with a requirement for process or methodology skills 10,934 14,895 16,009
As % of all permanent jobs advertised in the North of England 94.33% 81.86% 96.70%
Number of salaries quoted 5,434 11,380 7,847
10th Percentile £25,087 £27,500 £31,250
25th Percentile £37,500 £37,074 £40,000
Median annual salary (50th Percentile) £50,055 £50,000 £55,000
Median % change year-on-year +0.11% -9.09% +10.00%
75th Percentile £61,992 £65,000 £70,000
90th Percentile £77,500 £80,000 £81,250
England median annual salary £57,500 £55,000 £62,500
% change year-on-year +4.55% -12.00% +4.17%

Computer Science
Job Vacancy Trend in the North of England

Job postings citing Computer Science as a proportion of all IT jobs advertised in the North of England.
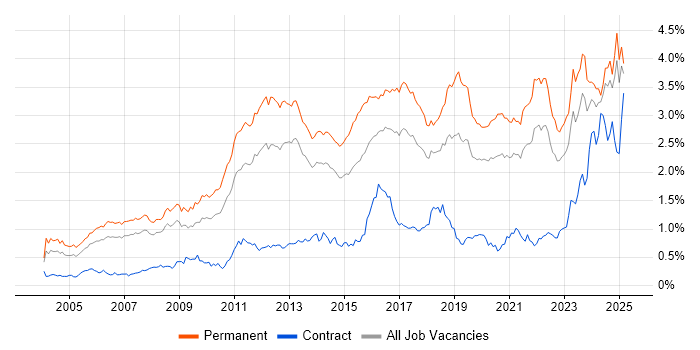
Job vacancy trend for Computer Science in the North of England

Computer Science
Salary Trend in the North of England

3-month moving average salary quoted in jobs citing Computer Science in the North of England.

Salary trend for Computer Science in the North of England

Computer Science
Salary Histogram in the North of England

Salary distribution for jobs citing Computer Science in the North of England over the 6 months to 29 May 2025.

Salary histogram for Computer Science in the North of England

Computer Science
Job Locations in the North of England

The table below looks at the demand and provides a guide to the median salaries quoted in IT jobs citing Computer Science within the North of England region over the 6 months to 29 May 2025. The 'Rank Change' column provides an indication of the change in demand within each location based on the same 6 month period last year.

Location Rank Change
on Same Period
Last Year
Matching
Permanent
IT Job Ads
Median Salary
Past 6 Months
Median Salary
% Change
on Same Period
Last Year
Live
Jobs
North West -64 235 £52,500 +5.00% 248
Yorkshire +24 211 £42,000 -6.67% 112
North East +22 44 £56,500 +15.94% 63
Computer Science
England

Computer Science
Co-occurring Skills and Capabilities in the North of England by Category

The follow tables expand on the table above by listing co-occurrences grouped by category. The same employment type, locality and period is covered with up to 20 co-occurrences shown in each of the following categories:

Application Platforms
1 6 (1.23%) Apache Spark
2 4 (0.82%) Apache
2 4 (0.82%) Jupyter
2 4 (0.82%) SAS
3 3 (0.62%) Confluence
3 3 (0.62%) SharePoint
3 3 (0.62%) WordPress
4 2 (0.41%) Apache Airflow
4 2 (0.41%) CMS
5 1 (0.21%) GemFire
Applications
1 48 (9.88%) Chatbot
2 21 (4.32%) Simulink
3 15 (3.09%) Microsoft Project
4 14 (2.88%) Trello
5 6 (1.23%) Microsoft Office
5 6 (1.23%) MS Visio
6 4 (0.82%) Microsoft Excel
Business Applications
1 21 (4.32%) Teamcenter
2 3 (0.62%) Markit EDM
3 1 (0.21%) Dynamics CRM
3 1 (0.21%) Oracle Applications
3 1 (0.21%) SAP Business One
Cloud Services
1 49 (10.08%) Azure
2 39 (8.02%) AWS
3 14 (2.88%) GCP
4 13 (2.67%) Power Platform
5 10 (2.06%) Serverless
6 6 (1.23%) Dynamics 365
7 5 (1.03%) SaaS
8 4 (0.82%) Amazon CloudWatch
8 4 (0.82%) AWS Lambda
8 4 (0.82%) Azure Data Factory
8 4 (0.82%) Azure Functions
8 4 (0.82%) Cloud Computing
8 4 (0.82%) Microsoft Copilot
9 3 (0.62%) Amazon EC2
9 3 (0.62%) AWS Fargate
9 3 (0.62%) Azure DevOps
9 3 (0.62%) Entra ID
10 2 (0.41%) GitHub
10 2 (0.41%) Google Analytics
11 1 (0.21%) Azure Stack
Communications & Networking
1 17 (3.50%) Firewall
2 13 (2.67%) TCP/IP
3 11 (2.26%) Network Security
4 9 (1.85%) DNS
4 9 (1.85%) Intrusion Detection
5 7 (1.44%) LAN
5 7 (1.44%) VPN
5 7 (1.44%) WAN
6 6 (1.23%) Cisco Nexus
6 6 (1.23%) DWDM
6 6 (1.23%) SAN
7 5 (1.03%) Broadband
8 4 (0.82%) BGP
8 4 (0.82%) EIGRP
8 4 (0.82%) OSPF
9 3 (0.62%) Cisco IOS
9 3 (0.62%) Internet
10 2 (0.41%) VoIP
11 1 (0.21%) DHCP
11 1 (0.21%) Ethernet
Database & Business Intelligence
1 21 (4.32%) SQL Server
2 14 (2.88%) MySQL
3 12 (2.47%) Data Warehouse
4 11 (2.26%) Relational Database
5 10 (2.06%) Big Data
6 9 (1.85%) Data Lake
6 9 (1.85%) NoSQL
7 8 (1.65%) MongoDB
7 8 (1.65%) Power BI
8 6 (1.23%) Tableau
9 5 (1.03%) PostgreSQL
10 4 (0.82%) Azure SQL Database
10 4 (0.82%) Hadoop
10 4 (0.82%) Oracle Database
11 3 (0.62%) Dremio
12 1 (0.21%) Apache Ignite
12 1 (0.21%) BigQuery
12 1 (0.21%) Elasticsearch
12 1 (0.21%) Looker
12 1 (0.21%) Metadata
Development Applications
1 24 (4.94%) JIRA
2 21 (4.32%) Rational DOORS
3 13 (2.67%) Git
4 6 (1.23%) Sonatype Nexus
5 5 (1.03%) Jenkins
6 2 (0.41%) GitLab
6 2 (0.41%) TeamCity
7 1 (0.21%) Artifactory
7 1 (0.21%) Babel
7 1 (0.21%) Bitbucket
7 1 (0.21%) CircleCI
7 1 (0.21%) Eclipse
7 1 (0.21%) JUnit
7 1 (0.21%) LabVIEW
7 1 (0.21%) NetBeans
7 1 (0.21%) Octopus Deploy
7 1 (0.21%) Oracle Forms
7 1 (0.21%) SonarQube
7 1 (0.21%) Visual Studio
7 1 (0.21%) webpack
General
1 163 (33.54%) Social Skills
2 73 (15.02%) Finance
3 43 (8.85%) Esports
4 40 (8.23%) Analytical Skills
5 26 (5.35%) Electronics
6 22 (4.53%) Aerospace
7 18 (3.70%) Advertising
8 17 (3.50%) Manufacturing
9 12 (2.47%) Inclusion and Diversity
9 12 (2.47%) Law
9 12 (2.47%) Retail
10 11 (2.26%) Legal
10 11 (2.26%) Marketing
11 6 (1.23%) Automotive
12 5 (1.03%) Documentation Skills
13 4 (0.82%) Banking
13 4 (0.82%) Public Sector
14 3 (0.62%) Back Office
14 3 (0.62%) Games
14 3 (0.62%) Mandarin Language
Job Titles
1 73 (15.02%) IT Manager
2 48 (9.88%) Developer
2 48 (9.88%) Trainer
3 31 (6.38%) Senior
4 30 (6.17%) Analyst
5 27 (5.56%) Junior
5 27 (5.56%) Lead
6 26 (5.35%) Software Engineer
7 25 (5.14%) Systems Engineer
8 21 (4.32%) Junior Systems Engineer
9 15 (3.09%) Data Analyst
10 14 (2.88%) .NET Developer
10 14 (2.88%) Head of Delivery
10 14 (2.88%) Head of IT
11 13 (2.67%) Graduate
12 12 (2.47%) Architect
12 12 (2.47%) Product Manager
12 12 (2.47%) Senior Developer
13 10 (2.06%) Network Engineer
13 10 (2.06%) Statistician
Libraries, Frameworks & Software Standards
1 37 (7.61%) .NET
2 22 (4.53%) HTML
3 20 (4.12%) React
4 18 (3.70%) CSS
5 11 (2.26%) RESTful
6 10 (2.06%) WinForms
7 9 (1.85%) .NET Core
8 8 (1.65%) AngularJS
8 8 (1.65%) ASP.NET
8 8 (1.65%) jQuery
9 6 (1.23%) Node.js
9 6 (1.23%) REST
9 6 (1.23%) Web Services
10 5 (1.03%) Vue
11 4 (0.82%) Elastic Stack
11 4 (0.82%) HTML5
11 4 (0.82%) Kafka
11 4 (0.82%) WebSockets
12 3 (0.62%) CSS3
12 3 (0.62%) RabbitMQ
Miscellaneous
1 104 (21.40%) Social Media
2 15 (3.09%) Algorithms
2 15 (3.09%) Management Information System
3 14 (2.88%) Product Ownership
4 12 (2.47%) Self-Motivation
5 11 (2.26%) Security Posture
6 9 (1.85%) Hedge funds
6 9 (1.85%) Team-Oriented Environment
7 7 (1.44%) Manufacturing Execution System
8 6 (1.23%) Data Structures
8 6 (1.23%) Onboarding
8 6 (1.23%) Robotics
9 4 (0.82%) Client/Server
9 4 (0.82%) Greenfield Project
10 3 (0.62%) Clustering
10 3 (0.62%) Distributed Systems
10 3 (0.62%) Equities
10 3 (0.62%) Reference Data
10 3 (0.62%) Renewable Energy
11 2 (0.41%) Tandem
Operating Systems
1 100 (20.58%) Windows
2 90 (18.52%) Windows Vista
3 25 (5.14%) Linux
4 3 (0.62%) Unix
5 2 (0.41%) Android
5 2 (0.41%) Red Hat Enterprise Linux
6 1 (0.21%) Apple iOS
6 1 (0.21%) Mac OS
6 1 (0.21%) Windows 10
6 1 (0.21%) Windows Server
Processes & Methodologies
1 154 (31.69%) Problem-Solving
2 95 (19.55%) Mathematics
3 73 (15.02%) Agile
4 72 (14.81%) Continuous Improvement
5 71 (14.61%) Customer-Centricity
6 69 (14.20%) Artificial Intelligence
7 59 (12.14%) Software Engineering
8 57 (11.73%) Statistics
9 48 (9.88%) Conversational UI
10 44 (9.05%) Project Management
11 42 (8.64%) Cybersecurity
12 37 (7.61%) Systems Engineering
13 35 (7.20%) Analytics
14 33 (6.79%) PLM
15 30 (6.17%) Scrum
16 28 (5.76%) CI/CD
17 27 (5.56%) Data Science
17 27 (5.56%) Roadmaps
18 26 (5.35%) DevOps
18 26 (5.35%) Mentoring
Programming Languages
1 76 (15.64%) Python
2 74 (15.23%) SQL
3 59 (12.14%) C#
4 54 (11.11%) Java
5 41 (8.44%) JavaScript
6 34 (7.00%) MATLAB
7 29 (5.97%) C++
8 28 (5.76%) PHP
9 24 (4.94%) TypeScript
10 19 (3.91%) Rust
11 15 (3.09%) C
12 14 (2.88%) R
12 14 (2.88%) Ruby
13 13 (2.67%) Dart
14 10 (2.06%) PowerShell
14 10 (2.06%) Shell Script
15 8 (1.65%) PL/SQL
16 7 (1.44%) C-shell
16 7 (1.44%) Korn
17 1 (0.21%) Bash
Qualifications
1 416 (85.60%) Degree
2 222 (45.68%) Computer Science Degree
3 114 (23.46%) DBS Check
4 77 (15.84%) Master's Degree
5 57 (11.73%) PhD
6 32 (6.58%) BPSS Clearance
7 14 (2.88%) Cisco Certification
7 14 (2.88%) PMI Certification
7 14 (2.88%) PMP
8 12 (2.47%) CISSP
9 11 (2.26%) Security Cleared
10 10 (2.06%) CISA
10 10 (2.06%) CISM
11 9 (1.85%) CEH
12 8 (1.65%) (ISC)2 CCSP
13 7 (1.44%) SC Cleared
14 6 (1.23%) CCNP
14 6 (1.23%) JNCIA
14 6 (1.23%) JNCIS
14 6 (1.23%) Microsoft Certification
Quality Assurance & Compliance
1 15 (3.09%) NIST
2 13 (2.67%) GDPR
2 13 (2.67%) ISO/IEC 27001
3 9 (1.85%) QA
4 8 (1.65%) Data Quality
5 4 (0.82%) Accessibility
6 2 (0.41%) 21 CFR Part 11
6 2 (0.41%) Def Stans
6 2 (0.41%) GMP
6 2 (0.41%) ISO 13485
6 2 (0.41%) NIST 800
7 1 (0.21%) Cyber Essentials
7 1 (0.21%) IEC 62304
7 1 (0.21%) ISO 9001
7 1 (0.21%) PCI DSS
7 1 (0.21%) SLA
System Software
1 12 (2.47%) Docker
2 7 (1.44%) VMware Infrastructure
3 4 (0.82%) VMware NSX
4 3 (0.62%) Hyper-V
5 2 (0.41%) Active Directory
5 2 (0.41%) Virtual Machines
6 1 (0.21%) Firmware
6 1 (0.21%) KVM
6 1 (0.21%) RHEV
Systems Management
1 13 (2.67%) Kubernetes
2 12 (2.47%) Ansible
3 9 (1.85%) Terraform
4 7 (1.44%) Grafana
5 4 (0.82%) Kibana
6 2 (0.41%) Docker Swarm
7 1 (0.21%) Jamf Pro
7 1 (0.21%) logstash
7 1 (0.21%) Nessus
7 1 (0.21%) Prometheus
7 1 (0.21%) SCCM
Vendors
1 48 (9.88%) PayPal
2 32 (6.58%) Microsoft
3 23 (4.73%) IBM
4 14 (2.88%) Oracle
5 13 (2.67%) Cisco
6 12 (2.47%) Databricks
7 8 (1.65%) VMware
8 6 (1.23%) Arista
9 5 (1.03%) Bloomberg
9 5 (1.03%) Google
10 4 (0.82%) Nimble Storage
10 4 (0.82%) SAP
11 3 (0.62%) Reuters
12 2 (0.41%) AppDynamics
12 2 (0.41%) Moogsoft
12 2 (0.41%) Red Hat
12 2 (0.41%) Salesforce
12 2 (0.41%) ServiceNow
12 2 (0.41%) Splunk
12 2 (0.41%) Talend