Instagram Jobs with Work from Home Options

Instagram
UK > Work from Home

The table below provides summary statistics for permanent job vacancies with an option to work from home (WFH) and a requirement for knowledge and experience of Instagram products and/or services. Included is a benchmarking guide to the salaries offered in vacancies that have cited Instagram over the 6 months to 26 May 2024 with a comparison to the same period in the previous 2 years.

The figures below represent the IT labour market in general and are not representative of salaries within Instagram.

6 months to
26 May 2024
Same period 2023 Same period 2022
Rank 564 619 760
Rank change year-on-year +55 +141 -215
Permanent jobs citing Instagram 28 26 111
As % of all permanent jobs with a WFH option 0.082% 0.065% 0.15%
As % of the Vendors category 0.20% 0.16% 0.41%
Number of salaries quoted 25 13 20
10th Percentile £27,500 £32,000 £31,875
25th Percentile £28,750 £36,250 £39,063
Median annual salary (50th Percentile) £36,750 £40,000 £40,000
Median % change year-on-year -8.13% - -46.67%
75th Percentile £45,000 £85,000 £49,063
90th Percentile £50,000 £127,000 £75,000
UK median annual salary £37,250 £40,000 £40,000
% change year-on-year -6.88% - +3.23%

All Vendors
Work from Home

Instagram is in the Vendor Products and Services category. The following table is for comparison with the above and provides summary statistics for all permanent job vacancies with a WFH option and a requirement for knowledge or experience of vendor products and services.

Permanent vacancies with a requirement for knowledge or experience of vendor products and services 13,891 16,251 26,842
As % of all permanent jobs with a WFH option 40.70% 40.61% 37.19%
Number of salaries quoted 9,832 10,897 15,338
10th Percentile £31,549 £33,198 £32,500
25th Percentile £41,250 £43,750 £42,500
Median annual salary (50th Percentile) £55,000 £59,526 £57,500
Median % change year-on-year -7.60% +3.52% +4.55%
75th Percentile £71,250 £77,500 £76,250
90th Percentile £87,500 £92,500 £92,500
UK median annual salary £50,000 £57,500 £55,000
% change year-on-year -13.04% +4.55% +4.76%

Instagram
Trend for Jobs with a WFH Option

Job vacancies with a work from home option citing Instagram as a proportion of all IT jobs advertised.
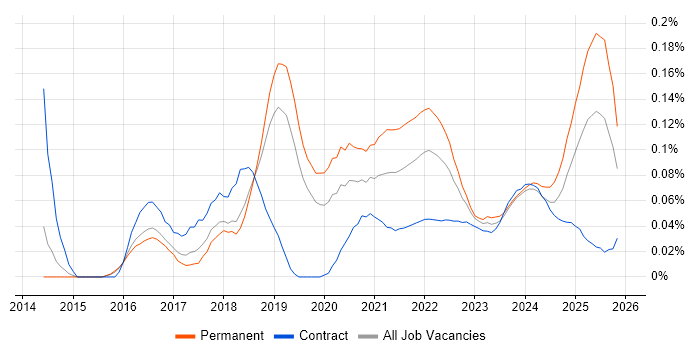
Instagram trend for jobs with a WFH option

Instagram
Salary Trend for Jobs with a WFH Option

3-month moving average salary quoted in job vacancies with a work from home option citing Instagram.

Instagram salary trend for jobs with a WFH option

Instagram
Salary Histogram for Jobs with a WFH Option

Salary distribution for jobs with a work from home option citing Instagram over the 6 months to 26 May 2024.

Instagram salary histogram for jobs with a WFH option

Instagram
Co-occurring Skills and Capabilities with WFH Options by Category

The follow tables expand on the table above by listing co-occurrences grouped by category. The same employment type, locality and period is covered with up to 20 co-occurrences shown in each of the following categories:

Application Platforms
1 6 (21.43%) CMS
2 3 (10.71%) Microsoft Exchange
2 3 (10.71%) WordPress
Applications
1 7 (25.00%) Photoshop
2 3 (10.71%) Adobe Premiere
3 2 (7.14%) CapCut
4 1 (3.57%) Adobe Captivate
4 1 (3.57%) Adobe Creative Suite
4 1 (3.57%) Adobe Illustrator
4 1 (3.57%) InDesign
4 1 (3.57%) Microsoft Excel
4 1 (3.57%) Microsoft Office
4 1 (3.57%) Microsoft PowerPoint
Business Applications
1 3 (10.71%) Dynamics CRM
Cloud Services
1 10 (35.71%) Canva
2 5 (17.86%) MailChimp
3 2 (7.14%) Adobe Analytics
3 2 (7.14%) Google Analytics
4 1 (3.57%) Bloomreach
4 1 (3.57%) Google Tag Manager
4 1 (3.57%) Google Workspace
4 1 (3.57%) SaaS
4 1 (3.57%) Sprout Social
Communications & Networking
1 3 (10.71%) Wi-Fi
Database & Business Intelligence
1 1 (3.57%) Looker
1 1 (3.57%) Tableau
General
1 17 (60.71%) Marketing
2 10 (35.71%) Social Skills
3 7 (25.00%) Publishing
4 4 (14.29%) Games
5 3 (10.71%) Advertising
5 3 (10.71%) Inclusion and Diversity
5 3 (10.71%) Legal
5 3 (10.71%) Organisational Skills
5 3 (10.71%) Public Sector
5 3 (10.71%) Retail
6 2 (7.14%) Analytical Skills
6 2 (7.14%) Brand Awareness
7 1 (3.57%) Finance
7 1 (3.57%) French Language
7 1 (3.57%) German Language
7 1 (3.57%) Influencing Skills
7 1 (3.57%) Multimedia
7 1 (3.57%) Presentation Skills
7 1 (3.57%) Spanish Language
Job Titles
1 4 (14.29%) Senior
1 4 (14.29%) Social Media Manager
2 3 (10.71%) Communications Officer
2 3 (10.71%) IT Engineer
2 3 (10.71%) IT Support
2 3 (10.71%) IT Support Engineer
2 3 (10.71%) Mac Engineer
2 3 (10.71%) Senior Manager
2 3 (10.71%) Support Engineer
3 2 (7.14%) Communications Manager
3 2 (7.14%) Content Coordinator
3 2 (7.14%) Coordinator
3 2 (7.14%) CRM Executive
3 2 (7.14%) Senior Communications Manager
3 2 (7.14%) Social Media Executive
4 1 (3.57%) Analytics Manager
4 1 (3.57%) Content Manager
4 1 (3.57%) Designer
4 1 (3.57%) Digital Analytics Manager
4 1 (3.57%) Marketing Assistant
Libraries, Frameworks & Software Standards
1 3 (10.71%) CSS
1 3 (10.71%) HTML
Miscellaneous
1 21 (75.00%) Social Media
2 5 (17.86%) Photography
3 4 (14.29%) Self-Motivation
4 3 (10.71%) Apple TV
5 2 (7.14%) Algorithms
5 2 (7.14%) Blog
6 1 (3.57%) Graphic Design
6 1 (3.57%) Onboarding
6 1 (3.57%) Tandem
6 1 (3.57%) Video Editing
Operating Systems
1 3 (10.71%) Android
1 3 (10.71%) Mac OS
1 3 (10.71%) Mac OS X
Processes & Methodologies
1 9 (32.14%) Storytelling
2 7 (25.00%) CRM
2 7 (25.00%) Digital Marketing
2 7 (25.00%) Email Marketing
3 6 (21.43%) Analytics
3 6 (21.43%) Copywriting
4 4 (14.29%) Continuous Improvement
5 3 (10.71%) Brand Management
5 3 (10.71%) Content Management
5 3 (10.71%) Creative Problem-Solving
5 3 (10.71%) Creative Thinking
5 3 (10.71%) Customer Service
5 3 (10.71%) E-Commerce
5 3 (10.71%) Marketing Strategy
5 3 (10.71%) Organisational Awareness
5 3 (10.71%) Problem-Solving
5 3 (10.71%) Project Delivery
5 3 (10.71%) Requirements Gathering
5 3 (10.71%) Social Media Analytics
5 3 (10.71%) Web Development
Programming Languages
1 1 (3.57%) JavaScript
1 1 (3.57%) Python
1 1 (3.57%) SQL
Qualifications
1 2 (7.14%) Degree
Quality Assurance & Compliance
1 1 (3.57%) Accessibility
1 1 (3.57%) QA
Vendors
1 13 (46.43%) Facebook
2 10 (35.71%) TikTok
2 10 (35.71%) YouTube
3 6 (21.43%) Adobe
3 6 (21.43%) Twitter
4 4 (14.29%) Microsoft
5 3 (10.71%) Apple
5 3 (10.71%) Google
6 2 (7.14%) Pinterest
6 2 (7.14%) Snapchat