Salesforce Jobs with Work from Home Options

Salesforce
UK > Work from Home

The table below provides summary statistics for permanent remote or hybrid work requiring knowledge or experience of Salesforce products and/or services. It includes a benchmarking guide to the annual salaries offered in vacancies that cited Salesforce over the 6 months leading up to 26 July 2024, comparing them to the same period in the previous two years.

The figures below represent the IT labour market in general and are not representative of salaries within Salesforce.

6 months to
26 Jul 2024
Same period 2023 Same period 2022
Rank 188 166 205
Rank change year-on-year -22 +39 -45
Permanent jobs citing Salesforce 503 695 1,612
As % of all permanent jobs with a WFH option 1.80% 2.12% 2.05%
As % of the Vendors category 4.58% 5.36% 5.46%
Number of salaries quoted 426 532 828
10th Percentile £33,000 £37,650 £37,500
25th Percentile £37,250 £46,570 £51,250
Median annual salary (50th Percentile) £40,000 £60,000 £65,000
Median % change year-on-year -33.33% -7.69% +8.33%
75th Percentile £62,200 £81,250 £85,000
90th Percentile £87,500 £88,750 £95,000
UK median annual salary £50,000 £60,800 £65,000
% change year-on-year -17.76% -6.46% +8.33%

All Vendors
Work from Home

Salesforce falls under the Vendor Products and Services category. For comparison with the information above, the following table provides summary statistics for all permanent job vacancies with a remote or hybrid options requiring knowledge or experience of all vendor products and services.

Permanent vacancies with a requirement for knowledge or experience of vendor products and services 10,993 12,976 29,515
As % of all permanent jobs with a WFH option 39.35% 39.54% 37.59%
Number of salaries quoted 7,279 9,661 16,161
10th Percentile £32,500 £32,860 £32,500
25th Percentile £41,250 £43,750 £42,500
Median annual salary (50th Percentile) £55,000 £60,000 £57,500
Median % change year-on-year -8.33% +4.35% +4.55%
75th Percentile £73,750 £77,500 £77,500
90th Percentile £90,000 £91,250 £92,500
UK median annual salary £52,500 £57,500 £55,000
% change year-on-year -8.70% +4.55% +1.85%

Salesforce
Trend for Jobs with a WFH Option

Job vacancies with a work from home option citing Salesforce as a proportion of all IT jobs advertised.
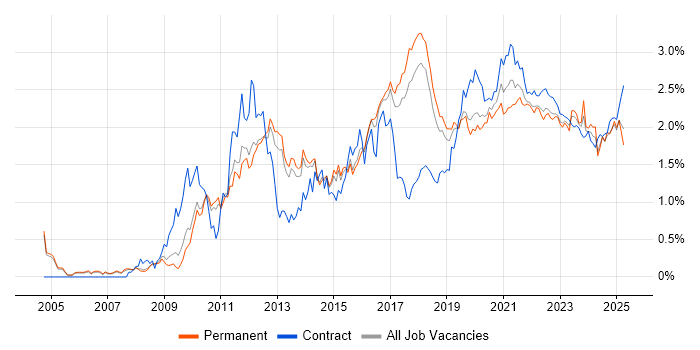
Salesforce trend for jobs with a WFH option

Salesforce
Salary Trend for Jobs with a WFH Option

3-month moving average salary quoted in job vacancies with a work from home option citing Salesforce.

Salesforce salary trend for jobs with a WFH option

Salesforce
Salary Histogram for Jobs with a WFH Option

Salary distribution for jobs with a work from home option citing Salesforce over the 6 months to 26 July 2024.

Salesforce salary histogram for jobs with a WFH option

Salesforce
Co-occurring Skills and Capabilities with WFH Options by Category

The follow tables expand on the table above by listing co-occurrences grouped by category. The same employment type, locality and period is covered with up to 20 co-occurrences shown in each of the following categories:

Application Platforms
1 29 (5.77%) Confluence
2 5 (0.99%) CMS
2 5 (0.99%) SharePoint
2 5 (0.99%) WordPress
3 4 (0.80%) Drupal
3 4 (0.80%) Microsoft Exchange
Applications
1 23 (4.57%) Microsoft Office
2 8 (1.59%) Microsoft Excel
3 5 (0.99%) Microsoft PowerPoint
4 4 (0.80%) Chatbot
5 3 (0.60%) Trello
6 2 (0.40%) Adobe XD
6 2 (0.40%) Sketch
7 1 (0.20%) Photoshop
7 1 (0.20%) Spreadsheet
7 1 (0.20%) UserZoom
Business Applications
1 70 (13.92%) Salesforce CRM
2 22 (4.37%) Dynamics CRM
3 11 (2.19%) NetSuite
4 5 (0.99%) Odoo
4 5 (0.99%) SAP S/4HANA
5 4 (0.80%) Oracle EBS
6 3 (0.60%) iTrent
7 2 (0.40%) Oracle Procure-to-Pay
7 2 (0.40%) SAP SD
8 1 (0.20%) Magento
8 1 (0.20%) SAP CO
8 1 (0.20%) SAP CRM
8 1 (0.20%) SAP CX
8 1 (0.20%) SAP ERP
8 1 (0.20%) SAP FI
8 1 (0.20%) SAP FI/CO
8 1 (0.20%) SAP HCM
8 1 (0.20%) SAP Hybris
8 1 (0.20%) SAP Payroll
8 1 (0.20%) Shopify
Cloud Services
1 38 (7.55%) Azure
2 36 (7.16%) AWS
3 31 (6.16%) SaaS
4 24 (4.77%) Dynamics 365
5 23 (4.57%) Microsoft 365
6 19 (3.78%) IaaS
6 19 (3.78%) PaaS
6 19 (3.78%) Power Platform
7 16 (3.18%) Salesforce Service Cloud
8 12 (2.39%) Microsoft Copilot
8 12 (2.39%) Salesforce Sales Cloud
9 7 (1.39%) Google Workspace
9 7 (1.39%) Salesforce Commerce Cloud
10 6 (1.19%) ClickUp
10 6 (1.19%) Power Automate
10 6 (1.19%) Zapier
11 5 (0.99%) Google Analytics
11 5 (0.99%) Mavenlink
12 4 (0.80%) Serverless
12 4 (0.80%) Snowflake
Communications & Networking
1 10 (1.99%) Broadband
1 10 (1.99%) Internet
1 10 (1.99%) WPA
2 5 (0.99%) Wi-Fi
3 4 (0.80%) HTTP
4 3 (0.60%) GPRS
5 1 (0.20%) DNS
5 1 (0.20%) Firewall
5 1 (0.20%) Network Security
Database & Business Intelligence
1 22 (4.37%) Metadata
2 18 (3.58%) Power BI
3 15 (2.98%) Data Warehouse
4 14 (2.78%) SQL Server
5 7 (1.39%) PostgreSQL
6 6 (1.19%) Azure SQL Database
6 6 (1.19%) GIS
6 6 (1.19%) Tableau
7 5 (0.99%) SAP BW
8 3 (0.60%) DBAmp
8 3 (0.60%) DynamoDB
8 3 (0.60%) MongoDB
8 3 (0.60%) MySQL
8 3 (0.60%) NoSQL
8 3 (0.60%) SQL Server Integration Services
8 3 (0.60%) SQL Server Reporting Services
9 2 (0.40%) Amazon RDS
9 2 (0.40%) Data Lake
9 2 (0.40%) Looker
9 2 (0.40%) Relational Database
Development Applications
1 54 (10.74%) JIRA
2 8 (1.59%) Git
2 8 (1.59%) GitLab
3 3 (0.60%) Jenkins
3 3 (0.60%) Visual Studio
4 2 (0.40%) Bitbucket
5 1 (0.20%) IntelliJ
General
1 109 (21.67%) Social Skills
2 74 (14.71%) Marketing
3 60 (11.93%) Finance
4 55 (10.93%) Analytical Skills
5 33 (6.56%) Inclusion and Diversity
6 21 (4.17%) Presentation Skills
7 18 (3.58%) Public Sector
8 10 (1.99%) Retail
9 9 (1.79%) Banking
9 9 (1.79%) Legal
10 5 (0.99%) Back Office
10 5 (0.99%) Billing
10 5 (0.99%) Manufacturing
11 4 (0.80%) Advertising
11 4 (0.80%) Pharmaceutical
11 4 (0.80%) Telecoms
12 3 (0.60%) Games
13 2 (0.40%) Documentation Skills
13 2 (0.40%) Fire and Rescue
13 2 (0.40%) Influencing Skills
Job Titles
1 225 (44.73%) Business Manager
2 203 (40.36%) Business Development Manager
2 203 (40.36%) Development Manager
3 44 (8.75%) Senior
4 36 (7.16%) Analyst
5 28 (5.57%) Developer
6 27 (5.37%) Architect
7 22 (4.37%) Business Analyst
8 21 (4.17%) Consultant
8 21 (4.17%) CRM Executive
9 20 (3.98%) Lead
10 18 (3.58%) Project Manager
10 18 (3.58%) Salesforce Architect
10 18 (3.58%) Salesforce Developer
11 17 (3.38%) Solutions Architect
12 16 (3.18%) Administrator
13 15 (2.98%) Salesforce Administrator
14 14 (2.78%) Business Systems Manager
14 14 (2.78%) Systems Manager
15 13 (2.58%) Senior Analyst
Libraries, Frameworks & Software Standards
1 26 (5.17%) Lightning Web Components
2 23 (4.57%) HTML
3 18 (3.58%) .NET
3 18 (3.58%) CSS
4 12 (2.39%) Middleware
5 9 (1.79%) Visualforce
6 8 (1.59%) AngularJS
6 8 (1.59%) JSON
7 7 (1.39%) .NET Core
7 7 (1.39%) REST
8 5 (0.99%) ASP.NET
8 5 (0.99%) ASP.NET MVC
8 5 (0.99%) XML
9 4 (0.80%) React
9 4 (0.80%) SOAP
10 3 (0.60%) .NET Framework
10 3 (0.60%) CSS3
10 3 (0.60%) HTML5
10 3 (0.60%) Semantic UI
10 3 (0.60%) Twitter Bootstrap
Miscellaneous
1 16 (3.18%) Enterprise Software
1 16 (3.18%) Management Information System
2 15 (2.98%) Product Ownership
3 12 (2.39%) Public Cloud
4 10 (1.99%) NHS
5 9 (1.79%) Driving Licence
6 6 (1.19%) Self-Motivation
6 6 (1.19%) Social Media
7 5 (0.99%) Linux Command Line
7 5 (0.99%) Marketing Technology
7 5 (0.99%) Onboarding
8 3 (0.60%) Greenfield Project
8 3 (0.60%) IoT
8 3 (0.60%) Team-Oriented Environment
9 2 (0.40%) Algorithms
9 2 (0.40%) Data Structures
9 2 (0.40%) Digital Media
9 2 (0.40%) Distributed Architecture
9 2 (0.40%) Distributed Systems
9 2 (0.40%) Learning Management System
Operating Systems
1 3 (0.60%) Windows
2 2 (0.40%) Linux
3 1 (0.20%) Android
3 1 (0.20%) Apple iOS
3 1 (0.20%) Windows 10
Processes & Methodologies
1 210 (41.75%) Business Development
2 193 (38.37%) Customer Experience
3 161 (32.01%) Client Onboarding
3 161 (32.01%) CRM
4 75 (14.91%) Agile
5 50 (9.94%) B2B
6 48 (9.54%) Problem-Solving
7 45 (8.95%) Value Proposition
8 44 (8.75%) Active Listening
8 44 (8.75%) Deadline-Driven
8 44 (8.75%) Project Management
9 39 (7.75%) Stakeholder Management
10 37 (7.36%) Business Strategy
11 31 (6.16%) Enterprise Architecture
12 30 (5.96%) Continuous Improvement
13 29 (5.77%) PRINCE2
14 28 (5.57%) Project Delivery
14 28 (5.57%) Scrum
15 27 (5.37%) Requirements Gathering
15 27 (5.37%) TOGAF
Programming Languages
1 24 (4.77%) Python
1 24 (4.77%) SQL
2 23 (4.57%) Apex Code
2 23 (4.57%) JavaScript
3 17 (3.38%) C#
4 8 (1.59%) Java
5 6 (1.19%) TypeScript
6 5 (0.99%) Bash
7 4 (0.80%) PowerShell
8 3 (0.60%) T-SQL
8 3 (0.60%) VB.NET
9 1 (0.20%) Swift
Qualifications
1 42 (8.35%) Degree
2 13 (2.58%) PMI Certification
2 13 (2.58%) PMP
2 13 (2.58%) TOGAF Certification
3 12 (2.39%) APMG
4 11 (2.19%) Computer Science Degree
5 7 (1.39%) IIBA
6 6 (1.19%) CSPO
7 5 (0.99%) DBS Check
8 3 (0.60%) ITIL Certification
8 3 (0.60%) Master's Degree
8 3 (0.60%) Security Cleared
9 2 (0.40%) Azure Certification
9 2 (0.40%) BPSS Clearance
9 2 (0.40%) SAP Certification
10 1 (0.20%) CBAP
10 1 (0.20%) MBA
10 1 (0.20%) Microsoft Certification
10 1 (0.20%) PRINCE2 Certification
10 1 (0.20%) SC Cleared
Quality Assurance & Compliance
1 46 (9.15%) SLA
2 26 (5.17%) Data Quality
3 8 (1.59%) QA
4 3 (0.60%) Accessibility
4 3 (0.60%) GDPR
5 2 (0.40%) California Consumer Privacy Act
5 2 (0.40%) HIPAA
5 2 (0.40%) IFRS
6 1 (0.20%) GAMP
System Software
1 5 (0.99%) Docker
2 4 (0.80%) Virtual Machines
3 3 (0.60%) vSphere
4 1 (0.20%) Active Directory
Systems Management
1 6 (1.19%) Kubernetes
2 2 (0.40%) Terraform
3 1 (0.20%) ZABBIX
Vendors
1 80 (15.90%) SAP
2 61 (12.13%) Microsoft
3 24 (4.77%) ServiceNow
4 18 (3.58%) Oracle
5 12 (2.39%) Salesforce Marketing Cloud
6 11 (2.19%) Google
7 9 (1.79%) Pardot
8 6 (1.19%) HubSpot
9 5 (0.99%) MuleSoft
10 4 (0.80%) Adobe
11 3 (0.60%) Workday
12 2 (0.40%) Atlassian
12 2 (0.40%) Concur
12 2 (0.40%) Databricks
13 1 (0.20%) Apple
13 1 (0.20%) Hootsuite
13 1 (0.20%) Sage
13 1 (0.20%) SnapLogic
13 1 (0.20%) Sun
13 1 (0.20%) Zoho