Project Delivery Jobs with Work from Home Options

Project Delivery
UK > Work from Home

The table below provides summary statistics for permanent remote or hybrid work requiring Project Delivery skills. It includes a benchmarking guide to the annual salaries offered in vacancies that cited Project Delivery over the 6 months leading up to 26 July 2024, comparing them to the same period in the previous two years.

6 months to
26 Jul 2024
Same period 2023 Same period 2022
Rank 66 62 84
Rank change year-on-year -4 +22 +12
Permanent jobs citing Project Delivery 1,101 1,525 3,416
As % of all permanent jobs with a WFH option 3.94% 4.65% 4.35%
As % of the Processes & Methodologies category 4.45% 4.85% 4.48%
Number of salaries quoted 725 1,134 1,975
10th Percentile £40,500 £41,250 £39,333
25th Percentile £47,500 £48,563 £46,750
Median annual salary (50th Percentile) £60,000 £60,500 £60,000
Median % change year-on-year -0.83% +0.83% -
75th Percentile £72,500 £75,000 £75,000
90th Percentile £84,985 £85,000 £87,500
UK median annual salary £55,000 £60,800 £60,000
% change year-on-year -9.54% +1.33% +7.14%

All Process and Methodology Skills
Work from Home

Project Delivery falls under the Processes and Methodologies category. For comparison with the information above, the following table provides summary statistics for all permanent job vacancies with remote or hybrid options requiring process or methodology skills.

Permanent vacancies with a requirement for process or methodology skills 24,720 31,469 76,283
As % of all permanent jobs with a WFH option 88.48% 95.89% 97.14%
Number of salaries quoted 17,624 23,346 43,834
10th Percentile £35,000 £37,500 £36,250
25th Percentile £42,500 £47,500 £46,250
Median annual salary (50th Percentile) £57,965 £62,500 £60,000
Median % change year-on-year -7.26% +4.17% +9.09%
75th Percentile £77,500 £81,250 £80,000
90th Percentile £96,250 £100,000 £95,000
UK median annual salary £55,000 £60,000 £60,000
% change year-on-year -8.33% - +9.09%

Project Delivery
Trend for Jobs with a WFH Option

Job vacancies with a work from home option citing Project Delivery as a proportion of all IT jobs advertised.
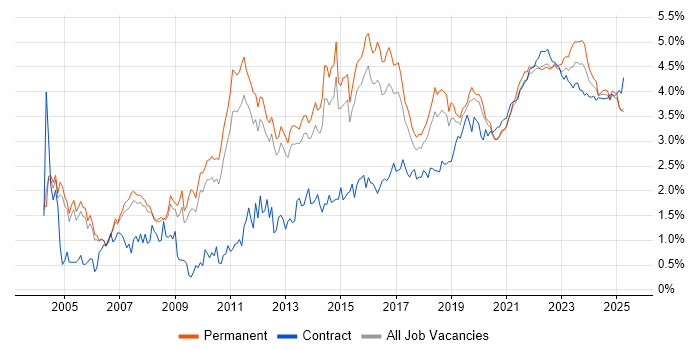
Project Delivery trend for jobs with a WFH option

Project Delivery
Salary Trend for Jobs with a WFH Option

3-month moving average salary quoted in job vacancies with a work from home option citing Project Delivery.

Project Delivery salary trend for jobs with a WFH option

Project Delivery
Salary Histogram for Jobs with a WFH Option

Salary distribution for jobs with a work from home option citing Project Delivery over the 6 months to 26 July 2024.

Project Delivery salary histogram for jobs with a WFH option

Project Delivery
Co-occurring Skills and Capabilities with WFH Options by Category

The follow tables expand on the table above by listing co-occurrences grouped by category. The same employment type, locality and period is covered with up to 20 co-occurrences shown in each of the following categories:

Application Platforms
1 45 (4.09%) CMS
2 39 (3.54%) SharePoint
3 32 (2.91%) Kentico
4 31 (2.82%) Umbraco
5 29 (2.63%) IIS
6 27 (2.45%) Confluence
6 27 (2.45%) Sitecore CMS
7 26 (2.36%) Headless CMS
8 19 (1.73%) Microsoft Exchange
9 15 (1.36%) WordPress
10 13 (1.18%) Drupal
11 5 (0.45%) Apache Solr
12 3 (0.27%) ArcGIS
12 3 (0.27%) nginx
13 2 (0.18%) Apache
14 1 (0.091%) Adobe Experience Manager
14 1 (0.091%) Apache Spark
14 1 (0.091%) JBoss
14 1 (0.091%) SharePoint Server
Applications
1 37 (3.36%) Microsoft Excel
2 35 (3.18%) Microsoft Office
3 22 (2.00%) Microsoft Project
4 18 (1.63%) Microsoft PowerPoint
5 15 (1.36%) Adobe XD
6 9 (0.82%) MS Visio
7 7 (0.64%) Simulink
8 4 (0.36%) Spreadsheet
9 2 (0.18%) AutoCAD
9 2 (0.18%) Chatbot
9 2 (0.18%) Trello
10 1 (0.091%) UserZoom
Business Applications
1 16 (1.45%) Dynamics CRM
2 12 (1.09%) Remedy ITSM
2 12 (1.09%) SAP S/4HANA
3 8 (0.73%) Magento
4 6 (0.54%) Elite 3E
4 6 (0.54%) Oracle General Ledger
4 6 (0.54%) Oracle Subledger Accounting
5 5 (0.45%) Salesforce CRM
5 5 (0.45%) SAP SCM
6 4 (0.36%) Primavera
6 4 (0.36%) SAP ERP
6 4 (0.36%) SAP PP
7 3 (0.27%) Shopify
8 2 (0.18%) Dynamics NAV
8 2 (0.18%) SAP Business ByDesign
9 1 (0.091%) NetSuite
9 1 (0.091%) Oracle Assets
9 1 (0.091%) Oracle Payables
9 1 (0.091%) Oracle Procure-to-Pay
9 1 (0.091%) Oracle Receivables
Cloud Services
1 228 (20.71%) Azure
2 122 (11.08%) Microsoft 365
3 96 (8.72%) AWS
4 64 (5.81%) Azure DevOps
5 61 (5.54%) Entra ID
6 58 (5.27%) Dynamics 365
7 53 (4.81%) Power Platform
8 36 (3.27%) SaaS
9 32 (2.91%) Kontent
10 23 (2.09%) PowerApps
11 21 (1.91%) GCP
12 20 (1.82%) Cloud Computing
13 19 (1.73%) Serverless
14 18 (1.63%) Azure Storage
14 18 (1.63%) Power Automate
15 15 (1.36%) Microsoft Copilot
16 14 (1.27%) IaaS
17 13 (1.18%) Azure Monitor
18 10 (0.91%) Microsoft Purview
19 9 (0.82%) AWS Lambda
Communications & Networking
1 52 (4.72%) WAN
2 42 (3.81%) Firewall
3 41 (3.72%) LAN
4 30 (2.72%) SD-WAN
5 28 (2.54%) VPN
6 27 (2.45%) Wi-Fi
7 23 (2.09%) DNS
8 22 (2.00%) TCP/IP
9 21 (1.91%) Wireless
10 18 (1.63%) Network Security
11 17 (1.54%) DHCP
12 15 (1.36%) SAN
13 12 (1.09%) Structured Cabling
13 12 (1.09%) VLAN
14 11 (1.00%) Internet
15 10 (0.91%) Fibre Channel
16 8 (0.73%) 5G
16 8 (0.73%) iSCSI
17 7 (0.64%) J1939
17 7 (0.64%) Skype
Database & Business Intelligence
1 27 (2.45%) Power BI
2 21 (1.91%) SQL Server
3 19 (1.73%) Tableau
4 14 (1.27%) SAP BW
5 13 (1.18%) Amazon RDS
5 13 (1.18%) Data Warehouse
6 10 (0.91%) Big Data
7 8 (0.73%) BigQuery
7 8 (0.73%) Relational Database
8 6 (0.54%) Looker
9 5 (0.45%) Azure SQL Database
9 5 (0.45%) Data Lake
10 4 (0.36%) Amazon Athena
10 4 (0.36%) GIS
10 4 (0.36%) InfluxDB
10 4 (0.36%) NoSQL
11 3 (0.27%) RDBMS
12 2 (0.18%) Data Hub
12 2 (0.18%) Elasticsearch
12 2 (0.18%) MySQL
Development Applications
1 54 (4.90%) JIRA
2 23 (2.09%) Git
3 13 (1.18%) Axure RP
3 13 (1.18%) Balsamiq
4 7 (0.64%) Jenkins
4 7 (0.64%) Team Foundation Server
5 6 (0.54%) Visual Studio Team System
6 5 (0.45%) Cypress.io
6 5 (0.45%) Postman
6 5 (0.45%) Selenium
7 3 (0.27%) GitLab
8 2 (0.18%) Vagrant
9 1 (0.091%) CircleCI
9 1 (0.091%) Spinnaker
General
1 355 (32.24%) Social Skills
2 259 (23.52%) Finance
3 104 (9.45%) Public Sector
4 100 (9.08%) Analytical Skills
5 87 (7.90%) Inclusion and Diversity
5 87 (7.90%) Presentation Skills
6 67 (6.09%) Retail
7 56 (5.09%) Marketing
8 45 (4.09%) Legal
9 37 (3.36%) Law
9 37 (3.36%) Organisational Skills
10 27 (2.45%) Telecoms
11 23 (2.09%) Local Government
12 19 (1.73%) Automotive
12 19 (1.73%) Manufacturing
13 15 (1.36%) Influencing Skills
14 12 (1.09%) Back Office
14 12 (1.09%) Documentation Skills
14 12 (1.09%) Electronics
15 10 (0.91%) Pharmaceutical
Job Titles
1 331 (30.06%) Project Manager
2 167 (15.17%) Senior
3 111 (10.08%) Lead
3 111 (10.08%) Presales Manager
4 93 (8.45%) Developer
5 80 (7.27%) Consultant
6 74 (6.72%) Analyst
7 51 (4.63%) IT Manager
8 49 (4.45%) Architect
9 42 (3.81%) Portfolio Manager
10 41 (3.72%) IT Project Manager
10 41 (3.72%) Senior Developer
11 36 (3.27%) .NET Developer
12 35 (3.18%) Delivery Manager
13 34 (3.09%) Applications Developer
14 31 (2.82%) Business Analyst
14 31 (2.82%) Digital Project Manager
15 30 (2.72%) C# Developer
16 29 (2.63%) Senior C# Developer
16 29 (2.63%) Senior Manager
Libraries, Frameworks & Software Standards
1 68 (6.18%) .NET
2 51 (4.63%) HTML
3 48 (4.36%) CSS
4 43 (3.91%) React
5 39 (3.54%) .NET Core
6 36 (3.27%) RESTful
7 33 (3.00%) .NET Framework
8 30 (2.72%) ASP.NET
9 26 (2.36%) ASP.NET MVC
9 26 (2.36%) Next.js
10 24 (2.18%) HTML5
11 15 (1.36%) Vue
12 12 (1.09%) Laravel
13 11 (1.00%) AngularJS
13 11 (1.00%) HTML5 Canvas
13 11 (1.00%) jQuery
14 10 (0.91%) REST
15 9 (0.82%) JSON
16 7 (0.64%) KnockoutJS
17 6 (0.54%) Software Packaging
Miscellaneous
1 75 (6.81%) Self-Motivation
2 63 (5.72%) Product Ownership
3 56 (5.09%) Management Information System
4 32 (2.91%) Data Centre
5 31 (2.82%) PMI
6 21 (1.91%) Public Cloud
7 20 (1.82%) Mobile App
8 18 (1.63%) Replication
9 14 (1.27%) Operational Technology
10 13 (1.18%) Driving Licence
11 12 (1.09%) Linux Command Line
11 12 (1.09%) Onboarding
12 11 (1.00%) Low-Code
13 9 (0.82%) Blog
13 9 (0.82%) Social Media
14 8 (0.73%) FMCG
14 8 (0.73%) GNSS
14 8 (0.73%) NHS
14 8 (0.73%) Virtual Team
15 7 (0.64%) Team-Oriented Environment
Operating Systems
1 97 (8.81%) Windows
2 55 (5.00%) Windows Server
3 27 (2.45%) Linux
4 18 (1.63%) Android
5 17 (1.54%) Apple iOS
6 12 (1.09%) Windows 10
7 9 (0.82%) Windows Server 2016
8 8 (0.73%) Windows Server 2019
9 6 (0.54%) Mac OS
10 5 (0.45%) Windows 7
11 4 (0.36%) Red Hat Enterprise Linux
12 3 (0.27%) Windows Server 2008
13 2 (0.18%) Mac OS X
13 2 (0.18%) Windows Server 2012
13 2 (0.18%) Windows Vista
14 1 (0.091%) CentOS
14 1 (0.091%) Data ONTAP
14 1 (0.091%) Ubuntu
14 1 (0.091%) VMS
Processes & Methodologies
1 512 (46.50%) Project Management
2 451 (40.96%) Agile
3 180 (16.35%) Presales
4 172 (15.62%) Mentoring
5 166 (15.08%) Problem-Solving
6 156 (14.17%) Stakeholder Management
7 152 (13.81%) SDLC
8 142 (12.90%) PRINCE2
9 137 (12.44%) Roadmaps
10 135 (12.26%) Continuous Improvement
11 129 (11.72%) Actionable Insight
12 128 (11.63%) Software Delivery
13 127 (11.53%) Agile Project Management
14 120 (10.90%) DevOps
15 113 (10.26%) Change Management
16 109 (9.90%) Coaching
17 100 (9.08%) Line Management
18 83 (7.54%) Risk Management
19 81 (7.36%) Analytics
19 81 (7.36%) ITIL
Programming Languages
1 97 (8.81%) JavaScript
2 68 (6.18%) SQL
3 63 (5.72%) C#
4 61 (5.54%) Python
5 52 (4.72%) PowerShell
6 25 (2.27%) Bash
7 20 (1.82%) Java
8 19 (1.73%) TypeScript
9 18 (1.63%) PHP
10 13 (1.18%) C++
11 9 (0.82%) C
12 8 (0.73%) VBA
13 7 (0.64%) MATLAB
14 4 (0.36%) T-SQL
15 3 (0.27%) R
16 2 (0.18%) Embedded C
16 2 (0.18%) Korn
16 2 (0.18%) Ruby
17 1 (0.091%) Go
17 1 (0.091%) SAPscript
Qualifications
1 203 (18.44%) Degree
2 111 (10.08%) Security Cleared
3 73 (6.63%) PMI Certification
4 71 (6.45%) PMP
5 63 (5.72%) DBS Check
6 57 (5.18%) SC Cleared
7 27 (2.45%) APMP
7 27 (2.45%) Computer Science Degree
8 26 (2.36%) Microsoft Certification
9 25 (2.27%) Azure Certification
10 23 (2.09%) CAPM
10 23 (2.09%) DV Cleared
10 23 (2.09%) PgMP
11 21 (1.91%) AWS Certification
12 20 (1.82%) Master's Degree
13 15 (1.36%) APMG
13 15 (1.36%) CISSP
14 13 (1.18%) AWS Certified Solutions Architect
14 13 (1.18%) CISM
15 12 (1.09%) CASP
Quality Assurance & Compliance
1 71 (6.45%) QA
2 50 (4.54%) PMO
3 22 (2.00%) Accessibility
4 16 (1.45%) GDPR
5 15 (1.36%) Data Quality
6 14 (1.27%) ISO/IEC 27001
7 13 (1.18%) NCSC
7 13 (1.18%) WCAG
8 9 (0.82%) AUTOSAR
9 8 (0.73%) GAAP
9 8 (0.73%) IFRS
10 7 (0.64%) Automotive SPICE
10 7 (0.64%) Cyber Essentials
10 7 (0.64%) ISO 26262
11 5 (0.45%) NIST
12 4 (0.36%) GMP
12 4 (0.36%) ISO/IEC 20000
12 4 (0.36%) Sarbanes-Oxley
13 3 (0.27%) ISO 31000
13 3 (0.27%) SLA
System Software
1 73 (6.63%) Active Directory
2 26 (2.36%) VMware Infrastructure
3 21 (1.91%) Hyper-V
4 20 (1.82%) Virtual Desktop
5 19 (1.73%) Docker
6 13 (1.18%) vSphere
7 8 (0.73%) Virtual Machines
8 7 (0.64%) Terminal Services
9 3 (0.27%) Ceph
10 2 (0.18%) Firmware
10 2 (0.18%) Terminal Server
10 2 (0.18%) Virtual Servers
10 2 (0.18%) VMware NSX
Systems Management
1 35 (3.18%) Microsoft Intune
2 21 (1.91%) Terraform
3 19 (1.73%) SCCM
4 18 (1.63%) Kubernetes
5 13 (1.18%) WSUS
6 11 (1.00%) Ansible
7 10 (0.91%) Active Directory Federation Services
8 7 (0.64%) Microsoft Clustering
8 7 (0.64%) SCOM
8 7 (0.64%) Single Sign-On
9 6 (0.54%) Jamf Pro
10 4 (0.36%) Grafana
10 4 (0.36%) Puppet
11 3 (0.27%) AirWatch
11 3 (0.27%) Backup Exec
11 3 (0.27%) N-central
12 2 (0.18%) FortiGate
12 2 (0.18%) Packer
12 2 (0.18%) vCenter Server
13 1 (0.091%) Progress Chef
Vendors
1 265 (24.07%) Microsoft
2 40 (3.63%) SAP
3 39 (3.54%) Cisco
4 32 (2.91%) ServiceNow
5 31 (2.82%) VMware
6 29 (2.63%) Sitecore
7 28 (2.54%) Optimizely
7 28 (2.54%) Salesforce
8 22 (2.00%) Adobe
8 22 (2.00%) Google
9 19 (1.73%) Databricks
10 17 (1.54%) Oracle
11 15 (1.36%) BT
11 15 (1.36%) Remedy
12 14 (1.27%) Veeam
13 13 (1.18%) Meraki
14 12 (1.09%) BMC
14 12 (1.09%) CheckPoint
15 11 (1.00%) UiPath
16 10 (0.91%) Atlassian