Management Information System Jobs with Hybrid/Remote/WFH Options

Management Information Systems
UK > Work from Home

The table below looks at the prevalence of the term Management Information System in remote or hybrid work. Included is a benchmarking guide to the salaries offered in vacancies that cited Management Information System over the 6 months leading up to 18 July 2025, comparing them to the same period in the previous two years.

6 months to
18 Jul 2025
Same period 2024 Same period 2023
Rank 110 118 104
Rank change year-on-year +8 -14 +51
Permanent jobs citing Management Information System 659 788 1,067
As % of all permanent jobs with a WFH option 3.12% 2.50% 3.11%
As % of the Miscellaneous category 7.73% 7.23% 8.03%
Number of salaries quoted 229 571 722
10th Percentile £25,313 £32,000 £37,500
25th Percentile £36,650 £39,750 £47,500
Median annual salary (50th Percentile) £50,000 £52,500 £62,500
Median % change year-on-year -4.76% -16.00% +8.70%
75th Percentile £68,525 £67,500 £85,000
90th Percentile £82,500 £84,919 £109,750
UK median annual salary £54,044 £50,000 £60,000
% change year-on-year +8.09% -16.67% +9.09%

All Generic Skills
Work from Home

Management Information System falls under the General and Transferable Skills category. For comparison with the information above, the following table provides summary statistics for all permanent job vacancies with remote or hybrid options requiring generic IT skills.

Permanent vacancies with a requirement for generic IT skills 8,525 10,898 13,285
As % of all permanent jobs with a WFH option 40.40% 34.53% 38.76%
Number of salaries quoted 3,879 7,978 10,235
10th Percentile £31,250 £32,500 £39,517
25th Percentile £45,000 £43,750 £48,750
Median annual salary (50th Percentile) £65,000 £60,000 £65,000
Median % change year-on-year +8.33% -7.69% -
75th Percentile £83,750 £82,500 £85,000
90th Percentile £115,000 £112,500 £107,500
UK median annual salary £57,500 £55,000 £64,029
% change year-on-year +4.55% -14.10% +2.45%

Management Information System
Trend for Jobs with a WFH Option

Job vacancies with remote working options citing Management Information System as a proportion of all IT jobs advertised.
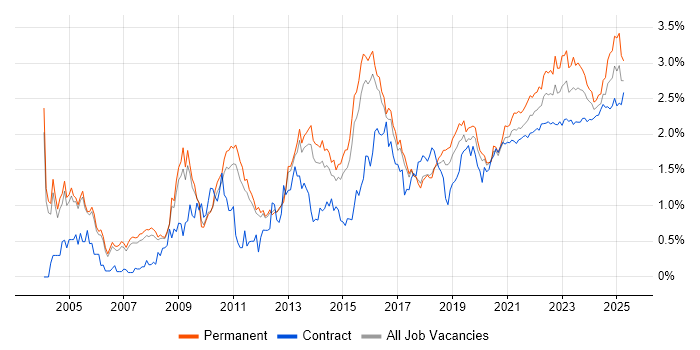
Management Information System trend for jobs with Hybrid/Remote/WFH options

Management Information System
Salary Trend for Jobs with a WFH Option

3-month moving average salary quoted in job vacancies with remote working options citing Management Information System.

Management Information System salary trend for jobs with a WFH option

Management Information System
Salary Histogram for Jobs with a WFH Option

Salary distribution for jobs with remote working options citing Management Information System over the 6 months to 18 July 2025.

Management Information System salary histogram for jobs with a WFH option

Management Information System
Co-occurring Skills and Capabilities with WFH Options by Category

The follow tables expand on the table above by listing co-occurrences grouped by category. The same employment type, locality and period is covered with up to 20 co-occurrences shown in each of the following categories:

Application Platforms
1 30 (4.55%) Microsoft Exchange
2 25 (3.79%) SharePoint
3 9 (1.37%) CMS
4 7 (1.06%) Confluence
5 6 (0.91%) Apache
6 5 (0.76%) IIS
6 5 (0.76%) Umbraco
7 4 (0.61%) WordPress
8 3 (0.46%) ArcGIS
8 3 (0.46%) nginx
9 2 (0.30%) SAS
9 2 (0.30%) ThingWorx
10 1 (0.15%) Apache Airflow
Applications
1 65 (9.86%) Microsoft Excel
2 37 (5.61%) Microsoft Office
3 16 (2.43%) Microsoft PowerPoint
4 6 (0.91%) Microsoft Project
5 4 (0.61%) MS Visio
5 4 (0.61%) Revit
5 4 (0.61%) Spreadsheet
6 3 (0.46%) AutoCAD
6 3 (0.46%) Blender
6 3 (0.46%) ProjectWise
7 2 (0.30%) Notion
8 1 (0.15%) Adobe Captivate
8 1 (0.15%) Adobe Illustrator
8 1 (0.15%) Adobe Premiere
8 1 (0.15%) Photoshop
Business Applications
1 8 (1.21%) Oracle EBS
2 7 (1.06%) Salesforce CRM
3 4 (0.61%) ResourceLink
3 4 (0.61%) Sage X3
4 3 (0.46%) Dynamics CRM
5 2 (0.30%) Dynamics AX
5 2 (0.30%) Infor M3
6 1 (0.15%) CiviCRM
6 1 (0.15%) NetSuite
6 1 (0.15%) SAP S/4HANA
Cloud Services
1 177 (26.86%) AWS
2 104 (15.78%) Azure
2 104 (15.78%) Serverless
3 102 (15.48%) AWS Lambda
4 86 (13.05%) Power Platform
5 43 (6.53%) GCP
6 28 (4.25%) Power Automate
7 26 (3.95%) Microsoft 365
8 23 (3.49%) PaaS
9 22 (3.34%) Dynamics 365
10 21 (3.19%) Azure DevOps
10 21 (3.19%) Cloud Computing
10 21 (3.19%) SaaS
11 19 (2.88%) PowerApps
12 18 (2.73%) IaaS
13 12 (1.82%) Amazon EC2
14 11 (1.67%) Azure Data Factory
15 10 (1.52%) AWS CloudFormation
15 10 (1.52%) AWS Direct Connect
15 10 (1.52%) AWS KMS
Communications & Networking
1 162 (24.58%) Broadband
2 82 (12.44%) SSH
2 82 (12.44%) SSL
3 47 (7.13%) Firewall
4 32 (4.86%) Network Security
5 20 (3.03%) DNS
5 20 (3.03%) TCP/IP
6 14 (2.12%) DHCP
7 13 (1.97%) WAN
8 11 (1.67%) VPN
8 11 (1.67%) Wi-Fi
9 10 (1.52%) BGP
9 10 (1.52%) Cisco ASA
9 10 (1.52%) Cisco Firepower
9 10 (1.52%) IPsec
9 10 (1.52%) MPLS
9 10 (1.52%) NX-OS
9 10 (1.52%) OSPF
9 10 (1.52%) SD-WAN
9 10 (1.52%) WLAN
Database & Business Intelligence
1 66 (10.02%) Power BI
2 39 (5.92%) Data Warehouse
3 25 (3.79%) NoSQL
4 15 (2.28%) Data Lake
4 15 (2.28%) Tick Data
5 14 (2.12%) Oracle Reports
6 13 (1.97%) Relational Database
7 10 (1.52%) SQL Server
7 10 (1.52%) SQL Server Integration Services
7 10 (1.52%) SQL Server Reporting Services
7 10 (1.52%) Star Schema
7 10 (1.52%) Tableau
8 9 (1.37%) Metadata
9 8 (1.21%) Big Data
10 7 (1.06%) MySQL
11 5 (0.76%) BigQuery
11 5 (0.76%) Data Mining
11 5 (0.76%) GIS
12 4 (0.61%) MariaDB
12 4 (0.61%) SAP HANA
Development Applications
1 22 (3.34%) Git
2 16 (2.43%) JIRA
3 15 (2.28%) Jenkins
4 10 (1.52%) SQL Server Management Studio (SSMS)
5 9 (1.37%) Cucumber
5 9 (1.37%) GitLab
5 9 (1.37%) IntelliJ
5 9 (1.37%) JUnit
5 9 (1.37%) Maven
5 9 (1.37%) Mockito
6 5 (0.76%) SonarQube
7 3 (0.46%) Babel
7 3 (0.46%) gulp
7 3 (0.46%) webpack
8 1 (0.15%) Bitbucket
General
1 328 (49.77%) Social Skills
2 179 (27.16%) Finance
3 82 (12.44%) Games
4 60 (9.10%) Analytical Skills
5 50 (7.59%) Marketing
6 40 (6.07%) Inclusion and Diversity
7 33 (5.01%) Banking
8 30 (4.55%) Public Sector
9 29 (4.40%) Retail
10 27 (4.10%) Legal
10 27 (4.10%) Presentation Skills
11 21 (3.19%) German Language
12 18 (2.73%) Organisational Skills
13 17 (2.58%) Influencing Skills
13 17 (2.58%) Manufacturing
14 14 (2.12%) Law
15 11 (1.67%) Advertising
15 11 (1.67%) Telecoms
16 9 (1.37%) Back Office
16 9 (1.37%) Fire and Rescue
Job Titles
1 126 (19.12%) Senior
2 102 (15.48%) Analyst
3 89 (13.51%) ServiceNow Manager
4 88 (13.35%) DevOps Engineer
5 87 (13.20%) Cloud Engineer
6 82 (12.44%) Senior Manager
7 79 (11.99%) Engineering Manager
8 78 (11.84%) Senior Service Manager
9 56 (8.50%) Architect
10 44 (6.68%) Developer
11 40 (6.07%) Data Analyst
12 37 (5.61%) Solutions Architect
13 36 (5.46%) Lead
14 34 (5.16%) AWS Architect
15 26 (3.95%) Procurement Analyst
16 25 (3.79%) ETL Developer
17 23 (3.49%) AWS DevOps
17 23 (3.49%) Senior DevOps
18 22 (3.34%) AWS Solution Architect
19 21 (3.19%) TOGAF Architect
Libraries, Frameworks & Software Standards
1 82 (12.44%) RESTful
1 82 (12.44%) Web Services
2 21 (3.19%) SailPoint
3 13 (1.97%) Elastic Stack
4 12 (1.82%) Kafka
4 12 (1.82%) Node.js
5 9 (1.37%) ActiveMQ
5 9 (1.37%) HTML
5 9 (1.37%) JMS
5 9 (1.37%) Spring
5 9 (1.37%) Spring Boot
6 8 (1.21%) .NET
7 6 (0.91%) CSS
7 6 (0.91%) EDI
7 6 (0.91%) REST
8 5 (0.76%) Leaflet
8 5 (0.76%) Oracle Fusion
9 4 (0.61%) Azure Blueprints
9 4 (0.61%) Lightning Web Components
9 4 (0.61%) React
Miscellaneous
1 98 (14.87%) Onboarding
2 91 (13.81%) Product Ownership
3 87 (13.20%) Cyber Threat
4 86 (13.05%) Cyberattack
5 82 (12.44%) PKI
6 79 (11.99%) Video\Live Streaming
7 28 (4.25%) Data Centre
8 25 (3.79%) Virtual Team
9 23 (3.49%) Self-Motivation
10 19 (2.88%) Cloud Native
10 19 (2.88%) NHS
11 15 (2.28%) Enterprise Software
12 11 (1.67%) Security Posture
12 11 (1.67%) Social Media
13 10 (1.52%) CMDB
13 10 (1.52%) Operational Technology
14 9 (1.37%) Credit Derivative
14 9 (1.37%) Security Operations Centre
15 8 (1.21%) Mainframe
15 8 (1.21%) Pricing Data
Operating Systems
1 46 (6.98%) Linux
2 43 (6.53%) Windows
3 10 (1.52%) Red Hat Enterprise Linux
3 10 (1.52%) Windows Server
4 7 (1.06%) Mac OS
4 7 (1.06%) Ubuntu
4 7 (1.06%) Windows 10
5 4 (0.61%) CentOS
6 3 (0.46%) Unix
7 2 (0.30%) Windows Server 2019
8 1 (0.15%) Debian
8 1 (0.15%) Mac OS X
8 1 (0.15%) OpenVMS
8 1 (0.15%) Windows 7
8 1 (0.15%) Windows Server 2016
Processes & Methodologies
1 202 (30.65%) Roadmaps
2 200 (30.35%) Deployment Automation
3 165 (25.04%) Cybersecurity
4 161 (24.43%) DevOps
5 153 (23.22%) Computer Science
6 139 (21.09%) Change Management
7 117 (17.75%) Software Engineering
8 115 (17.45%) Incident Management
9 109 (16.54%) Data Management
10 108 (16.39%) Agile
11 103 (15.63%) ITSM
12 101 (15.33%) Service Delivery
13 99 (15.02%) Analytics
14 95 (14.42%) Problem-Solving
15 94 (14.26%) Risk Management
16 92 (13.96%) Key Management
17 90 (13.66%) Information Security
18 89 (13.51%) Mentoring
19 87 (13.20%) Problem Management
19 87 (13.20%) Vulnerability Assessment
Programming Languages
1 149 (22.61%) Python
2 81 (12.29%) SQL
3 46 (6.98%) Java
4 37 (5.61%) PowerShell
5 18 (2.73%) C#
6 15 (2.28%) R
7 9 (1.37%) C++
8 8 (1.21%) T-SQL
9 6 (0.91%) JavaScript
10 4 (0.61%) Shell Script
11 3 (0.46%) Bash
12 2 (0.30%) Bicep
12 2 (0.30%) COBOL
12 2 (0.30%) Kusto Query Language
12 2 (0.30%) Perl
12 2 (0.30%) VB.NET
13 1 (0.15%) Data Analysis Expressions
13 1 (0.15%) Progress 4GL
13 1 (0.15%) SAPscript
13 1 (0.15%) VB
Qualifications
1 259 (39.30%) Degree
2 120 (18.21%) Computer Science Degree
3 42 (6.37%) Security Cleared
4 28 (4.25%) AWS Certification
5 25 (3.79%) AWS Certified Solutions Architect
6 24 (3.64%) SC Cleared
7 23 (3.49%) CISSP
8 18 (2.73%) Azure Certification
9 16 (2.43%) CISM
9 16 (2.43%) Microsoft Certification
10 15 (2.28%) Master's Degree
11 12 (1.82%) CISA
12 11 (1.67%) DBS Check
13 9 (1.37%) BPSS Clearance
13 9 (1.37%) MCP
14 8 (1.21%) CompTIA Security+
14 8 (1.21%) ITIL Foundation Certificate
14 8 (1.21%) TOGAF Certification
15 7 (1.06%) MCSA
15 7 (1.06%) MCSE
Quality Assurance & Compliance
1 125 (18.97%) ISO/IEC 27001
2 114 (17.30%) NIST
3 69 (10.47%) GDPR
4 63 (9.56%) Data Quality
5 28 (4.25%) HIPAA
6 21 (3.19%) QA
7 17 (2.58%) Accessibility
8 11 (1.67%) Cyber Essentials
9 9 (1.37%) SLA
10 8 (1.21%) COBIT
10 8 (1.21%) NCSC
10 8 (1.21%) SOC 2
11 7 (1.06%) ISO/IEC 27002 (supersedes ISO/IEC 17799)
12 6 (0.91%) GRC
13 4 (0.61%) PCI DSS
13 4 (0.61%) PMO
14 3 (0.46%) Actionable Recommendations
14 3 (0.46%) HAZOP
14 3 (0.46%) IEC 61131
14 3 (0.46%) ISO 9001
System Software
1 126 (19.12%) Active Directory
2 46 (6.98%) Docker
3 12 (1.82%) VMware Infrastructure
4 9 (1.37%) Hyper-V
5 8 (1.21%) Firmware
6 5 (0.76%) vSphere
7 4 (0.61%) Virtual Servers
7 4 (0.61%) VMware ESXi
8 2 (0.30%) Veritas Cluster Server
9 1 (0.15%) NFS
9 1 (0.15%) Virtual Machines
Systems Management
1 115 (17.45%) Terraform
2 37 (5.61%) Kubernetes
3 24 (3.64%) Ansible
4 11 (1.67%) Grafana
4 11 (1.67%) Prometheus
5 7 (1.06%) PaperCut
6 6 (0.91%) SCCM
7 5 (0.76%) ZABBIX
8 3 (0.46%) Functional Safety
9 2 (0.30%) Host Intrusion Detection System
9 2 (0.30%) Microsoft Intune
9 2 (0.30%) Progress Chef
9 2 (0.30%) Puppet
9 2 (0.30%) SCOM
9 2 (0.30%) Single Sign-On
10 1 (0.15%) Active Directory Federation Services
10 1 (0.15%) NetBackup
10 1 (0.15%) Systems Management Server (SMS)
Vendors
1 114 (17.30%) Microsoft
2 98 (14.87%) ServiceNow
3 82 (12.44%) Thales
4 48 (7.28%) Google
5 45 (6.83%) SAP
6 44 (6.68%) Salesforce
7 22 (3.34%) Oracle
8 21 (3.19%) Databricks
8 21 (3.19%) Okta
9 14 (2.12%) Cisco
10 13 (1.97%) VMware
11 12 (1.82%) IBM
12 10 (1.52%) CheckPoint
12 10 (1.52%) Dynatrace
12 10 (1.52%) Infoblox
12 10 (1.52%) SolarWinds
13 7 (1.06%) Red Hat
14 6 (0.91%) Cognos
14 6 (0.91%) Meraki
15 5 (0.76%) Sage