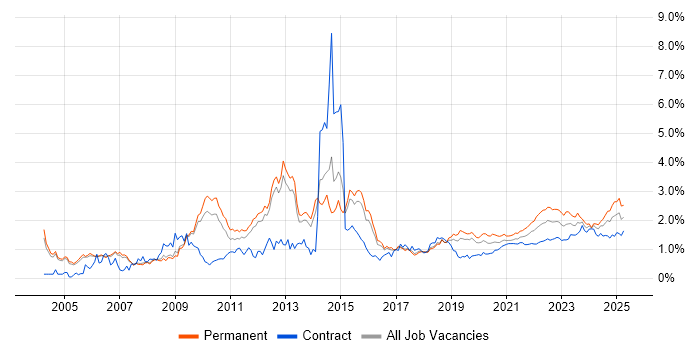
Organisational Skills Jobs with Work from Home Options

Organisational Skills
UK > Work from Home

The table below looks at the prevalence of the term Organisational Skills in remote or hybrid work. Included is a benchmarking guide to the salaries offered in vacancies that cited Organisational Skills over the 6 months leading up to 26 July 2024, comparing them to the same period in the previous two years.

6 months to
26 Jul 2024
Same period 2023 Same period 2022
Rank 206 178 178
Rank change year-on-year -28 0 +45
Permanent jobs citing Organisational Skills 441 641 1,869
As % of all permanent jobs with a WFH option 1.58% 1.95% 2.38%
As % of the General category 2.59% 3.00% 3.60%
Number of salaries quoted 285 462 924
10th Percentile £25,000 £31,250 £30,000
25th Percentile £30,143 £39,000 £36,250
Median annual salary (50th Percentile) £42,500 £52,500 £50,000
Median % change year-on-year -19.05% +5.00% -
75th Percentile £60,000 £67,500 £64,700
90th Percentile £67,500 £95,000 £76,250
UK median annual salary £37,640 £45,600 £50,000
% change year-on-year -17.46% -8.80% +5.26%

All General Skills
Work from Home

Organisational Skills falls under the General Skills category. For comparison with the information above, the following table provides summary statistics for all permanent job vacancies with remote or hybrid options requiring common skills.

Permanent vacancies with a requirement for common skills 17,022 21,367 51,870
As % of all permanent jobs with a WFH option 60.93% 65.11% 66.05%
Number of salaries quoted 11,520 15,606 26,987
10th Percentile £32,500 £36,250 £35,000
25th Percentile £42,500 £46,570 £45,000
Median annual salary (50th Percentile) £57,500 £62,500 £60,000
Median % change year-on-year -8.00% +4.17% +7.14%
75th Percentile £77,500 £82,500 £80,000
90th Percentile £100,000 £102,500 £96,250
UK median annual salary £54,000 £60,000 £60,000
% change year-on-year -10.00% - +6.19%

Organisational Skills
Trend for Jobs with a WFH Option

Job vacancies with a work from home option citing Organisational Skills as a proportion of all IT jobs advertised.

Organisational Skills trend for jobs with a WFH option

Organisational Skills
Salary Trend for Jobs with a WFH Option

3-month moving average salary quoted in job vacancies with a work from home option citing Organisational Skills.

Organisational Skills salary trend for jobs with a WFH option

Organisational Skills
Salary Histogram for Jobs with a WFH Option

Salary distribution for jobs with a work from home option citing Organisational Skills over the 6 months to 26 July 2024.

Organisational Skills salary histogram for jobs with a WFH option

Organisational Skills
Co-occurring Skills and Capabilities with WFH Options by Category

The follow tables expand on the table above by listing co-occurrences grouped by category. The same employment type, locality and period is covered with up to 20 co-occurrences shown in each of the following categories:

Application Platforms
1 36 (8.16%) SharePoint
2 21 (4.76%) CMS
3 17 (3.85%) Microsoft Exchange
4 6 (1.36%) Kentico
5 5 (1.13%) IIS
6 3 (0.68%) Confluence
6 3 (0.68%) Orchard CMS
6 3 (0.68%) Umbraco
7 1 (0.23%) Drupal
7 1 (0.23%) Exchange Server 2007
7 1 (0.23%) Exchange Server 2010
7 1 (0.23%) Exchange Server 2013
7 1 (0.23%) IBM Notes
7 1 (0.23%) SAS
7 1 (0.23%) SharePoint Server
7 1 (0.23%) WordPress
Applications
1 100 (22.68%) Microsoft Office
2 76 (17.23%) Microsoft Excel
3 16 (3.63%) Microsoft PowerPoint
4 6 (1.36%) Microsoft Project
5 5 (1.13%) Photoshop
6 4 (0.91%) Adobe Creative Suite
6 4 (0.91%) MS Visio
7 3 (0.68%) Adobe Illustrator
7 3 (0.68%) InDesign
8 2 (0.45%) Adobe After Effects
9 1 (0.23%) Adobe Premiere
9 1 (0.23%) Adobe XD
9 1 (0.23%) CapCut
9 1 (0.23%) Chatbot
9 1 (0.23%) Maya
9 1 (0.23%) Spreadsheet
9 1 (0.23%) ZBrush
Business Applications
1 5 (1.13%) NEC Housing
2 4 (0.91%) Raiser’s Edge
3 3 (0.68%) Dynamics CRM
4 2 (0.45%) NetSuite
4 2 (0.45%) Odoo
5 1 (0.23%) Dynamics NAV
5 1 (0.23%) Elite 3E
5 1 (0.23%) Primavera
Cloud Services
1 69 (15.65%) Azure
2 65 (14.74%) Microsoft 365
3 33 (7.48%) Power Platform
4 16 (3.63%) SaaS
5 15 (3.40%) AWS
6 13 (2.95%) Azure DevOps
6 13 (2.95%) PowerApps
7 10 (2.27%) Entra ID
7 10 (2.27%) Power Automate
8 8 (1.81%) Dynamics 365
9 7 (1.59%) GCP
10 6 (1.36%) Basecamp
10 6 (1.36%) Google Workspace
10 6 (1.36%) Kontent
10 6 (1.36%) OneDrive
11 4 (0.91%) Azure Sentinel
11 4 (0.91%) Canva
11 4 (0.91%) Google Sheets
11 4 (0.91%) Smartsheet
12 3 (0.68%) IaaS
Communications & Networking
1 16 (3.63%) Firewall
2 15 (3.40%) WAN
3 14 (3.17%) LAN
4 13 (2.95%) SAN
5 12 (2.72%) DNS
6 8 (1.81%) TCP/IP
6 8 (1.81%) VPN
7 7 (1.59%) Internet
8 6 (1.36%) Remote Desktop
8 6 (1.36%) WLAN
9 5 (1.13%) DHCP
9 5 (1.13%) Wireless
10 4 (0.91%) FTP
10 4 (0.91%) Intranet
10 4 (0.91%) NAS
10 4 (0.91%) Network Security
10 4 (0.91%) VoIP
11 3 (0.68%) BIG-IP
11 3 (0.68%) Fibre Channel
11 3 (0.68%) iSCSI
Database & Business Intelligence
1 24 (5.44%) Power BI
2 18 (4.08%) SQL Server
3 10 (2.27%) Amazon RDS
4 3 (0.68%) Azure SQL Database
4 3 (0.68%) Data Lake
4 3 (0.68%) Data Vault
4 3 (0.68%) Data Warehouse
4 3 (0.68%) DTS
4 3 (0.68%) OLAP
5 2 (0.45%) Metadata
5 2 (0.45%) MySQL
5 2 (0.45%) PostgreSQL
5 2 (0.45%) SAP HANA
5 2 (0.45%) SQL Server Reporting Services
5 2 (0.45%) Tableau
6 1 (0.23%) Data Mining
6 1 (0.23%) NoSQL
6 1 (0.23%) Relational Database
Development Applications
1 22 (4.99%) JIRA
2 6 (1.36%) Git
3 5 (1.13%) Team Foundation Server
4 4 (0.91%) AdminStudio
4 4 (0.91%) InstallShield
4 4 (0.91%) MSI
5 2 (0.45%) Jenkins
6 1 (0.23%) Cucumber
6 1 (0.23%) JUnit
6 1 (0.23%) PHPUnit
6 1 (0.23%) Postman
6 1 (0.23%) Selenium
6 1 (0.23%) Spinnaker
6 1 (0.23%) TeamCity
6 1 (0.23%) Tricentis qTest
6 1 (0.23%) Visual Studio
General
1 301 (68.25%) Social Skills
2 74 (16.78%) Analytical Skills
3 59 (13.38%) Finance
4 43 (9.75%) Marketing
5 41 (9.30%) Retail
6 39 (8.84%) Legal
7 37 (8.39%) Inclusion and Diversity
8 18 (4.08%) Presentation Skills
9 13 (2.95%) Law
9 13 (2.95%) Public Sector
10 10 (2.27%) Pharmaceutical
11 9 (2.04%) Manufacturing
12 6 (1.36%) Aerospace
12 6 (1.36%) Local Government
12 6 (1.36%) Police
12 6 (1.36%) Publishing
13 5 (1.13%) Advertising
13 5 (1.13%) Aviation
13 5 (1.13%) Influencing Skills
13 5 (1.13%) Telecoms
Job Titles
1 54 (12.24%) Analyst
2 49 (11.11%) Project Manager
3 48 (10.88%) Coordinator
4 28 (6.35%) Lead
5 21 (4.76%) Senior
6 20 (4.54%) Administrator
7 19 (4.31%) Architect
8 18 (4.08%) Developer
9 16 (3.63%) IT Support
10 15 (3.40%) Consultant
11 13 (2.95%) IT Manager
12 12 (2.72%) Digital Project Manager
12 12 (2.72%) Project Coordinator
13 11 (2.49%) Head of Design
13 11 (2.49%) IT Analyst
13 11 (2.49%) IT Engineer
13 11 (2.49%) Trainer
14 10 (2.27%) Business Analyst
14 10 (2.27%) IT Project Manager
14 10 (2.27%) Service Analyst
Libraries, Frameworks & Software Standards
1 14 (3.17%) .NET
2 12 (2.72%) XML
3 9 (2.04%) HTML
4 8 (1.81%) CSS
5 6 (1.36%) BREW
6 4 (0.91%) .NET Core
6 4 (0.91%) Blazor
6 4 (0.91%) jQuery
6 4 (0.91%) JSON
6 4 (0.91%) React
6 4 (0.91%) Twitter Bootstrap
7 3 (0.68%) AngularJS
7 3 (0.68%) ASP.NET
7 3 (0.68%) HTML5 Canvas
7 3 (0.68%) Sass
7 3 (0.68%) Vue
7 3 (0.68%) YAML
8 2 (0.45%) HTML5
8 2 (0.45%) Middleware
9 1 (0.23%) Web Services
Miscellaneous
1 82 (18.59%) Self-Motivation
2 26 (5.90%) Management Information System
3 21 (4.76%) Driving Licence
4 19 (4.31%) Hybrid Cloud
4 19 (4.31%) Social Media
5 18 (4.08%) Data Centre
6 12 (2.72%) Animation
7 10 (2.27%) Algorithms
8 9 (2.04%) Analytical Mindset
8 9 (2.04%) Data Structures
9 8 (1.81%) Enterprise Storage
9 8 (1.81%) Graphic Design
10 7 (1.59%) Mobile App
10 7 (1.59%) Product Ownership
10 7 (1.59%) Public Cloud
11 6 (1.36%) EPoS
12 5 (1.13%) Blog
12 5 (1.13%) Onboarding
13 4 (0.91%) Podcast
13 4 (0.91%) Video Editing
Operating Systems
1 43 (9.75%) Windows
2 22 (4.99%) Windows Server
3 14 (3.17%) Windows Server 2019
4 10 (2.27%) Windows 10
5 9 (2.04%) Mac OS
6 8 (1.81%) Windows 7
7 5 (1.13%) Linux
8 4 (0.91%) Android
8 4 (0.91%) Apple iOS
9 3 (0.68%) Windows 8
9 3 (0.68%) Windows Server 2012
10 2 (0.45%) CentOS
10 2 (0.45%) Ubuntu
10 2 (0.45%) Windows Server 2008
10 2 (0.45%) Windows Server 2016
Processes & Methodologies
1 144 (32.65%) Problem-Solving
2 87 (19.73%) Project Management
3 86 (19.50%) Agile
4 85 (19.27%) Time Management
5 67 (15.19%) Customer Service
6 61 (13.83%) ITIL
7 55 (12.47%) Mentoring
8 46 (10.43%) Continuous Improvement
9 42 (9.52%) CRM
9 42 (9.52%) Stakeholder Management
10 41 (9.30%) Coaching
11 37 (8.39%) Project Delivery
12 28 (6.35%) Incident Management
12 28 (6.35%) Migration
13 27 (6.12%) Change Management
13 27 (6.12%) Collaborative Working
13 27 (6.12%) Cybersecurity
13 27 (6.12%) PRINCE2
14 25 (5.67%) Decision-Making
15 24 (5.44%) Analytics
Programming Languages
1 26 (5.90%) SQL
2 13 (2.95%) C#
3 12 (2.72%) PowerShell
4 9 (2.04%) Python
5 8 (1.81%) JavaScript
6 4 (0.91%) T-SQL
6 4 (0.91%) VB
7 3 (0.68%) C++
7 3 (0.68%) PHP
8 2 (0.45%) Go
8 2 (0.45%) PL/SQL
8 2 (0.45%) VB.NET
9 1 (0.23%) Bash
9 1 (0.23%) Clipper
9 1 (0.23%) Dart
9 1 (0.23%) Java
9 1 (0.23%) R
9 1 (0.23%) TypeScript
9 1 (0.23%) XPath
Qualifications
1 54 (12.24%) Degree
2 43 (9.75%) DBS Check
3 20 (4.54%) Microsoft Certification
4 14 (3.17%) Azure Certification
5 12 (2.72%) PMI Certification
6 11 (2.49%) PMP
7 9 (2.04%) APMP
8 8 (1.81%) Cisco Certification
8 8 (1.81%) ITIL Certification
8 8 (1.81%) MCSE
9 7 (1.59%) CCNA
10 6 (1.36%) ISEB
10 6 (1.36%) PRINCE2 Practitioner
10 6 (1.36%) Security Cleared
11 5 (1.13%) Computer Science Degree
11 5 (1.13%) DV Cleared
11 5 (1.13%) Postgraduate
12 4 (0.91%) PRINCE2 Certification
12 4 (0.91%) SC Cleared
13 2 (0.45%) Network+ Certification
Quality Assurance & Compliance
1 25 (5.67%) QA
2 18 (4.08%) SLA
3 17 (3.85%) PMO
4 12 (2.72%) Accessibility
4 12 (2.72%) GDPR
5 11 (2.49%) Data Quality
5 11 (2.49%) ISO/IEC 27001
6 5 (1.13%) Cyber Essentials
6 5 (1.13%) ISO 9001
7 2 (0.45%) Cyber Essentials PLUS
7 2 (0.45%) NIST
7 2 (0.45%) Sarbanes-Oxley
7 2 (0.45%) SOX 404
8 1 (0.23%) Actionable Recommendations
8 1 (0.23%) GxP
8 1 (0.23%) P3O
System Software
1 41 (9.30%) Active Directory
2 20 (4.54%) VMware Infrastructure
3 14 (3.17%) Hyper-V
4 5 (1.13%) Virtual Machines
5 4 (0.91%) Microsoft App-V
5 4 (0.91%) vSphere
5 4 (0.91%) XenDesktop
6 3 (0.68%) Firmware
6 3 (0.68%) VirtualBox
6 3 (0.68%) VMware ESXi
6 3 (0.68%) XenApp
7 2 (0.45%) Microsoft Virtual Server
7 2 (0.45%) Terminal Server
7 2 (0.45%) Virtual Desktop
7 2 (0.45%) Virtual Servers
8 1 (0.23%) BitLocker
8 1 (0.23%) Docker
Systems Management
1 7 (1.59%) Microsoft Intune
1 7 (1.59%) SCCM
1 7 (1.59%) Terraform
1 7 (1.59%) WSUS
2 3 (0.68%) Ansible
3 2 (0.45%) Autotask
3 2 (0.45%) vCenter Server
4 1 (0.23%) Active Directory Federation Services
4 1 (0.23%) Kubernetes
Vendors
1 198 (44.90%) Microsoft
2 21 (4.76%) Google
3 20 (4.54%) VMware
4 19 (4.31%) Adobe
4 19 (4.31%) Dell
5 16 (3.63%) Apple
6 15 (3.40%) NetApp
7 13 (2.95%) Cisco
8 10 (2.27%) Screaming Frog
9 9 (2.04%) SAP
9 9 (2.04%) ServiceNow
10 8 (1.81%) Ahrefs
11 7 (1.59%) Meraki
12 6 (1.36%) Citrix
12 6 (1.36%) Twitter
13 5 (1.13%) NEC
14 4 (0.91%) Capita
14 4 (0.91%) F5
14 4 (0.91%) IBM
14 4 (0.91%) Veeam