Self-Motivation Jobs with Hybrid/Remote/WFH Options

Self-Motivation
UK > Work from Home

The table below looks at the prevalence of the term Self-Motivation in remote or hybrid work. Included is a benchmarking guide to the salaries offered in vacancies that cited Self-Motivation over the 6 months leading up to 5 May 2025, comparing them to the same period in the previous two years.

6 months to
5 May 2025
Same period 2024 Same period 2023
Rank 139 103 143
Rank change year-on-year -36 +40 -28
Permanent jobs citing Self-Motivation 374 952 1,072
As % of all permanent jobs with a WFH option 2.43% 2.82% 2.53%
As % of the Miscellaneous category 6.24% 7.93% 6.54%
Number of salaries quoted 202 713 749
10th Percentile £31,750 £25,000 £31,250
25th Percentile £36,563 £32,500 £38,750
Median annual salary (50th Percentile) £54,500 £49,000 £55,000
Median % change year-on-year +11.22% -10.91% -
75th Percentile £68,250 £63,000 £74,250
90th Percentile £93,625 £72,500 £87,500
UK median annual salary £50,000 £40,000 £52,500
% change year-on-year +25.00% -23.81% -

All Generic Skills
Work from Home

Self-Motivation falls under the General and Transferable Skills category. For comparison with the information above, the following table provides summary statistics for all permanent job vacancies with remote or hybrid options requiring generic IT skills.

Permanent vacancies with a requirement for generic IT skills 5,992 12,005 16,380
As % of all permanent jobs with a WFH option 38.86% 35.53% 38.65%
Number of salaries quoted 3,850 9,227 11,835
10th Percentile £34,975 £32,500 £39,000
25th Percentile £47,231 £42,500 £48,750
Median annual salary (50th Percentile) £65,000 £59,300 £65,000
Median % change year-on-year +9.61% -8.77% -
75th Percentile £85,000 £78,750 £86,250
90th Percentile £122,500 £101,250 £107,500
UK median annual salary £60,000 £55,000 £65,000
% change year-on-year +9.09% -15.38% +4.00%

Self-Motivation
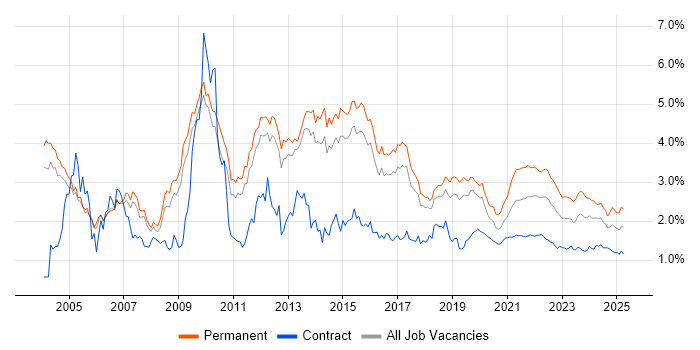
Trend for Jobs with a WFH Option

Job vacancies with remote working options citing Self-Motivation as a proportion of all IT jobs advertised.

Self-Motivation trend for jobs with Hybrid/Remote/WFH options

Self-Motivation
Salary Trend for Jobs with a WFH Option

3-month moving average salary quoted in job vacancies with remote working options citing Self-Motivation.

Self-Motivation salary trend for jobs with a WFH option

Self-Motivation
Salary Histogram for Jobs with a WFH Option

Salary distribution for jobs with remote working options citing Self-Motivation over the 6 months to 5 May 2025.

Self-Motivation salary histogram for jobs with a WFH option

Self-Motivation
Co-occurring Skills and Capabilities with WFH Options by Category

The follow tables expand on the table above by listing co-occurrences grouped by category. The same employment type, locality and period is covered with up to 20 co-occurrences shown in each of the following categories:

Application Platforms
1 27 (7.22%) SharePoint
2 15 (4.01%) Microsoft Exchange
3 10 (2.67%) IIS
4 5 (1.34%) Tomcat
5 4 (1.07%) Apache
6 2 (0.53%) Skype for Business
7 1 (0.27%) Confluence
7 1 (0.27%) Oracle SOA Suite
7 1 (0.27%) Oracle Workflow
7 1 (0.27%) WordPress
Applications
1 23 (6.15%) Microsoft Office
2 11 (2.94%) Microsoft Excel
3 8 (2.14%) Microsoft PowerPoint
4 6 (1.60%) Revit
5 2 (0.53%) MS Visio
5 2 (0.53%) Trello
6 1 (0.27%) Adobe Premiere
6 1 (0.27%) Blender
6 1 (0.27%) Chatbot
6 1 (0.27%) Final Cut Pro
6 1 (0.27%) Microsoft Project
Business Applications
1 8 (2.14%) Salesforce CRM
2 4 (1.07%) NetSuite
3 3 (0.80%) Dynamics CRM
4 2 (0.53%) Sage 200
4 2 (0.53%) Sage CRM
5 1 (0.27%) Dynamics AX
5 1 (0.27%) Magento
5 1 (0.27%) Oracle EBS
5 1 (0.27%) Oracle HRMS
5 1 (0.27%) Oracle iRecruitment
5 1 (0.27%) SAP ERP
5 1 (0.27%) SAP S/4HANA
5 1 (0.27%) Shopify
Cloud Services
1 122 (32.62%) Azure
2 79 (21.12%) AWS
3 60 (16.04%) GCP
4 39 (10.43%) Microsoft 365
5 27 (7.22%) SaaS
6 14 (3.74%) OneDrive
7 13 (3.48%) Microsoft Copilot
8 12 (3.21%) Azure DevOps
9 11 (2.94%) Entra ID
10 8 (2.14%) Power Platform
11 7 (1.87%) Google Workspace
12 6 (1.60%) Azure Monitor
13 5 (1.34%) Canva
13 5 (1.34%) Cloud Computing
13 5 (1.34%) Google Analytics
13 5 (1.34%) Power Automate
14 4 (1.07%) CloudFront
15 3 (0.80%) Figma
15 3 (0.80%) IaaS
15 3 (0.80%) WhatsApp
Communications & Networking
1 43 (11.50%) Firewall
2 22 (5.88%) Wi-Fi
3 15 (4.01%) DNS
4 14 (3.74%) WAN
5 13 (3.48%) TCP/IP
6 11 (2.94%) SD-WAN
7 10 (2.67%) VPN
8 9 (2.41%) LAN
9 8 (2.14%) Wireless
10 7 (1.87%) DHCP
10 7 (1.87%) HTTP
10 7 (1.87%) Internet
10 7 (1.87%) Network Security
11 6 (1.60%) SSL
11 6 (1.60%) VLAN
12 5 (1.34%) 5G
12 5 (1.34%) DMARC
12 5 (1.34%) IPsec
13 4 (1.07%) Cisco Firepower
13 4 (1.07%) WebEx
Database & Business Intelligence
1 20 (5.35%) SQL Server
2 11 (2.94%) Relational Database
3 9 (2.41%) PostgreSQL
4 6 (1.60%) Power BI
5 5 (1.34%) MySQL
6 3 (0.80%) SQL Server Integration Services
7 2 (0.53%) Azure SQL Database
7 2 (0.53%) Crystal Reports
7 2 (0.53%) Data Mining
7 2 (0.53%) Data Warehouse
7 2 (0.53%) KDB
7 2 (0.53%) Kdb+
7 2 (0.53%) Metadata
7 2 (0.53%) MongoDB
7 2 (0.53%) NonStop SQL
7 2 (0.53%) NoSQL
7 2 (0.53%) RDBMS
7 2 (0.53%) Tableau
8 1 (0.27%) Oracle BI Publisher
8 1 (0.27%) QGIS
Development Applications
1 16 (4.28%) Git
2 9 (2.41%) JIRA
3 7 (1.87%) Visual Studio
4 4 (1.07%) GitLab
4 4 (1.07%) Subversion
5 3 (0.80%) GDB
6 2 (0.53%) Axure RP
6 2 (0.53%) Babel
6 2 (0.53%) Jenkins
6 2 (0.53%) Maven
6 2 (0.53%) Mocha
6 2 (0.53%) webpack
7 1 (0.27%) Cypress.io
7 1 (0.27%) Selenium
7 1 (0.27%) WebDriver
General
1 185 (49.47%) Social Skills
2 102 (27.27%) Finance
3 75 (20.05%) Inclusion and Diversity
4 45 (12.03%) Analytical Skills
5 36 (9.63%) Presentation Skills
6 33 (8.82%) Public Sector
7 26 (6.95%) Banking
8 25 (6.68%) Marketing
9 22 (5.88%) Organisational Skills
10 18 (4.81%) Legal
11 17 (4.55%) Manufacturing
12 14 (3.74%) Local Government
13 10 (2.67%) Advertising
13 10 (2.67%) Law
14 8 (2.14%) Retail
15 7 (1.87%) Electronics
15 7 (1.87%) Telecoms
16 5 (1.34%) Back Office
16 5 (1.34%) Brand Awareness
16 5 (1.34%) Czech Language
Job Titles
1 111 (29.68%) Senior
2 56 (14.97%) Software Engineer
3 53 (14.17%) Senior Software Engineer
4 36 (9.63%) Developer
5 29 (7.75%) Analyst
5 29 (7.75%) IT Support
6 25 (6.68%) Support Engineer
7 23 (6.15%) Senior Developer
8 21 (5.61%) Technical Support
9 20 (5.35%) Consultant
10 18 (4.81%) Business Manager
11 17 (4.55%) Business Development Manager
11 17 (4.55%) Development Manager
12 16 (4.28%) Lead
13 14 (3.74%) Project Manager
14 13 (3.48%) IT Engineer
14 13 (3.48%) IT Support Engineer
14 13 (3.48%) Support Analyst
15 11 (2.94%) Technical Engineer
15 11 (2.94%) Technical Support Engineer
Libraries, Frameworks & Software Standards
1 75 (20.05%) .NET
2 55 (14.71%) Node.js
3 13 (3.48%) Blazor
3 13 (3.48%) HTML
4 8 (2.14%) Bootstrap
4 8 (2.14%) HTML5
5 7 (1.87%) REST
6 6 (1.60%) JSON
6 6 (1.60%) WinForms
6 6 (1.60%) XML
7 5 (1.34%) RESTful
7 5 (1.34%) SOAP
8 3 (0.80%) AngularJS
8 3 (0.80%) OpenEmbedded
8 3 (0.80%) React
8 3 (0.80%) Yocto
9 2 (0.53%) Android SDK
9 2 (0.53%) Jest
9 2 (0.53%) Redux
9 2 (0.53%) RxJS
Miscellaneous
1 54 (14.44%) Linux Command Line
2 53 (14.17%) Cyberattack
3 23 (6.15%) Onboarding
4 19 (5.08%) Management Information System
5 17 (4.55%) Virtual Team
6 13 (3.48%) Video Conferencing
7 10 (2.67%) Enterprise Software
8 8 (2.14%) Data Centre
8 8 (2.14%) FMCG
8 8 (2.14%) Social Media
9 6 (1.60%) Algorithms
9 6 (1.60%) Blog
9 6 (1.60%) Driving Licence
9 6 (1.60%) Product Ownership
9 6 (1.60%) Tandem
10 5 (1.34%) FPGA
10 5 (1.34%) GNSS
10 5 (1.34%) Self-Driving Car
11 4 (1.07%) MicroBlaze
11 4 (1.07%) Team-Oriented Environment
Operating Systems
1 95 (25.40%) Linux
2 76 (20.32%) Windows
3 32 (8.56%) Windows Server
4 20 (5.35%) Mac OS
5 18 (4.81%) Unix
6 10 (2.67%) Apple iOS
6 10 (2.67%) Windows Server 2019
7 6 (1.60%) zOS
8 5 (1.34%) Windows 7
9 3 (0.80%) Embedded Linux
10 2 (0.53%) Android
10 2 (0.53%) Red Hat Enterprise Linux
10 2 (0.53%) Windows Server 2003
11 1 (0.27%) Debian
11 1 (0.27%) VMS
11 1 (0.27%) Windows 10
Processes & Methodologies
1 139 (37.17%) Problem-Solving
2 107 (28.61%) Agile
3 75 (20.05%) Mentoring
4 70 (18.72%) Customer Service
4 70 (18.72%) Software Engineering
5 60 (16.04%) Cloud Security
5 60 (16.04%) User Experience
6 59 (15.78%) Scrum
7 56 (14.97%) Machine Learning
8 54 (14.44%) Microservices
9 53 (14.17%) Data Engineering
9 53 (14.17%) Site Reliability Engineering
10 48 (12.83%) B2B
11 36 (9.63%) CRM
11 36 (9.63%) ITIL
12 34 (9.09%) Project Management
13 28 (7.49%) Roadmaps
14 25 (6.68%) Collaborative Working
14 25 (6.68%) Project Delivery
14 25 (6.68%) Stakeholder Management
Programming Languages
1 76 (20.32%) Python
2 71 (18.98%) Java
3 69 (18.45%) C++
4 66 (17.65%) JavaScript
5 65 (17.38%) SQL
6 53 (14.17%) Go
6 53 (14.17%) Rust
7 18 (4.81%) C#
8 15 (4.01%) PowerShell
9 12 (3.21%) C
10 10 (2.67%) Bash
11 6 (1.60%) T-SQL
11 6 (1.60%) VBA
12 5 (1.34%) PHP
13 4 (1.07%) MATLAB
13 4 (1.07%) TypeScript
14 2 (0.53%) Fortran
15 1 (0.27%) COBOL
15 1 (0.27%) PL/SQL
15 1 (0.27%) VBScript
Qualifications
1 68 (18.18%) Security Cleared
2 56 (14.97%) DV Cleared
3 54 (14.44%) AWS Certification
3 54 (14.44%) Degree
4 53 (14.17%) AWS Certified Developer
4 53 (14.17%) AWS Certified Solutions Architect
5 15 (4.01%) DBS Check
6 14 (3.74%) Computer Science Degree
6 14 (3.74%) Master's Degree
7 10 (2.67%) Microsoft Certification
8 8 (2.14%) Cisco Certification
8 8 (2.14%) MCSA
8 8 (2.14%) SC Cleared
9 7 (1.87%) MCP
9 7 (1.87%) MCSE
10 4 (1.07%) Numerate Degree
11 3 (0.80%) CCNA
12 2 (0.53%) ACCA
12 2 (0.53%) CCNP
12 2 (0.53%) CISSP
Quality Assurance & Compliance
1 11 (2.94%) Accessibility
1 11 (2.94%) ISO/IEC 27001
2 9 (2.41%) SLA
3 7 (1.87%) GDPR
3 7 (1.87%) ISO 9001
4 6 (1.60%) QA
4 6 (1.60%) Sarbanes-Oxley
5 5 (1.34%) Data Quality
6 3 (0.80%) IEC 61508
6 3 (0.80%) JTAG
7 2 (0.53%) 21 CFR Part 11
7 2 (0.53%) Cyber Essentials
7 2 (0.53%) Cyber Essentials PLUS
7 2 (0.53%) GMP
7 2 (0.53%) ISO 14001
8 1 (0.27%) Actionable Recommendations
8 1 (0.27%) COSO
8 1 (0.27%) ISO 15022
8 1 (0.27%) ISO 20022
System Software
1 21 (5.61%) Active Directory
2 13 (3.48%) Hyper-V
3 8 (2.14%) Firmware
3 8 (2.14%) VMware Infrastructure
4 4 (1.07%) Docker
4 4 (1.07%) Embedded Firmware
5 2 (0.53%) VMware ESXi
6 1 (0.27%) Veritas Cluster Server
6 1 (0.27%) Virtual Machines
6 1 (0.27%) Virtual Servers
6 1 (0.27%) vSphere
Systems Management
1 12 (3.21%) Terraform
2 11 (2.94%) Microsoft Intune
3 7 (1.87%) PaperCut
4 6 (1.60%) Kubernetes
5 5 (1.34%) Ansible
5 5 (1.34%) Single Sign-On
6 4 (1.07%) FortiGate
7 3 (0.80%) Functional Safety
7 3 (0.80%) SCCM
8 2 (0.53%) SCOM
8 2 (0.53%) SCOrch
8 2 (0.53%) SCSM
9 1 (0.27%) Nessus
9 1 (0.27%) WSUS
Vendors
1 63 (16.84%) Microsoft
2 25 (6.68%) Salesforce
3 19 (5.08%) Google
4 14 (3.74%) Oracle
5 11 (2.94%) Cisco
6 9 (2.41%) ServiceNow
7 8 (2.14%) IBM
7 8 (2.14%) VMware
8 5 (1.34%) Palo Alto
9 4 (1.07%) CheckPoint
9 4 (1.07%) HubSpot
9 4 (1.07%) Pure Storage
9 4 (1.07%) SolarWinds
10 3 (0.80%) Apple
10 3 (0.80%) Meraki
10 3 (0.80%) SAP
10 3 (0.80%) Zscaler
11 2 (0.53%) Concur
11 2 (0.53%) ConnectWise
11 2 (0.53%) Red Hat