Hybrid/Remote Microsoft 365 Job Trends

Microsoft 365 (M365, Office 365, O365)
UK > Work from Home

The table below provides summary statistics and salary benchmarking for remote or hybrid work requiring Microsoft 365 skills. It covers permanent job vacancies from the 6 months leading up to 2 November 2025, with comparisons to the same periods in the previous two years.

6 months to
2 Nov 2025
Same period 2024 Same period 2023
Rank 39 31 29
Rank change year-on-year -8 -2 +38
Permanent jobs citing Microsoft 365 987 1,439 1,773
As % of all permanent jobs with remote/hybrid work options 6.07% 7.22% 7.95%
As % of the Cloud Services category 17.20% 16.41% 16.54%
Number of salaries quoted 711 892 1,595
10th Percentile £27,500 £27,000 £28,000
25th Percentile £31,250 £32,750 £33,000
Median annual salary (50th Percentile) £43,000 £50,000 £47,557
Median % change year-on-year -14.00% +5.14% +5.68%
75th Percentile £61,250 £65,000 £67,500
90th Percentile £77,500 £74,925 £77,500
UK median annual salary £37,500 £45,000 £42,500
% change year-on-year -16.67% +5.88% -

All Cloud Skills
Work from Home

Microsoft 365 falls under the Cloud Services category. For comparison with the information above, the following table provides summary statistics for all permanent job vacancies with remote or hybrid options requiring cloud computing skills.

Permanent vacancies with a requirement for cloud computing skills 5,740 8,769 10,721
As % of all permanent jobs with a WFH option 35.32% 44.01% 48.10%
Number of salaries quoted 4,082 5,679 9,159
10th Percentile £31,250 £36,250 £37,470
25th Percentile £42,000 £47,500 £47,500
Median annual salary (50th Percentile) £60,000 £65,000 £65,000
Median % change year-on-year -7.69% - -
75th Percentile £82,241 £85,000 £82,500
90th Percentile £107,500 £112,500 £97,500
UK median annual salary £57,500 £65,000 £62,500
% change year-on-year -11.54% +4.00% -

Microsoft 365
Job Vacancy Trend for Remote/Hybrid Jobs

Historical trend showing the proportion of permanent IT job postings citing Microsoft 365 and offering remote or hybrid work options relative to all permanent IT jobs advertised.
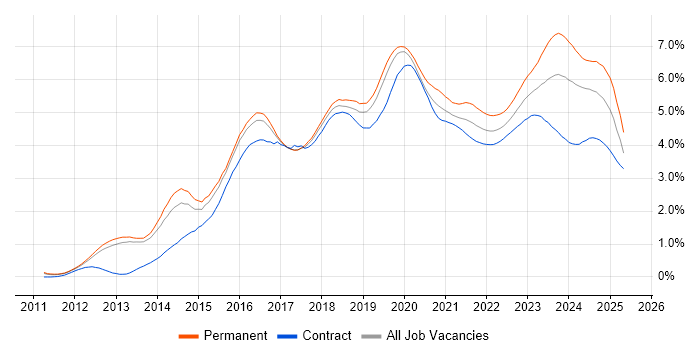
Microsoft 365 job vacancy trend for remote/hybrid jobs

Microsoft 365
Salary Trend for Remote/Hybrid Jobs

Salary distribution trend for jobs with remote/hybrid work options citing Microsoft 365.

Salary distribution trend for jobs with remote/hybrid work options citing Microsoft 365

Microsoft 365
Salary Histogram for Remote/Hybrid Jobs

Salary distribution for jobs with remote/hybrid work options citing Microsoft 365 over the 6 months to 2 November 2025.

Microsoft 365 salary histogram for jobs with remote/hybrid work options

Microsoft 365
Co-Occurring Skills & Capabilities in Remote/Hybrid Jobs by Category

The following tables expand on the one above by listing co-occurrences grouped by category. They cover the same employment type, locality and period, with up to 20 co-occurrences shown in each category:

Application Platforms
1 253 (25.63%) SharePoint
2 192 (19.45%) Microsoft Exchange
3 13 (1.32%) IIS
4 6 (0.61%) Anypoint
5 5 (0.51%) Moodle
6 4 (0.41%) Tomcat
6 4 (0.41%) WordPress
7 3 (0.30%) ArcGIS
7 3 (0.30%) Skype for Business
8 2 (0.20%) CMS
8 2 (0.20%) Confluence
9 1 (0.10%) Apache
9 1 (0.10%) Drupal
9 1 (0.10%) SharePoint Server
Applications
1 212 (21.48%) Microsoft Office
2 88 (8.92%) Microsoft Excel
3 31 (3.14%) Microsoft PowerPoint
4 13 (1.32%) InDesign
5 10 (1.01%) Spreadsheet
6 7 (0.71%) Adobe XD
7 5 (0.51%) Adobe Creative Suite
7 5 (0.51%) Microsoft Project
8 4 (0.41%) Adobe Illustrator
8 4 (0.41%) Photoshop
9 3 (0.30%) AutoCAD
9 3 (0.30%) MS Visio
10 2 (0.20%) EPLAN
11 1 (0.10%) Acrobat
11 1 (0.10%) Adobe Captivate
11 1 (0.10%) Adobe Premiere
11 1 (0.10%) Autodesk Inventor
11 1 (0.10%) Chatbot
11 1 (0.10%) SOLIDWORKS
Business Applications
1 19 (1.93%) Dynamics CRM
2 6 (0.61%) Shopify
3 4 (0.41%) Sage 1000
4 2 (0.20%) Dynamics GP
4 2 (0.20%) Dynamics NAV
4 2 (0.20%) Sage 200
5 1 (0.10%) Dynamics AX
5 1 (0.10%) Integrated Workplace Management System
5 1 (0.10%) NetSuite
5 1 (0.10%) Raiser’s Edge
5 1 (0.10%) Salesforce CRM
Cloud Services
1 448 (45.39%) Azure
2 207 (20.97%) Entra ID
3 142 (14.39%) AWS
4 137 (13.88%) Power Platform
5 92 (9.32%) Power Automate
6 84 (8.51%) PowerApps
7 62 (6.28%) OneDrive
8 49 (4.96%) Dynamics 365
9 43 (4.36%) Azure DevOps
10 41 (4.15%) Microsoft Copilot
11 37 (3.75%) SaaS
12 30 (3.04%) Microsoft Purview
13 23 (2.33%) IaaS
14 21 (2.13%) Azure Logic Apps
15 20 (2.03%) Copilot Studio
16 13 (1.32%) Azure Sentinel
16 13 (1.32%) Google Workspace
17 11 (1.11%) Azure Monitor
17 11 (1.11%) Mimecast
17 11 (1.11%) Workato
Communications & Networking
1 113 (11.45%) Firewall
2 94 (9.52%) DHCP
3 91 (9.22%) DNS
4 77 (7.80%) VPN
5 59 (5.98%) TCP/IP
6 54 (5.47%) WAN
7 42 (4.26%) LAN
8 29 (2.94%) VLAN
8 29 (2.94%) Wi-Fi
9 27 (2.74%) VoIP
10 17 (1.72%) SD-WAN
11 16 (1.62%) Unified Communications
11 16 (1.62%) Wireless
12 15 (1.52%) SSL
13 14 (1.42%) SAN
14 11 (1.11%) Network Security
15 10 (1.01%) IP Telephony
16 7 (0.71%) DMARC
16 7 (0.71%) Internet
16 7 (0.71%) Remote Desktop
Database & Business Intelligence
1 74 (7.50%) Power BI
2 34 (3.44%) SQL Server
3 10 (1.01%) Relational Database
4 7 (0.71%) SQL Server Reporting Services
5 6 (0.61%) Crystal Reports
5 6 (0.61%) Oracle Database
6 5 (0.51%) MySQL
6 5 (0.51%) Oracle Reports
6 5 (0.51%) PostgreSQL
6 5 (0.51%) SQL Server Integration Services
7 4 (0.41%) Data Lake
7 4 (0.41%) GIS
7 4 (0.41%) Metadata
8 3 (0.30%) Power Query
8 3 (0.30%) RDBMS
9 2 (0.20%) Azure SQL Database
9 2 (0.20%) Qlik Sense
9 2 (0.20%) QlikView
10 1 (0.10%) Apache Cassandra
10 1 (0.10%) MongoDB
Development Applications
1 7 (0.71%) JIRA
2 1 (0.10%) Fiddler
2 1 (0.10%) Git
2 1 (0.10%) GitLab
2 1 (0.10%) MSBuild
General
1 486 (49.24%) Social Skills
2 170 (17.22%) Finance
3 90 (9.12%) Swedish Language
4 86 (8.71%) French Language
5 83 (8.41%) Inclusion and Diversity
6 56 (5.67%) Law
7 54 (5.47%) Analytical Skills
8 50 (5.07%) Organisational Skills
9 45 (4.56%) Legal
10 41 (4.15%) Manufacturing
11 37 (3.75%) Public Sector
12 36 (3.65%) Marketing
13 28 (2.84%) Retail
14 27 (2.74%) Back Office
15 22 (2.23%) Telecoms
16 21 (2.13%) Presentation Skills
17 20 (2.03%) Documentation Skills
18 11 (1.11%) Automotive
19 8 (0.81%) Advertising
20 7 (0.71%) Digital Health
Job Titles
1 230 (23.30%) Analyst
2 180 (18.24%) IT Support
3 132 (13.37%) Service Analyst
4 130 (13.17%) Service Desk Analyst
5 95 (9.63%) Support Engineer
6 86 (8.71%) IT Engineer
7 79 (8.00%) Senior
8 67 (6.79%) IT Support Engineer
9 64 (6.48%) Support Technician
10 61 (6.18%) Lead
11 57 (5.78%) Support Analyst
12 56 (5.67%) IT Manager
13 54 (5.47%) 2nd Line Support
14 51 (5.17%) IT Analyst
15 43 (4.36%) Infrastructure Engineer
16 42 (4.26%) IT Technician
17 40 (4.05%) Developer
18 39 (3.95%) 1st Line Support
19 36 (3.65%) Consultant
20 35 (3.55%) IT Support Technician
Libraries, Frameworks & Software Standards
1 33 (3.34%) .NET
2 26 (2.63%) HTML5 Canvas
3 12 (1.22%) REST
4 11 (1.11%) React
5 10 (1.01%) JSON
5 10 (1.01%) Web Services
6 9 (0.91%) SOAP
7 8 (0.81%) Microsoft Graph
7 8 (0.81%) XML
8 7 (0.71%) HTML
9 6 (0.61%) CSS
10 5 (0.51%) ASP.NET
10 5 (0.51%) EDI
10 5 (0.51%) Middleware
10 5 (0.51%) SAML
11 4 (0.41%) RESTful
12 3 (0.30%) Software Packaging
13 2 (0.20%) .NET Framework
13 2 (0.20%) FHIR
13 2 (0.20%) ML.NET
Miscellaneous
1 85 (8.61%) Onboarding
2 84 (8.51%) Driving Licence
3 49 (4.96%) Self-Motivation
4 42 (4.26%) Product Ownership
5 35 (3.55%) Enterprise Software
6 22 (2.23%) Management Information System
6 22 (2.23%) Security Posture
6 22 (2.23%) Social Media
7 20 (2.03%) Cloud Native
8 18 (1.82%) Microsoft Licensing
9 14 (1.42%) CCTV
10 12 (1.22%) Data Centre
11 11 (1.11%) Client/Server
12 10 (1.01%) Web Conferencing
13 9 (0.91%) CMDB
14 8 (0.81%) AI Agents
15 7 (0.71%) Cyber Security Posture
15 7 (0.71%) Learning Management System
15 7 (0.71%) Low-Code
15 7 (0.71%) Video Conferencing
Operating Systems
1 413 (41.84%) Windows
2 176 (17.83%) Windows Server
3 117 (11.85%) Windows 10
4 42 (4.26%) Linux
5 40 (4.05%) Apple iOS
6 37 (3.75%) Mac OS
7 17 (1.72%) Windows Server 2019
8 14 (1.42%) Windows Server 2016
9 12 (1.22%) Android
9 12 (1.22%) Windows Server 2012
10 10 (1.01%) Unix
11 3 (0.30%) Windows Server 2008
12 2 (0.20%) CentOS
13 1 (0.10%) Debian
13 1 (0.10%) Red Hat Enterprise Linux
13 1 (0.10%) Ubuntu
13 1 (0.10%) VMS
Processes & Methodologies
1 314 (31.81%) ITIL
2 270 (27.36%) Customer Service
3 194 (19.66%) Problem-Solving
4 158 (16.01%) Continuous Improvement
5 135 (13.68%) ITSM
6 118 (11.96%) Cybersecurity
7 107 (10.84%) Roadmaps
8 94 (9.52%) Mentoring
9 89 (9.02%) Agile
10 88 (8.92%) Performance Metrics
11 84 (8.51%) User Experience
12 81 (8.21%) AI
13 78 (7.90%) Service Delivery
14 75 (7.60%) Business Intelligence
15 72 (7.29%) DevOps
16 71 (7.19%) Analytics
17 67 (6.79%) Coaching
17 67 (6.79%) Infrastructure Engineering
18 64 (6.48%) CRM
19 62 (6.28%) Technology Roadmap
Programming Languages
1 127 (12.87%) PowerShell
2 63 (6.38%) SQL
3 46 (4.66%) JavaScript
4 40 (4.05%) C#
5 39 (3.95%) Python
6 25 (2.53%) Bash
7 19 (1.93%) VBA
8 9 (0.91%) Java
9 8 (0.81%) Bicep
10 5 (0.51%) T-SQL
10 5 (0.51%) VB
11 4 (0.41%) Kusto Query Language
11 4 (0.41%) Shell Script
11 4 (0.41%) VB.NET
12 2 (0.20%) TypeScript
13 1 (0.10%) Data Analysis Expressions
13 1 (0.10%) PHP
13 1 (0.10%) Scala
Qualifications
1 262 (26.55%) Degree
2 165 (16.72%) Microsoft Certification
3 98 (9.93%) AWS Certification
3 98 (9.93%) MCSE
4 74 (7.50%) Security Cleared
5 67 (6.79%) SC Cleared
6 44 (4.46%) DBS Check
7 33 (3.34%) Azure Certification
7 33 (3.34%) Cisco Certification
8 27 (2.74%) ITIL Certification
9 23 (2.33%) CCNA
10 19 (1.93%) CISSP
10 19 (1.93%) Computer Science Degree
11 16 (1.62%) CTC Cleared
12 15 (1.52%) CCNP
13 14 (1.42%) A+ Certification
13 14 (1.42%) MCP
14 13 (1.32%) CISM
15 12 (1.22%) MCSA
16 10 (1.01%) BPSS Clearance
Quality Assurance & Compliance
1 90 (9.12%) QA
2 62 (6.28%) SLA
3 47 (4.76%) ISO/IEC 27001
4 46 (4.66%) GDPR
5 31 (3.14%) Cyber Essentials
6 25 (2.53%) NIST
7 16 (1.62%) Accessibility
8 15 (1.52%) Cyber Essentials PLUS
9 14 (1.42%) ISO 9001
10 5 (0.51%) NCSC
11 3 (0.30%) GRC
11 3 (0.30%) PMO
12 2 (0.20%) Data Quality
12 2 (0.20%) HL7
12 2 (0.20%) ISO 22301
12 2 (0.20%) Sarbanes-Oxley
12 2 (0.20%) SOC 2
13 1 (0.10%) COBIT
13 1 (0.10%) HIPAA
13 1 (0.10%) PCI DSS
System Software
1 374 (37.89%) Active Directory
2 83 (8.41%) Hyper-V
3 60 (6.08%) VMware Infrastructure
4 33 (3.34%) Virtual Desktop
5 13 (1.32%) Virtual Machines
6 7 (0.71%) vSphere
6 7 (0.71%) XenApp
7 6 (0.61%) Docker
7 6 (0.61%) Virtual Servers
7 6 (0.61%) VMware ESXi
8 5 (0.51%) Firmware
9 3 (0.30%) BitLocker
9 3 (0.30%) XenDesktop
10 2 (0.20%) Postfix
11 1 (0.10%) Dovecot
11 1 (0.10%) KVM
11 1 (0.10%) Xen
Systems Management
1 231 (23.40%) Microsoft Intune
2 50 (5.07%) SCCM
3 43 (4.36%) Terraform
4 18 (1.82%) Jamf Pro
5 14 (1.42%) Single Sign-On
6 13 (1.32%) Autotask
7 7 (0.71%) Kubernetes
8 6 (0.61%) Proxmox
8 6 (0.61%) SmoothWall
9 5 (0.51%) Active Directory Federation Services
9 5 (0.51%) FortiGate
10 4 (0.41%) Ansible
10 4 (0.41%) WSUS
11 3 (0.30%) Nessus
11 3 (0.30%) PaperCut
12 2 (0.20%) Functional Safety
12 2 (0.20%) Puppet
13 1 (0.10%) CFEngine
13 1 (0.10%) Cisco CUCM
13 1 (0.10%) Progress Chef
Vendors
1 808 (81.86%) Microsoft
2 104 (10.54%) ServiceNow
3 94 (9.52%) VMware
4 85 (8.61%) Cisco
5 38 (3.85%) Meraki
6 28 (2.84%) Citrix
7 27 (2.74%) Adobe
8 26 (2.63%) Apple
9 23 (2.33%) Veeam
10 21 (2.13%) HP
11 20 (2.03%) Oracle
12 19 (1.93%) Google
13 18 (1.82%) Datto
14 17 (1.72%) Dell
15 15 (1.52%) Sage
16 12 (1.22%) Sophos
17 11 (1.11%) SAP
18 10 (1.01%) Mitel
18 10 (1.01%) Salesforce
18 10 (1.01%) SonicWALL