Google Analytics Jobs with Hybrid/Remote/WFH Options

Google Analytics (GA)
UK > Work from Home

The table below provides summary statistics for permanent remote or hybrid work requiring Google Analytics skills. It includes a benchmarking guide to the annual salaries offered in vacancies that cited Google Analytics over the 6 months leading up to 4 May 2025, comparing them to the same period in the previous two years.

6 months to
4 May 2025
Same period 2024 Same period 2023
Rank 275 414 401
Rank change year-on-year +139 -13 +42
Permanent jobs citing Google Analytics 147 175 300
As % of all permanent jobs with a WFH option 0.96% 0.52% 0.71%
As % of the Cloud Services category 2.46% 1.20% 1.48%
Number of salaries quoted 67 165 169
10th Percentile £31,150 £26,850 £32,500
25th Percentile £33,875 £31,250 £37,500
Median annual salary (50th Percentile) £45,000 £42,500 £45,000
Median % change year-on-year +5.88% -5.56% -5.26%
75th Percentile £56,875 £57,500 £61,250
90th Percentile £84,011 £67,500 £75,000
UK median annual salary £45,000 £42,500 £45,000
% change year-on-year +5.88% -5.56% -0.68%

All Cloud Skills
Work from Home

Google Analytics falls under the Cloud Services category. For comparison with the information above, the following table provides summary statistics for all permanent job vacancies with remote or hybrid options requiring cloud computing skills.

Permanent vacancies with a requirement for cloud computing skills 5,983 14,643 20,250
As % of all permanent jobs with a WFH option 39.05% 43.28% 47.63%
Number of salaries quoted 4,636 11,983 14,847
10th Percentile £32,500 £35,662 £37,999
25th Percentile £46,250 £45,000 £48,750
Median annual salary (50th Percentile) £62,500 £60,000 £65,000
Median % change year-on-year +4.17% -7.69% +1.28%
75th Percentile £83,750 £78,750 £85,000
90th Percentile £109,375 £97,500 £102,500
UK median annual salary £61,000 £57,500 £65,000
% change year-on-year +6.09% -11.54% +4.00%

Google Analytics
Trend for Jobs with a WFH Option

Job vacancies with remote working options citing Google Analytics as a proportion of all IT jobs advertised.
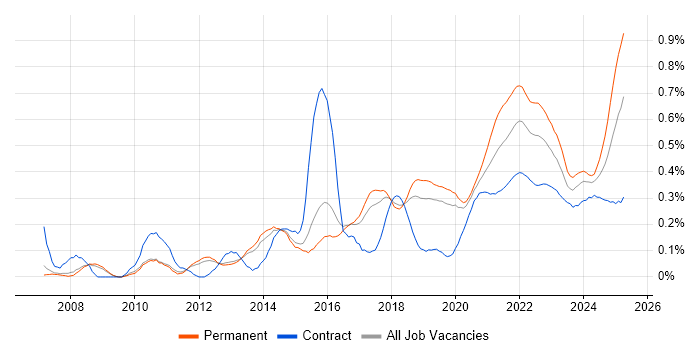
Google Analytics trend for jobs with Hybrid/Remote/WFH options

Google Analytics
Salary Trend for Jobs with a WFH Option

3-month moving average salary quoted in job vacancies with remote working options citing Google Analytics.

Google Analytics salary trend for jobs with a WFH option

Google Analytics
Salary Histogram for Jobs with a WFH Option

Salary distribution for jobs with remote working options citing Google Analytics over the 6 months to 4 May 2025.

Google Analytics salary histogram for jobs with a WFH option

Google Analytics
Co-occurring Skills and Capabilities with WFH Options by Category

The follow tables expand on the table above by listing co-occurrences grouped by category. The same employment type, locality and period is covered with up to 20 co-occurrences shown in each of the following categories:

Application Platforms
1 44 (29.93%) CMS
2 26 (17.69%) WordPress
3 9 (6.12%) Drupal
4 7 (4.76%) Sitecore CMS
4 7 (4.76%) Umbraco
5 4 (2.72%) Confluence
6 3 (2.04%) IBM Domino
7 1 (0.68%) Ethereum
Applications
1 24 (16.33%) Microsoft Excel
2 12 (8.16%) Photoshop
3 10 (6.80%) Microsoft PowerPoint
4 7 (4.76%) Microsoft Office
5 4 (2.72%) Adobe Premiere
5 4 (2.72%) Trello
6 3 (2.04%) Adobe XD
7 2 (1.36%) Notion
7 2 (1.36%) Sketch
Business Applications
1 18 (12.24%) Shopify
2 5 (3.40%) Dynamics CRM
3 4 (2.72%) Salesforce CRM
4 1 (0.68%) Raiser’s Edge
Cloud Services
1 43 (29.25%) Google Ads
2 28 (19.05%) Google Tag Manager
3 17 (11.56%) Canva
4 15 (10.20%) Power Platform
5 12 (8.16%) Google Data Studio
6 11 (7.48%) Microsoft Advertising
7 10 (6.80%) GCP
8 9 (6.12%) Google Sheets
9 8 (5.44%) Azure
10 6 (4.08%) Snowflake
11 5 (3.40%) Facebook Ads
12 4 (2.72%) Adobe Analytics
12 4 (2.72%) Azure Cosmos DB
12 4 (2.72%) Fivetran
12 4 (2.72%) GitHub
12 4 (2.72%) PaaS
12 4 (2.72%) Power Automate
12 4 (2.72%) Zapier
13 3 (2.04%) AWS
13 3 (2.04%) Figma
Communications & Networking
1 5 (3.40%) Internet
2 2 (1.36%) Intranet
3 1 (0.68%) Wi-Fi
Database & Business Intelligence
1 15 (10.20%) Power BI
2 7 (4.76%) Data Warehouse
3 5 (3.40%) Looker
3 5 (3.40%) Power Query
3 5 (3.40%) Tableau
4 4 (2.72%) Azure SQL Database
5 2 (1.36%) MySQL
6 1 (0.68%) Amazon Redshift
6 1 (0.68%) BigQuery
6 1 (0.68%) SQL Server
Development Applications
1 5 (3.40%) Jenkins
2 4 (2.72%) Bazaar
2 4 (2.72%) JIRA
2 4 (2.72%) Visual Studio
2 4 (2.72%) webpack
3 1 (0.68%) Axure RP
3 1 (0.68%) Balsamiq
3 1 (0.68%) CircleCI
3 1 (0.68%) Crashlytics
3 1 (0.68%) fastlane
3 1 (0.68%) Git
3 1 (0.68%) SQL Server Management Studio (SSMS)
3 1 (0.68%) Travis CI
General
1 101 (68.71%) Marketing
2 54 (36.73%) Social Skills
3 47 (31.97%) Analytical Skills
4 34 (23.13%) Advertising
5 29 (19.73%) Retail
6 15 (10.20%) Publishing
7 13 (8.84%) Finance
8 11 (7.48%) Police
8 11 (7.48%) Public Sector
9 10 (6.80%) Presentation Skills
10 8 (5.44%) Banking
10 8 (5.44%) Brand Awareness
10 8 (5.44%) Organisational Skills
11 7 (4.76%) Inclusion and Diversity
12 5 (3.40%) Games
12 5 (3.40%) Legal
13 4 (2.72%) French Language
14 3 (2.04%) Dutch Language
14 3 (2.04%) Local Government
14 3 (2.04%) Pharmaceutical
Job Titles
1 17 (11.56%) PPC Executive
2 14 (9.52%) Analyst
2 14 (9.52%) Lead
3 10 (6.80%) Senior
4 8 (5.44%) Digital Executive
5 7 (4.76%) Performance Analyst
5 7 (4.76%) SEO Executive
6 6 (4.08%) Coordinator
6 6 (4.08%) Marketing Executive
6 6 (4.08%) Product Owner
6 6 (4.08%) SEO Manager
7 5 (3.40%) Marketing Manager
8 4 (2.72%) Data Manager
8 4 (2.72%) E-Commerce Manager
8 4 (2.72%) Front-End Engineer (Client-Side Engineer)
8 4 (2.72%) Senior Front-End Engineer (Client-Side Engineer)
8 4 (2.72%) Senior Software Engineer
8 4 (2.72%) Software Engineer
8 4 (2.72%) Systems Manager
9 3 (2.04%) Paid Search Manager
Libraries, Frameworks & Software Standards
1 24 (16.33%) HTML
2 18 (12.24%) CSS
3 5 (3.40%) React
4 4 (2.72%) Enzyme
4 4 (2.72%) Jest
4 4 (2.72%) JSON
4 4 (2.72%) Redux
5 1 (0.68%) CSS3
5 1 (0.68%) HTML5
5 1 (0.68%) jQuery
5 1 (0.68%) Kafka
5 1 (0.68%) ReactiveCocoa
5 1 (0.68%) RxJava
5 1 (0.68%) RxSwift
5 1 (0.68%) web3js
Miscellaneous
1 49 (33.33%) Social Media
2 28 (19.05%) Blog
3 12 (8.16%) Product Ownership
4 10 (6.80%) Analytical Mindset
5 8 (5.44%) Algorithms
5 8 (5.44%) Management Information System
6 7 (4.76%) Marketing Technology
7 5 (3.40%) Self-Motivation
8 4 (2.72%) Public Cloud
9 3 (2.04%) Online Games
10 2 (1.36%) Digital Media
10 2 (1.36%) Graphic Design
10 2 (1.36%) Mobile App
10 2 (1.36%) Podcast
10 2 (1.36%) Video Editing
11 1 (0.68%) Blockchain
11 1 (0.68%) Legacy Applications
11 1 (0.68%) NHS
11 1 (0.68%) Web3
Operating Systems
1 1 (0.68%) Android
1 1 (0.68%) Apple iOS
Processes & Methodologies
1 147 (100.00%) Analytics
2 61 (41.50%) Digital Marketing
3 59 (40.14%) SEO
4 47 (31.97%) Pay per click
5 32 (21.77%) Marketing Strategy
6 29 (19.73%) Agile
7 26 (17.69%) Actionable Insight
7 26 (17.69%) Problem-Solving
8 25 (17.01%) Paid Search
8 25 (17.01%) User Experience
9 21 (14.29%) Time Management
10 20 (13.61%) CRM
11 19 (12.93%) Data Analysis
11 19 (12.93%) E-Commerce
12 18 (12.24%) Data Privacy
12 18 (12.24%) Visualisation
13 16 (10.88%) Commercial Awareness
14 15 (10.20%) Budget Management
14 15 (10.20%) Link Building
14 15 (10.20%) Performance Analysis
Programming Languages
1 17 (11.56%) SQL
2 12 (8.16%) JavaScript
3 4 (2.72%) T-SQL
4 3 (2.04%) PHP
5 2 (1.36%) Data Analysis Expressions
6 1 (0.68%) Kotlin
6 1 (0.68%) Python
6 1 (0.68%) Swift
Qualifications
1 18 (12.24%) DBS Check
2 14 (9.52%) Degree
3 4 (2.72%) BPSS Clearance
4 1 (0.68%) Microsoft Certification
Quality Assurance & Compliance
1 13 (8.84%) Accessibility
2 6 (4.08%) Data Quality
2 6 (4.08%) GDPR
3 4 (2.72%) Cyber Essentials
4 3 (2.04%) Actionable Recommendations
4 3 (2.04%) WCAG
5 1 (0.68%) QA
System Software
1 1 (0.68%) Docker
Systems Management
1 4 (2.72%) Kubernetes
2 1 (0.68%) Matomo
Vendors
1 147 (100.00%) Google
2 56 (38.10%) Microsoft
3 18 (12.24%) Ahrefs
4 17 (11.56%) Facebook
4 17 (11.56%) Pinterest
5 16 (10.88%) Salesforce
6 15 (10.20%) TikTok
7 13 (8.84%) Instagram
8 10 (6.80%) Screaming Frog
9 7 (4.76%) Adobe
9 7 (4.76%) Hotjar
9 7 (4.76%) Sitecore
9 7 (4.76%) YouTube
10 4 (2.72%) Hootsuite
10 4 (2.72%) Tealium
10 4 (2.72%) Xero
11 3 (2.04%) Twitter
11 3 (2.04%) WooCommerce
12 2 (1.36%) Spotify
13 1 (0.68%) OneTrust