Data Loss Prevention Contracts in London

Data Loss Prevention (DLP)
England > London

The table below provides summary statistics for contract job vacancies advertised in London requiring Data Loss Prevention skills. It includes a benchmarking guide to the contractor rates offered in vacancies that cited Data Loss Prevention over the 6 months leading up to 1 May 2025, comparing them to the same period in the previous two years.

6 months to
1 May 2025
Same period 2024 Same period 2023
Rank 264 260 345
Rank change year-on-year -4 +85 +67
Contract jobs citing Data Loss Prevention 89 132 152
As % of all contract jobs advertised in London 0.71% 0.74% 0.56%
As % of the Processes & Methodologies category 0.77% 0.84% 0.62%
Number of daily rates quoted 42 85 114
10th Percentile £425 £475 £488
25th Percentile £550 £558 £520
Median daily rate (50th Percentile) £650 £635 £610
Median % change year-on-year +2.36% +4.10% +8.35%
75th Percentile £756 £775 £746
90th Percentile £800 £835 £802
England median daily rate £600 £600 £570
% change year-on-year - +5.26% +8.57%
Number of hourly rates quoted 0 0 1
10th Percentile - - -
25th Percentile - - £91.25
Median hourly rate - - £97.50
75th Percentile - - £103.75
90th Percentile - - -
England median hourly rate - - £70.00

All Process and Methodology Skills
London

Data Loss Prevention falls under the Processes and Methodologies category. For comparison with the information above, the following table provides summary statistics for all contract job vacancies requiring process or methodology skills in London.

Contract vacancies with a requirement for process or methodology skills 11,564 15,790 24,631
As % of all contract IT jobs advertised in London 92.16% 88.55% 91.11%
Number of daily rates quoted 7,847 11,316 17,711
10th Percentile £350 £338 £375
25th Percentile £440 £450 £475
Median daily rate (50th Percentile) £550 £550 £590
Median % change year-on-year - -6.78% +2.61%
75th Percentile £688 £675 £700
90th Percentile £813 £800 £800
England median daily rate £525 £525 £550
% change year-on-year - -4.55% +2.33%
Number of hourly rates quoted 166 324 278
10th Percentile £16.17 £16.00 £18.59
25th Percentile £22.68 £20.00 £22.53
Median hourly rate £31.67 £29.50 £38.13
Median % change year-on-year +7.36% -22.62% +5.90%
75th Percentile £50.75 £47.56 £62.64
90th Percentile £63.75 £65.93 £76.78
England median hourly rate £29.07 £36.00 £37.50
% change year-on-year -19.25% -4.00% +53.06%

Data Loss Prevention
Job Vacancy Trend in London

Job postings citing Data Loss Prevention as a proportion of all IT jobs advertised in London.
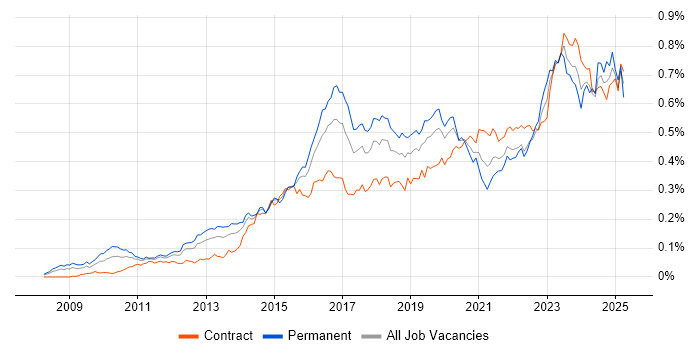
Job vacancy trend for Data Loss Prevention in London

Data Loss Prevention
Contractor Daily Rate Trend in London

3-month moving average daily rate quoted in jobs citing Data Loss Prevention in London.

Daily rate trend for Data Loss Prevention in London

Data Loss Prevention
Daily Rate Histogram in London

Daily rate distribution for jobs citing Data Loss Prevention in London over the 6 months to 1 May 2025.

Daily rate histogram for Data Loss Prevention in London

Data Loss Prevention
Contractor Hourly Rate Trend in London

3-month moving average hourly rates quoted in jobs citing Data Loss Prevention in London.

Hourly rate trend for Data Loss Prevention in London

Data Loss Prevention
Contract Job Locations in London

The table below looks at the demand and provides a guide to the median contractor rates quoted in IT jobs citing Data Loss Prevention within the London region over the 6 months to 1 May 2025. The 'Rank Change' column provides an indication of the change in demand within each location based on the same 6 month period last year.

Location Rank Change
on Same Period
Last Year
Matching
Contract
IT Job Ads
Median
Daily Rate
Past 6 Months
Median Daily Rate
% Change
on Same Period
Last Year
Live
Jobs
Central London -17 22 £600 +1.69% 17
South London - 2 £450 -
Data Loss Prevention
England

Data Loss Prevention
Co-occurring Skills and Capabilities in London by Category

The follow tables expand on the table above by listing co-occurrences grouped by category. The same employment type, locality and period is covered with up to 20 co-occurrences shown in each of the following categories:

Application Platforms
1 19 (21.35%) Microsoft Exchange
2 7 (7.87%) SharePoint
Cloud Services
1 37 (41.57%) Azure
2 29 (32.58%) Microsoft 365
3 27 (30.34%) Microsoft Purview
4 24 (26.97%) Entra ID
5 16 (17.98%) IaaS
6 8 (8.99%) AWS
7 7 (7.87%) Azure Sentinel
8 6 (6.74%) Microsoft Copilot
8 6 (6.74%) Serverless
9 5 (5.62%) OneDrive
10 4 (4.49%) Azure Functions
10 4 (4.49%) Azure Logic Apps
10 4 (4.49%) GCP
10 4 (4.49%) SaaS
11 3 (3.37%) Mimecast
11 3 (3.37%) Power Automate
12 2 (2.25%) Amazon CloudWatch
12 2 (2.25%) Amazon Macie
12 2 (2.25%) AWS CloudTrail
12 2 (2.25%) Cloud Computing
Communications & Networking
1 23 (25.84%) Firewall
2 14 (15.73%) DNS
3 13 (14.61%) MPLS
4 10 (11.24%) Network Security
5 4 (4.49%) VPN
6 3 (3.37%) SAN
7 2 (2.25%) TCP/IP
7 2 (2.25%) VoIP
8 1 (1.12%) DHCP
8 1 (1.12%) Intrusion Detection
8 1 (1.12%) NAS
8 1 (1.12%) SD-WAN
8 1 (1.12%) WAN
Database & Business Intelligence
1 1 (1.12%) Amazon RDS
Development Applications
1 1 (1.12%) JIRA
General
1 37 (41.57%) Finance
2 13 (14.61%) Banking
3 12 (13.48%) Social Skills
4 5 (5.62%) Analytical Skills
4 5 (5.62%) Legal
4 5 (5.62%) Spanish Language
5 4 (4.49%) Financial Institution
6 3 (3.37%) Inclusion and Diversity
7 2 (2.25%) Billing
7 2 (2.25%) French Language
7 2 (2.25%) Manufacturing
8 1 (1.12%) Documentation Skills
8 1 (1.12%) Law
8 1 (1.12%) Retail
Job Titles
1 21 (23.60%) Architect
2 15 (16.85%) Security Architect
3 14 (15.73%) Lead
4 10 (11.24%) Consultant
5 9 (10.11%) Integration Engineer
5 9 (10.11%) Senior
6 8 (8.99%) Infrastructure Engineer
6 8 (8.99%) Senior Architect
7 7 (7.87%) IT Engineer
7 7 (7.87%) Security Engineer
7 7 (7.87%) Senior Security Architect
8 6 (6.74%) Azure Engineer
8 6 (6.74%) Security Manager
9 5 (5.62%) Analyst
10 4 (4.49%) IT Architect
10 4 (4.49%) IT Security Architect
10 4 (4.49%) IT Security Engineer
10 4 (4.49%) Microsoft 365 Architect
10 4 (4.49%) Operations Manager
10 4 (4.49%) Security Analyst
Libraries, Frameworks & Software Standards
1 4 (4.49%) Microsoft Graph
2 2 (2.25%) OAuth
3 1 (1.12%) Kafka
3 1 (1.12%) LDAP
3 1 (1.12%) OpenID
3 1 (1.12%) SAML
Miscellaneous
1 12 (13.48%) Security Posture
2 10 (11.24%) Insider Threat
2 10 (11.24%) Management Information System
3 4 (4.49%) PKI
4 3 (3.37%) Cloud Native
4 3 (3.37%) Onboarding
4 3 (3.37%) Self-Motivation
5 2 (2.25%) Cyber Defence
5 2 (2.25%) Low-Code
6 1 (1.12%) Analytical Mindset
6 1 (1.12%) Cloud Security Posture
6 1 (1.12%) Cyber Threat
6 1 (1.12%) Replication
Operating Systems
1 24 (26.97%) Windows
2 20 (22.47%) Windows Server
3 5 (5.62%) Linux
4 1 (1.12%) Red Hat Enterprise Linux
4 1 (1.12%) Unix
4 1 (1.12%) Windows Server 2019
Processes & Methodologies
1 32 (35.96%) Cybersecurity
2 21 (23.60%) SIEM
2 21 (23.60%) Vulnerability Management
3 20 (22.47%) Cloud Security
4 17 (19.10%) Data Protection
4 17 (19.10%) Information Security
5 15 (16.85%) Infrastructure Engineering
6 14 (15.73%) Time Management
7 13 (14.61%) Project Delivery
7 13 (14.61%) Risk Management
8 12 (13.48%) Identity Access Management
8 12 (13.48%) Security Architecture
9 11 (12.36%) Security Operations
10 10 (11.24%) Incident Response
10 10 (11.24%) Penetration Testing
10 10 (11.24%) UEBA
11 9 (10.11%) Data Privacy
11 9 (10.11%) Threat and Vulnerability Management
12 8 (8.99%) Privileged Access Management
12 8 (8.99%) TOGAF
Programming Languages
1 8 (8.99%) PowerShell
2 1 (1.12%) Bash
2 1 (1.12%) Kusto Query Language
2 1 (1.12%) Python
2 1 (1.12%) Shell Script
Qualifications
1 26 (29.21%) CISSP
2 15 (16.85%) CISM
3 11 (12.36%) Microsoft Certification
4 8 (8.99%) Degree
5 7 (7.87%) (ISC)2 CCSP
5 7 (7.87%) Cisco Certification
6 6 (6.74%) CCSP
6 6 (6.74%) GCIH
7 5 (5.62%) SC Cleared
7 5 (5.62%) Security Cleared
8 4 (4.49%) Azure Certification
9 2 (2.25%) AWS Certification
9 2 (2.25%) AWS Certified DevOps Engineer
9 2 (2.25%) AWS Certified Solutions Architect
9 2 (2.25%) AWS Certified SysOps Administrator
9 2 (2.25%) CEH
9 2 (2.25%) CISA
9 2 (2.25%) CRISC
9 2 (2.25%) SANS
9 2 (2.25%) TOGAF Certification
Quality Assurance & Compliance
1 15 (16.85%) GDPR
1 15 (16.85%) ISO/IEC 27001
2 14 (15.73%) NIST
3 11 (12.36%) California Consumer Privacy Act
4 10 (11.24%) HIPAA
4 10 (11.24%) SOC 2
5 8 (8.99%) SLA
6 2 (2.25%) Cyber Essentials
6 2 (2.25%) NCSC
7 1 (1.12%) Cyber Essentials PLUS
7 1 (1.12%) ISO/IEC 27002 (supersedes ISO/IEC 17799)
7 1 (1.12%) NIST 800
7 1 (1.12%) PCI DSS
7 1 (1.12%) PMO
System Software
1 26 (29.21%) Active Directory
2 1 (1.12%) Docker
2 1 (1.12%) Hyper-V
2 1 (1.12%) Virtual Machines
2 1 (1.12%) VMware Infrastructure
Systems Management
1 15 (16.85%) Microsoft Intune
2 13 (14.61%) CASB
3 4 (4.49%) Kubernetes
4 3 (3.37%) Terraform
5 1 (1.12%) QRadar
Vendors
1 59 (66.29%) Microsoft
2 6 (6.74%) Zscaler
3 4 (4.49%) Cisco
4 3 (3.37%) Google
4 3 (3.37%) Palo Alto
5 2 (2.25%) Forcepoint
6 1 (1.12%) Confluent
6 1 (1.12%) Dell
6 1 (1.12%) EMC
6 1 (1.12%) Facebook
6 1 (1.12%) Instagram
6 1 (1.12%) McAfee
6 1 (1.12%) Red Hat
6 1 (1.12%) SonicWALL
6 1 (1.12%) Splunk
6 1 (1.12%) VMware