Windows Server Contract Job Trends in London

Microsoft Windows Server
England > London

The table below provides summary statistics and contractor rates for jobs advertised in London requiring Windows Server skills. It covers contract job vacancies from the 6 months leading up to 16 October 2025, with comparisons to the same periods in the previous two years.

6 months to
16 Oct 2025
Same period 2024 Same period 2023
Rank 232 179 117
Rank change year-on-year -53 -62 +65
Contract jobs citing Windows Server 141 233 454
As % of all contract jobs in London 1.05% 1.45% 2.19%
As % of the Operating Systems category 9.11% 11.53% 14.82%
Number of daily rates quoted 100 158 337
10th Percentile £324 £248 £294
25th Percentile £406 £358 £400
Median daily rate (50th Percentile) £500 £450 £525
Median % change year-on-year +11.11% -14.29% +10.53%
75th Percentile £591 £560 £650
90th Percentile £739 £638 £810
England median daily rate £500 £470 £475
% change year-on-year +6.38% -1.05% +5.56%
Number of hourly rates quoted 2 3 2
10th Percentile £23.70 £102.40 £21.40
25th Percentile £24.75 £106.00 £21.63
Median hourly rate £26.50 £112.00 £23.00
Median % change year-on-year -76.34% +386.96% +12.20%
75th Percentile £28.25 - £24.13
90th Percentile £29.30 - £24.20
England median hourly rate £16.00 £69.38 £54.56
% change year-on-year -76.94% +27.15% +111.88%

All Operating Systems
London

Windows Server falls under the Operating Systems category. For comparison with the information above, the following table provides summary statistics for all contract job vacancies requiring operating system skills in London.

Contract vacancies with a requirement for operating system skills 1,547 2,020 3,064
As % of all contract IT jobs advertised in London 11.56% 12.58% 14.77%
Number of daily rates quoted 997 1,319 2,195
10th Percentile £213 £225 £208
25th Percentile £359 £350 £400
Median daily rate (50th Percentile) £500 £500 £525
Median % change year-on-year - -4.76% -4.55%
75th Percentile £613 £605 £650
90th Percentile £738 £725 £750
England median daily rate £450 £475 £500
% change year-on-year -5.26% -5.00% -
Number of hourly rates quoted 55 27 53
10th Percentile £18.87 £19.91 £18.19
25th Percentile £22.50 £23.46 £22.75
Median hourly rate £25.15 £27.00 £43.84
Median % change year-on-year -6.85% -38.41% +82.67%
75th Percentile £25.20 £62.97 £64.50
90th Percentile £58.90 £88.71 £84.45
England median hourly rate £24.00 £60.72 £48.40
% change year-on-year -60.47% +25.44% +93.60%

Windows Server
Job Vacancy Trend in London

Historical trend showing the proportion of contract IT job postings citing Windows Server relative to all contract IT jobs advertised in London.
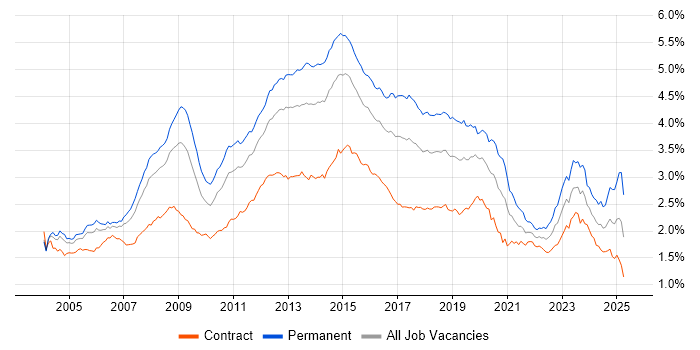
Windows Server job vacancy trend in London

Windows Server
Daily Rate Trend in London

Contractor daily rate distribution trend for jobs in London citing Windows Server.

Contractor daily rate distribution trend for jobs in London citing Windows Server

Windows Server
Daily Rate Histogram in London

Daily rate distribution for jobs citing Windows Server in London over the 6 months to 16 October 2025.

Daily rate histogram for Windows Server in London

Windows Server
Hourly Rate Trend in London

Contractor hourly rate distribution trend for jobs in London citing Windows Server.

Contractor hourly rate distribution trend for jobs in London citing Windows Server

Windows Server
Contract Job Locations in London

The table below looks at the demand and provides a guide to the median contractor rates quoted in IT jobs citing Windows Server within the London region over the 6 months to 16 October 2025. The 'Rank Change' column provides an indication of the change in demand within each location based on the same 6 month period last year.

Location Rank Change
on Same Period
Last Year
Matching
Contract
IT Job Ads
Median
Daily Rate
Past 6 Months
Median Daily Rate
% Change
on Same Period
Last Year
Live
Jobs
Central London -8 22 £500 +11.11% 20
West London +3 8 £500 +25.00% 6
South London -4 2 - - 7
East London 0 1 £200 -20.79% 2
Windows Server
England

Windows Server
Co-Occurring Skills & Capabilities in London by Category

The following tables expand on the one above by listing co-occurrences grouped by category. They cover the same employment type, locality and period, with up to 20 co-occurrences shown in each category:

Application Platforms
1 21 (14.89%) Microsoft Exchange
2 11 (7.80%) SharePoint
3 3 (2.13%) HCL Notes
3 3 (2.13%) SAS
4 2 (1.42%) Confluence
5 1 (0.71%) Apache
5 1 (0.71%) IIS
5 1 (0.71%) MQSeries
5 1 (0.71%) SharePoint 2010
5 1 (0.71%) Tomcat
5 1 (0.71%) WebSphere
Applications
1 1 (0.71%) InfoPath
1 1 (0.71%) MS Visio
1 1 (0.71%) OmniGraffle
Business Applications
1 3 (2.13%) Remedy ITSM
2 1 (0.71%) SAP S/4HANA
Cloud Services
1 71 (50.35%) Azure
2 40 (28.37%) Microsoft 365
3 32 (22.70%) Entra ID
4 17 (12.06%) AWS
5 15 (10.64%) IaaS
6 8 (5.67%) GitHub
6 8 (5.67%) SaaS
7 7 (4.96%) Power Platform
8 6 (4.26%) PaaS
9 5 (3.55%) Power Automate
10 4 (2.84%) Amazon S3
10 4 (2.84%) Azure Monitor
10 4 (2.84%) Azure Sentinel
10 4 (2.84%) GCP
10 4 (2.84%) PowerApps
10 4 (2.84%) Virtual Private Cloud
11 3 (2.13%) Amazon EC2
11 3 (2.13%) Azure DevOps
11 3 (2.13%) Cloud Computing
11 3 (2.13%) Serverless
Communications & Networking
1 32 (22.70%) Firewall
2 29 (20.57%) DNS
3 21 (14.89%) DHCP
4 13 (9.22%) VPN
5 9 (6.38%) WAN
6 8 (5.67%) Network Security
6 8 (5.67%) Wi-Fi
7 5 (3.55%) TCP/IP
8 4 (2.84%) SAN
8 4 (2.84%) VLAN
9 3 (2.13%) Internet
9 3 (2.13%) LAN
9 3 (2.13%) SSH
9 3 (2.13%) Wireless
10 2 (1.42%) HTTP
10 2 (1.42%) MPLS
10 2 (1.42%) NAS
10 2 (1.42%) SMTP
10 2 (1.42%) Softphone
10 2 (1.42%) SSL
Database & Business Intelligence
1 18 (12.77%) SQL Server
2 5 (3.55%) Power BI
3 4 (2.84%) Elasticsearch
4 3 (2.13%) Hadoop
4 3 (2.13%) Oracle Database
5 2 (1.42%) Apache Hive
5 2 (1.42%) Big Data
5 2 (1.42%) Impala
5 2 (1.42%) NoSQL
6 1 (0.71%) Amazon RDS
6 1 (0.71%) Azure SQL Database
6 1 (0.71%) Data Lake
6 1 (0.71%) MongoDB
6 1 (0.71%) PostgreSQL
6 1 (0.71%) Redis
6 1 (0.71%) SAP HANA
Development Applications
1 6 (4.26%) GitLab
1 6 (4.26%) Jenkins
2 4 (2.84%) Git
3 3 (2.13%) Bitbucket
3 3 (2.13%) JIRA
3 3 (2.13%) SonarQube
4 2 (1.42%) TeamCity
4 2 (1.42%) Visual Studio
5 1 (0.71%) Fiddler
5 1 (0.71%) Sonatype Nexus
5 1 (0.71%) Team Foundation Server
General
1 27 (19.15%) Finance
2 17 (12.06%) Social Skills
3 12 (8.51%) Analytical Skills
3 12 (8.51%) Banking
3 12 (8.51%) Inclusion and Diversity
4 9 (6.38%) Public Sector
5 7 (4.96%) Documentation Skills
6 5 (3.55%) Front Office
6 5 (3.55%) Local Government
7 4 (2.84%) Organisational Skills
7 4 (2.84%) Spanish Language
8 3 (2.13%) Japanese Language
9 2 (1.42%) Retail
9 2 (1.42%) Telecoms
10 1 (0.71%) Back Office
10 1 (0.71%) Financial Institution
10 1 (0.71%) International Banking
10 1 (0.71%) Investment Banking
10 1 (0.71%) Law
10 1 (0.71%) Legal
Job Titles
1 38 (26.95%) Infrastructure Engineer
2 17 (12.06%) Architect
3 15 (10.64%) Senior
4 9 (6.38%) Security Engineer
4 9 (6.38%) Windows Engineer
4 9 (6.38%) Wintel Engineer
5 8 (5.67%) Infrastructure Security Engineer
5 8 (5.67%) Support Engineer
6 7 (4.96%) Azure Engineer
6 7 (4.96%) Platform Engineer
6 7 (4.96%) Security Architect
7 6 (4.26%) Applications Engineer
7 6 (4.26%) Developer
7 6 (4.26%) Infrastructure Manager
7 6 (4.26%) Infrastructure Project Manager
7 6 (4.26%) IT Engineer
7 6 (4.26%) Project Manager
7 6 (4.26%) Server Engineer
8 5 (3.55%) Administrator
8 5 (3.55%) Technical Architect
Libraries, Frameworks & Software Standards
1 5 (3.55%) .NET
2 4 (2.84%) YAML
3 3 (2.13%) CSS
3 3 (2.13%) FIX Protocol
3 3 (2.13%) HTML
3 3 (2.13%) HTML5 Canvas
3 3 (2.13%) Middleware
4 2 (1.42%) ASP.NET
4 2 (1.42%) jQuery
4 2 (1.42%) RabbitMQ
4 2 (1.42%) REST
4 2 (1.42%) SPFx
4 2 (1.42%) Swing
5 1 (0.71%) Apache NiFi
5 1 (0.71%) ASP.NET Core
5 1 (0.71%) Kafka
5 1 (0.71%) Microsoft Graph
5 1 (0.71%) OAuth
5 1 (0.71%) React
5 1 (0.71%) Regular Expression
Miscellaneous
1 15 (10.64%) Data Centre
2 11 (7.80%) Hybrid Cloud
2 11 (7.80%) PKI
3 6 (4.26%) Cloud Native
4 5 (3.55%) Enterprise Storage
4 5 (3.55%) Foreign Exchange (FX)
4 5 (3.55%) Private Cloud
5 4 (2.84%) Data Protection Act
5 4 (2.84%) Legacy Applications
5 4 (2.84%) Legacy Systems
6 3 (2.13%) Low-Code
6 3 (2.13%) Self-Motivation
7 2 (1.42%) Algorithms
7 2 (1.42%) Enterprise Software
7 2 (1.42%) Fat Client
7 2 (1.42%) iPad
7 2 (1.42%) Market Risk
7 2 (1.42%) Public Cloud
7 2 (1.42%) Replication
7 2 (1.42%) Video Conferencing
Operating Systems
1 139 (98.58%) Windows
2 44 (31.21%) Linux
3 10 (7.09%) Red Hat Enterprise Linux
4 9 (6.38%) Ubuntu
4 9 (6.38%) Windows 10
5 6 (4.26%) CentOS
5 6 (4.26%) Unix
5 6 (4.26%) Windows Server 2016
5 6 (4.26%) Windows Server 2019
6 2 (1.42%) Apple iOS
6 2 (1.42%) Mac OS
6 2 (1.42%) Windows Server 2003
6 2 (1.42%) Windows Server 2008
6 2 (1.42%) Windows Server 2012
7 1 (0.71%) Android
7 1 (0.71%) Solaris
7 1 (0.71%) VMS
7 1 (0.71%) Windows 7
Processes & Methodologies
1 42 (29.79%) Infrastructure Engineering
2 26 (18.44%) DevOps
3 23 (16.31%) ITIL
4 20 (14.18%) Migration
4 20 (14.18%) Problem-Solving
5 19 (13.48%) Infrastructure as Code
6 16 (11.35%) Agile
6 16 (11.35%) CI/CD
7 13 (9.22%) Disaster Recovery
7 13 (9.22%) Vulnerability Management
8 12 (8.51%) Cybersecurity
9 11 (7.80%) Architectural Design
9 11 (7.80%) High Availability
9 11 (7.80%) SIEM
10 10 (7.09%) Information Security
10 10 (7.09%) Platform Engineering
10 10 (7.09%) Vulnerability Remediation
11 9 (6.38%) Identity Management
11 9 (6.38%) Security Architecture
11 9 (6.38%) Service Delivery
Programming Languages
1 51 (36.17%) PowerShell
2 20 (14.18%) Python
3 17 (12.06%) SQL
4 10 (7.09%) Bash
5 8 (5.67%) C#
6 7 (4.96%) JavaScript
7 5 (3.55%) Bicep
8 4 (2.84%) Java
9 2 (1.42%) Formula Language
9 2 (1.42%) LotusScript
10 1 (0.71%) C
10 1 (0.71%) VB
Qualifications
1 17 (12.06%) Security Cleared
2 13 (9.22%) Degree
3 10 (7.09%) SC Cleared
4 9 (6.38%) Microsoft Certification
5 6 (4.26%) Computer Science Degree
5 6 (4.26%) DV Cleared
5 6 (4.26%) ITIL Foundation Certificate
6 5 (3.55%) Cisco Certification
7 4 (2.84%) CCNA
8 3 (2.13%) Azure Certification
8 3 (2.13%) CCNP
8 3 (2.13%) DBS Check
8 3 (2.13%) ITIL Certification
9 2 (1.42%) BPSS Clearance
9 2 (1.42%) CISSP
9 2 (1.42%) MCITP
9 2 (1.42%) Postgraduate
10 1 (0.71%) CCDP
10 1 (0.71%) GIAC
10 1 (0.71%) MCSA
Quality Assurance & Compliance
1 7 (4.96%) NIST
1 7 (4.96%) SLA
2 4 (2.84%) ISO/IEC 27001
3 2 (1.42%) GDPR
3 2 (1.42%) QA
4 1 (0.71%) Cyber Essentials
4 1 (0.71%) Government Security Classifications
4 1 (0.71%) HIPAA
4 1 (0.71%) HMG Security Policy Framework
4 1 (0.71%) NCSC
4 1 (0.71%) NIST 800
4 1 (0.71%) PCI DSS
System Software
1 84 (59.57%) Active Directory
2 31 (21.99%) VMware Infrastructure
3 15 (10.64%) Hyper-V
4 13 (9.22%) Virtual Machines
5 8 (5.67%) Docker
5 8 (5.67%) vSphere
6 7 (4.96%) VMware ESXi
7 3 (2.13%) Virtual Servers
8 2 (1.42%) HDFS
8 2 (1.42%) Virtual Desktop
8 2 (1.42%) VMware NSX
9 1 (0.71%) Apache ZooKeeper
9 1 (0.71%) BitLocker
9 1 (0.71%) Microsoft App-V
9 1 (0.71%) Terminal Services
9 1 (0.71%) vCloud
9 1 (0.71%) VMware Workstation
Systems Management
1 24 (17.02%) Microsoft Intune
2 20 (14.18%) Terraform
3 18 (12.77%) SCCM
4 10 (7.09%) Ansible
5 8 (5.67%) SCOM
6 6 (4.26%) Kubernetes
7 5 (3.55%) CASB
7 5 (3.55%) SCOrch
7 5 (3.55%) Single Sign-On
7 5 (3.55%) vCenter Server
8 4 (2.84%) Kibana
8 4 (2.84%) Packer
8 4 (2.84%) Puppet
9 3 (2.13%) Jamf Pro
9 3 (2.13%) NetBackup
10 2 (1.42%) FortiGate
10 2 (1.42%) Grafana
10 2 (1.42%) McAfee ePO
10 2 (1.42%) Progress Chef
11 1 (0.71%) ITRS Geneos
Vendors
1 80 (56.74%) Microsoft
2 43 (30.50%) VMware
3 12 (8.51%) Cisco
4 11 (7.80%) Citrix
4 11 (7.80%) Dell
5 7 (4.96%) Oracle
5 7 (4.96%) Red Hat
6 6 (4.26%) Tenable
7 5 (3.55%) HP
7 5 (3.55%) Qualys
7 5 (3.55%) ServiceNow
8 4 (2.84%) Reuters
9 3 (2.13%) Commvault
9 3 (2.13%) Lotus
9 3 (2.13%) Palo Alto
9 3 (2.13%) Remedy
9 3 (2.13%) SnapLogic
10 2 (1.42%) Canon
10 2 (1.42%) CyberArk
10 2 (1.42%) Nintex