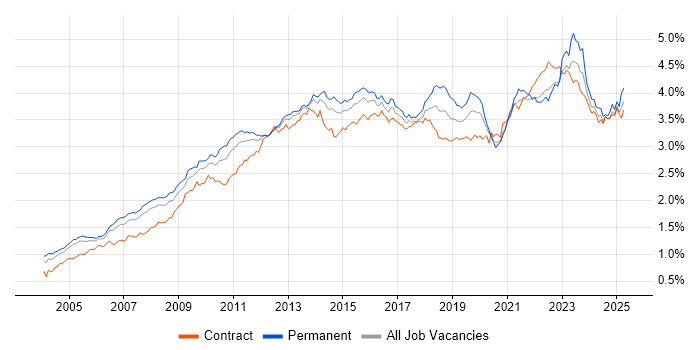
Project Delivery Contracts in London

Project Delivery
England > London

The table below provides summary statistics for contract job vacancies advertised in London requiring Project Delivery skills. It includes a benchmarking guide to the contractor rates offered in vacancies that cited Project Delivery over the 6 months leading up to 30 June 2025, comparing them to the same period in the previous two years.

6 months to
30 Jun 2025
Same period 2024 Same period 2023
Rank 71 65 56
Rank change year-on-year -6 -9 +2
Contract jobs citing Project Delivery 488 587 1,041
As % of all contract jobs advertised in London 3.80% 3.36% 4.12%
As % of the Processes & Methodologies category 4.12% 3.79% 4.55%
Number of daily rates quoted 316 406 707
10th Percentile £385 £375 £402
25th Percentile £465 £450 £500
Median daily rate (50th Percentile) £575 £550 £600
Median % change year-on-year +4.55% -8.33% +9.09%
75th Percentile £695 £675 £738
90th Percentile £775 £775 £800
England median daily rate £525 £525 £550
% change year-on-year - -4.55% +4.76%
Number of hourly rates quoted 4 12 13
10th Percentile £35.58 - -
25th Percentile £42.44 £20.98 £21.24
Median hourly rate £51.25 £25.59 £32.00
Median % change year-on-year +100.27% -20.03% -28.09%
75th Percentile £63.75 £65.00 £66.75
90th Percentile £75.00 £67.70 £78.00
England median hourly rate £65.00 £33.93 £60.00
% change year-on-year +91.57% -43.45% +34.83%

All Process and Methodology Skills
London

Project Delivery falls under the Processes and Methodologies category. For comparison with the information above, the following table provides summary statistics for all contract job vacancies requiring process or methodology skills in London.

Contract vacancies with a requirement for process or methodology skills 11,841 15,477 22,900
As % of all contract IT jobs advertised in London 92.30% 88.55% 90.72%
Number of daily rates quoted 7,918 11,029 16,574
10th Percentile £336 £343 £373
25th Percentile £425 £446 £470
Median daily rate (50th Percentile) £550 £550 £585
Median % change year-on-year - -5.98% +1.74%
75th Percentile £675 £688 £700
90th Percentile £800 £800 £800
England median daily rate £515 £525 £550
% change year-on-year -1.90% -4.55% -
Number of hourly rates quoted 220 303 259
10th Percentile £16.50 £15.59 £18.50
25th Percentile £24.66 £20.01 £23.00
Median hourly rate £32.25 £30.00 £40.00
Median % change year-on-year +7.50% -25.00% +10.48%
75th Percentile £50.13 £48.75 £65.00
90th Percentile £63.30 £68.60 £82.50
England median hourly rate £25.15 £38.12 £37.34
% change year-on-year -34.02% +2.09% +45.40%

Project Delivery
Job Vacancy Trend in London

Job postings citing Project Delivery as a proportion of all IT jobs advertised in London.

Job vacancy trend for Project Delivery in London

Project Delivery
Contractor Daily Rate Trend in London

3-month moving average daily rate quoted in jobs citing Project Delivery in London.

Daily rate trend for Project Delivery in London

Project Delivery
Daily Rate Histogram in London

Daily rate distribution for jobs citing Project Delivery in London over the 6 months to 30 June 2025.

Daily rate histogram for Project Delivery in London

Project Delivery
Contractor Hourly Rate Trend in London

3-month moving average hourly rates quoted in jobs citing Project Delivery in London.

Hourly rate trend for Project Delivery in London

Project Delivery
Hourly Rate Histogram in London

Hourly rate distribution of jobs citing Project Delivery in London over the 6 months to 30 June 2025.

Hourly rate histogram for Project Delivery in London

Project Delivery
Contract Job Locations in London

The table below looks at the demand and provides a guide to the median contractor rates quoted in IT jobs citing Project Delivery within the London region over the 6 months to 30 June 2025. The 'Rank Change' column provides an indication of the change in demand within each location based on the same 6 month period last year.

Location Rank Change
on Same Period
Last Year
Matching
Contract
IT Job Ads
Median
Daily Rate
Past 6 Months
Median Daily Rate
% Change
on Same Period
Last Year
Live
Jobs
Central London +13 91 £600 +6.67% 265
South London -1 4 £600 +9.09% 18
West London -2 3 £525 +2.44% 76
North London - 2 £550 - 6
East London -10 1 - - 100
Project Delivery
England

Project Delivery
Co-occurring Skills and Capabilities in London by Category

The follow tables expand on the table above by listing co-occurrences grouped by category. The same employment type, locality and period is covered with up to 20 co-occurrences shown in each of the following categories:

Application Platforms
1 28 (5.74%) Confluence
2 20 (4.10%) SharePoint
3 16 (3.28%) Microsoft Exchange
4 6 (1.23%) CMS
5 2 (0.41%) Oracle SOA Suite
5 2 (0.41%) Umbraco
5 2 (0.41%) WebSphere
6 1 (0.20%) Adobe Experience Manager
6 1 (0.20%) Apache Spark
6 1 (0.20%) Drupal
6 1 (0.20%) Jupyter
6 1 (0.20%) SAS
6 1 (0.20%) SharePoint 2010
6 1 (0.20%) WordPress
Applications
1 24 (4.92%) Microsoft Excel
2 23 (4.71%) Microsoft Office
3 21 (4.30%) Microsoft Project
4 16 (3.28%) Microsoft PowerPoint
5 13 (2.66%) MS Visio
6 5 (1.02%) AutoCAD
6 5 (1.02%) Trello
7 1 (0.20%) Chatbot
7 1 (0.20%) Revit
7 1 (0.20%) Sketch
Business Applications
1 34 (6.97%) SAP S/4HANA
2 9 (1.84%) Endur
3 6 (1.23%) Dynamics CRM
4 5 (1.02%) Aladdin
5 4 (0.82%) SAP PLM
5 4 (0.82%) SAP PP
5 4 (0.82%) Teamcenter
5 4 (0.82%) Workday HCM
6 3 (0.61%) Oracle Cash Management
6 3 (0.61%) Oracle EBS
6 3 (0.61%) Oracle Financials
6 3 (0.61%) Oracle Payables
6 3 (0.61%) Oracle Receivables
6 3 (0.61%) Salesforce CRM
6 3 (0.61%) SAP GTS
7 2 (0.41%) SAP ERP
7 2 (0.41%) SAP FI
7 2 (0.41%) SAP HCM
7 2 (0.41%) SAP SCM
7 2 (0.41%) Unit4 Business World
Cloud Services
1 79 (16.19%) Azure
2 33 (6.76%) Microsoft 365
3 32 (6.56%) AWS
4 25 (5.12%) Azure DevOps
5 22 (4.51%) SaaS
6 20 (4.10%) Power Platform
7 17 (3.48%) IaaS
8 16 (3.28%) GCP
9 15 (3.07%) OCI
10 12 (2.46%) PaaS
11 10 (2.05%) Dynamics 365
11 10 (2.05%) Entra ID
12 9 (1.84%) Serverless
13 6 (1.23%) OneDrive
14 5 (1.02%) PowerApps
15 4 (0.82%) Amazon EC2
15 4 (0.82%) AWS CloudFormation
15 4 (0.82%) Google Workspace
15 4 (0.82%) Miro
15 4 (0.82%) Power Automate
Communications & Networking
1 34 (6.97%) Firewall
2 20 (4.10%) VPN
3 18 (3.69%) DNS
4 15 (3.07%) MPLS
5 10 (2.05%) Multicast
6 9 (1.84%) BGP
6 9 (1.84%) OSPF
6 9 (1.84%) WAN
7 7 (1.43%) Wi-Fi
8 6 (1.23%) Broadband
8 6 (1.23%) IPv6
8 6 (1.23%) Network Security
9 5 (1.02%) GPON
9 5 (1.02%) TCP/IP
9 5 (1.02%) Wireless
10 4 (0.82%) HTTP
11 3 (0.61%) Internet
11 3 (0.61%) IPsec
11 3 (0.61%) LAN
11 3 (0.61%) SSL
Database & Business Intelligence
1 19 (3.89%) SAP HANA
2 15 (3.07%) Power BI
3 12 (2.46%) Data Lake
4 11 (2.25%) Oracle Reports
5 6 (1.23%) Big Data
5 6 (1.23%) Tableau
6 5 (1.02%) Data Warehouse
7 4 (0.82%) Oracle Database
7 4 (0.82%) SQL Server
8 2 (0.41%) Azure SQL Database
8 2 (0.41%) Data Hub
8 2 (0.41%) DB2
8 2 (0.41%) Metadata
8 2 (0.41%) PostgreSQL
8 2 (0.41%) SAP BW
8 2 (0.41%) SQL Server Reporting Services
9 1 (0.20%) DTS
9 1 (0.20%) NonStop SQL
9 1 (0.20%) Power Query
9 1 (0.20%) RDBMS
Development Applications
1 53 (10.86%) JIRA
2 7 (1.43%) Git
3 4 (0.82%) GitLab
4 3 (0.61%) Jenkins
5 2 (0.41%) JMeter
5 2 (0.41%) LoadRunner
5 2 (0.41%) Sonatype Nexus
6 1 (0.20%) Gatling
6 1 (0.20%) IBM UrbanCode
6 1 (0.20%) IntelliJ
6 1 (0.20%) JProfiler
6 1 (0.20%) LSMW
6 1 (0.20%) MLflow
6 1 (0.20%) NeoLoad
6 1 (0.20%) Postman
6 1 (0.20%) Selenium
6 1 (0.20%) SoapUI
6 1 (0.20%) Subversion
6 1 (0.20%) Toad
General
1 222 (45.49%) Social Skills
2 209 (42.83%) Finance
3 68 (13.93%) Banking
4 47 (9.63%) Analytical Skills
5 32 (6.56%) Marketing
6 30 (6.15%) Public Sector
7 23 (4.71%) Presentation Skills
8 21 (4.30%) Front Office
9 16 (3.28%) Legal
9 16 (3.28%) Retail
10 15 (3.07%) Influencing Skills
10 15 (3.07%) Organisational Skills
11 14 (2.87%) Back Office
11 14 (2.87%) Billing
11 14 (2.87%) Manufacturing
11 14 (2.87%) Telecoms
12 13 (2.66%) Investment Banking
13 10 (2.05%) Financial Institution
14 8 (1.64%) Local Government
14 8 (1.64%) Pharmaceutical
Job Titles
1 147 (30.12%) Project Manager
2 62 (12.70%) Analyst
3 55 (11.27%) Business Analyst
4 46 (9.43%) Lead
5 44 (9.02%) Senior
6 40 (8.20%) Architect
7 35 (7.17%) Consultant
8 34 (6.97%) Delivery Manager
9 22 (4.51%) Senior Manager
10 21 (4.30%) Developer
11 20 (4.10%) IT Manager
11 20 (4.10%) SAP Architect
11 20 (4.10%) SAP S/4HANA Architect
12 19 (3.89%) Senior Project Manager
13 17 (3.48%) IT Project Manager
14 16 (3.28%) Technical Manager
15 13 (2.66%) Network Engineer
16 11 (2.25%) Infrastructure Manager
17 10 (2.05%) Business Manager
17 10 (2.05%) Technical Project Manager
Libraries, Frameworks & Software Standards
1 25 (5.12%) Web Services
2 18 (3.69%) .NET
3 10 (2.05%) HTML
4 9 (1.84%) CSS
5 7 (1.43%) .NET Core
6 6 (1.23%) Oracle Fusion
7 5 (1.02%) Middleware
7 5 (1.02%) REST
7 5 (1.02%) XML
8 4 (0.82%) jQuery
8 4 (0.82%) JSON
8 4 (0.82%) React
8 4 (0.82%) SOAP
9 3 (0.61%) ADO
9 3 (0.61%) Lightning Web Components
9 3 (0.61%) RESTful
10 2 (0.41%) ARM Templates
10 2 (0.41%) Dask
10 2 (0.41%) LangChain
10 2 (0.41%) Smart Contracts
Miscellaneous
1 23 (4.71%) Management Information System
2 19 (3.89%) Product Ownership
3 10 (2.05%) Data Centre
3 10 (2.05%) Data Protection Act
3 10 (2.05%) Onboarding
4 9 (1.84%) Legacy Systems
4 9 (1.84%) Market Risk
5 7 (1.43%) PMI
5 7 (1.43%) Self-Motivation
5 7 (1.43%) Video Conferencing
6 6 (1.23%) Greenfield Project
7 5 (1.02%) Analytical Mindset
7 5 (1.02%) Credit Risk
7 5 (1.02%) Low-Code
7 5 (1.02%) Virtual Team
8 4 (0.82%) Hybrid Cloud
8 4 (0.82%) Reinsurance
8 4 (0.82%) SWIFT Messaging Network
9 3 (0.61%) Enterprise Cloud
9 3 (0.61%) Reference Data
Operating Systems
1 23 (4.71%) Windows
2 12 (2.46%) Windows Server
3 7 (1.43%) Windows 10
4 5 (1.02%) Linux
4 5 (1.02%) Unix
5 1 (0.20%) Android
5 1 (0.20%) Apple iOS
5 1 (0.20%) Windows Server 2012
5 1 (0.20%) Windows Server 2016
5 1 (0.20%) Windows Server 2019
5 1 (0.20%) zOS
Processes & Methodologies
1 187 (38.32%) Agile
2 154 (31.56%) Stakeholder Management
3 153 (31.35%) Project Management
4 91 (18.65%) Problem-Solving
5 78 (15.98%) Stakeholder Engagement
6 74 (15.16%) Migration
7 72 (14.75%) Continuous Improvement
8 68 (13.93%) Change Management
9 55 (11.27%) Risk Management
9 55 (11.27%) Scrum
10 44 (9.02%) Validation
11 43 (8.81%) DevOps
12 41 (8.40%) Decision-Making
12 41 (8.40%) PRINCE2
13 39 (7.99%) Business Analysis
13 39 (7.99%) Waterfall
14 38 (7.79%) ERP
14 38 (7.79%) Requirements Gathering
15 35 (7.17%) Roadmaps
16 33 (6.76%) Data Analysis
Programming Languages
1 49 (10.04%) SQL
2 24 (4.92%) Python
3 17 (3.48%) C#
4 16 (3.28%) PowerShell
5 15 (3.07%) JavaScript
6 9 (1.84%) Java
7 6 (1.23%) Bicep
8 5 (1.02%) VBA
9 3 (0.61%) C++
9 3 (0.61%) Perl
9 3 (0.61%) R
10 2 (0.41%) ABAP
10 2 (0.41%) Bash
10 2 (0.41%) C
10 2 (0.41%) COBOL
10 2 (0.41%) PHP
10 2 (0.41%) PL/SQL
11 1 (0.20%) ActionScript
11 1 (0.20%) T-SQL
11 1 (0.20%) VBScript
Qualifications
1 70 (14.34%) Degree
1 70 (14.34%) Security Cleared
2 59 (12.09%) SC Cleared
3 35 (7.17%) PMI Certification
4 30 (6.15%) PMP
5 14 (2.87%) Cisco Certification
6 11 (2.25%) Computer Science Degree
7 10 (2.05%) CCIE
8 8 (1.64%) Azure Certification
8 8 (1.64%) CBAP
9 7 (1.43%) BPSS Clearance
9 7 (1.43%) CCNP
10 6 (1.23%) Master's Degree
11 5 (1.02%) CCIE Service Provider
11 5 (1.02%) DV Cleared
11 5 (1.02%) PRINCE2 Certification
12 3 (0.61%) Microsoft Certification
12 3 (0.61%) MRICS
12 3 (0.61%) SAP Certification
12 3 (0.61%) Six Sigma Green Belt
Quality Assurance & Compliance
1 25 (5.12%) QA
2 20 (4.10%) PMO
3 12 (2.46%) Accessibility
3 12 (2.46%) MiFID
4 10 (2.05%) EMIR
5 8 (1.64%) GDPR
6 5 (1.02%) Data Quality
6 5 (1.02%) SLA
7 4 (0.82%) ISO 20022
7 4 (0.82%) Sarbanes-Oxley
8 3 (0.61%) SEPA
9 2 (0.41%) Actionable Recommendations
9 2 (0.41%) COBIT
9 2 (0.41%) GxP
9 2 (0.41%) IFRS
9 2 (0.41%) ISO/IEC 27001
10 1 (0.20%) 21 CFR Part 11
10 1 (0.20%) DICOM
10 1 (0.20%) HL7
10 1 (0.20%) SNOMED CT
System Software
1 16 (3.28%) Active Directory
2 8 (1.64%) Docker
3 4 (0.82%) VMware Infrastructure
4 1 (0.20%) BitLocker
4 1 (0.20%) Hyper-V
4 1 (0.20%) Job Entry Subsystem
4 1 (0.20%) KVM
4 1 (0.20%) Microsoft App-V
4 1 (0.20%) Time Sharing Option
4 1 (0.20%) Tivoli Workload Scheduler
4 1 (0.20%) Virtual Desktop
4 1 (0.20%) Virtual Machines
4 1 (0.20%) XenApp
4 1 (0.20%) XenDesktop
Systems Management
1 15 (3.07%) Kubernetes
2 14 (2.87%) Terraform
3 11 (2.25%) Microsoft Intune
4 6 (1.23%) Ansible
4 6 (1.23%) Single Sign-On
5 5 (1.02%) ZABBIX
6 3 (0.61%) SCCM
6 3 (0.61%) WSUS
7 1 (0.20%) FortiGate
7 1 (0.20%) Systems Management Server (SMS)
7 1 (0.20%) Tivoli
Vendors
1 90 (18.44%) Microsoft
2 70 (14.34%) SAP
3 36 (7.38%) Oracle
4 20 (4.10%) Cisco
5 12 (2.46%) Salesforce
6 11 (2.25%) Google
6 11 (2.25%) Workday
7 10 (2.05%) Databricks
8 8 (1.64%) Planview
9 6 (1.23%) Nokia
9 6 (1.23%) ServiceNow
9 6 (1.23%) SolarWinds
9 6 (1.23%) Splunk
10 5 (1.02%) CheckPoint
10 5 (1.02%) F5
10 5 (1.02%) Fortinet
10 5 (1.02%) IBM
10 5 (1.02%) OutSystems
10 5 (1.02%) VMware
11 4 (0.82%) Charles River