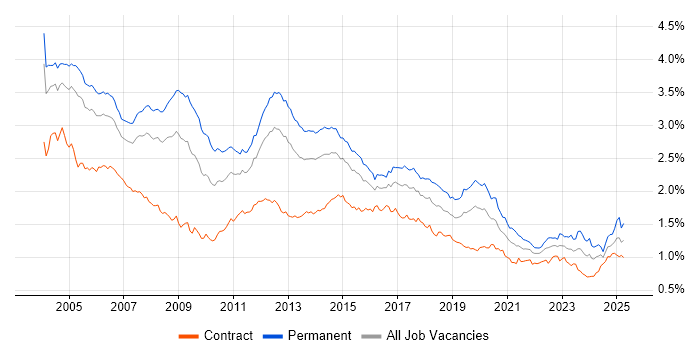
TCP/IP Contract Job Trends in London

Transmission Control Protocol/Internet Protocol (TCP/IP)
England > London

The table below provides summary statistics and contractor rates for jobs advertised in London requiring TCP/IP skills. It covers vacancies from the 6 months leading up to 19 September 2025, with comparisons to the same periods in the previous two years.

6 months to
19 Sep 2025
Same period 2024 Same period 2023
Rank 214 254 266
Rank change year-on-year +40 +12 +12
Contract jobs citing TCP/IP 163 125 193
As % of all contract jobs advertised in London 1.21% 0.77% 0.88%
As % of the Communications & Networking category 12.27% 8.16% 8.42%
Number of daily rates quoted 97 74 126
10th Percentile £250 £225 £239
25th Percentile £350 £263 £375
Median daily rate (50th Percentile) £550 £486 £500
Median % change year-on-year +13.11% -2.75% -7.41%
75th Percentile £638 £600 £681
90th Percentile £750 £650 £781
England median daily rate £469 £469 £450
% change year-on-year - +4.17% -7.22%
Number of hourly rates quoted 3 1 4
10th Percentile £24.72 - £33.10
25th Percentile £32.61 - £54.89
Median hourly rate £54.50 £20.00 £68.50
Median % change year-on-year +172.50% -70.80% +128.33%
75th Percentile £62.75 - £73.25
90th Percentile £63.05 - £79.10
England median hourly rate £65.00 £65.00 £50.00
% change year-on-year - +30.00% -23.08%

All Communications and Computer Networking Skills
London

TCP/IP falls under the Communications and Computer Networking category. For comparison with the information above, the following table provides summary statistics for all contract job vacancies requiring communications or computer networking skills in London.

Contract vacancies with a requirement for communications or computer networking skills 1,328 1,531 2,291
As % of all contract IT jobs advertised in London 9.86% 9.39% 10.45%
Number of daily rates quoted 845 972 1,590
10th Percentile £289 £250 £250
25th Percentile £404 £389 £413
Median daily rate (50th Percentile) £500 £520 £550
Median % change year-on-year -3.85% -5.45% -
75th Percentile £638 £625 £650
90th Percentile £713 £725 £750
England median daily rate £488 £508 £500
% change year-on-year -3.94% +1.50% -1.96%
Number of hourly rates quoted 33 19 44
10th Percentile £18.56 £20.40 £18.93
25th Percentile - £23.80 £19.99
Median hourly rate £25.15 £35.00 £30.75
Median % change year-on-year -28.14% +13.82% +28.61%
75th Percentile £44.75 £55.88 £70.00
90th Percentile £62.05 £66.38 £79.25
England median hourly rate £41.50 £57.35 £56.49
% change year-on-year -27.64% +1.52% +34.50%

TCP/IP
Job Vacancy Trend in London

Job postings citing TCP/IP as a proportion of all IT jobs advertised in London.

Job vacancy trend for TCP/IP in London

TCP/IP
Daily Rate Trend in London

Contractor daily rate distribution trend for jobs in London citing TCP/IP.

Contractor daily rate distribution trend for jobs in London citing TCP/IP

TCP/IP
Daily Rate Histogram in London

Daily rate distribution for jobs citing TCP/IP in London over the 6 months to 19 September 2025.

Daily rate histogram for TCP/IP in London

TCP/IP
Hourly Rate Trend in London

Contractor hourly rate distribution trend for jobs in London citing TCP/IP.

Contractor hourly rate distribution trend for jobs in London citing TCP/IP

TCP/IP
Hourly Rate Histogram in London

Hourly rate distribution of jobs citing TCP/IP in London over the 6 months to 19 September 2025.

Hourly rate histogram for TCP/IP in London

TCP/IP
Contract Job Locations in London

The table below looks at the demand and provides a guide to the median contractor rates quoted in IT jobs citing TCP/IP within the London region over the 6 months to 19 September 2025. The 'Rank Change' column provides an indication of the change in demand within each location based on the same 6 month period last year.

Location Rank Change
on Same Period
Last Year
Matching
Contract
IT Job Ads
Median
Daily Rate
Past 6 Months
Median Daily Rate
% Change
on Same Period
Last Year
Live
Jobs
Central London +2 16 £433 -21.36% 4
South London - 9 £625 - 5
West London - 9 £750 - 3
TCP/IP
England

TCP/IP
Co-occurring Skills and Capabilities in London by Category

The follow tables expand on the table above by listing co-occurrences grouped by category. The same employment type, locality and period is covered with up to 20 co-occurrences shown in each of the following categories:

Application Platforms
1 10 (6.13%) SharePoint
2 5 (3.07%) Microsoft Exchange
3 2 (1.23%) nginx
4 1 (0.61%) Confluence
Applications
1 13 (7.98%) Microsoft Office
2 3 (1.84%) AutoCAD
3 1 (0.61%) Microsoft Excel
3 1 (0.61%) Spreadsheet
Business Applications
1 1 (0.61%) Dynamics CRM
1 1 (0.61%) Eikon
1 1 (0.61%) Eze OMS
1 1 (0.61%) Fidessa
1 1 (0.61%) SAP S/4HANA
Cloud Services
1 39 (23.93%) AWS
2 37 (22.70%) Azure
3 33 (20.25%) Microsoft 365
4 18 (11.04%) Amazon EC2
5 12 (7.36%) Entra ID
5 12 (7.36%) GitHub
6 11 (6.75%) Amazon CloudWatch
6 11 (6.75%) Azure Monitor
7 10 (6.13%) GCP
8 9 (5.52%) Amazon ELB
8 9 (5.52%) Amazon S3
8 9 (5.52%) Virtual Private Cloud
9 7 (4.29%) AWS CloudFormation
9 7 (4.29%) Azure Sentinel
10 6 (3.68%) Amazon EKS
10 6 (3.68%) Azure DevOps
11 4 (2.45%) OneDrive
12 3 (1.84%) Azure Data Factory
12 3 (1.84%) Azure Machine Learning
12 3 (1.84%) Dynamics 365
Communications & Networking
1 101 (61.96%) DNS
2 57 (34.97%) Firewall
3 56 (34.36%) VPN
4 49 (30.06%) DHCP
5 33 (20.25%) HTTP
5 33 (20.25%) SSL
6 32 (19.63%) LAN
7 27 (16.56%) Network Security
7 27 (16.56%) WAN
8 21 (12.88%) Internet
9 17 (10.43%) VLAN
9 17 (10.43%) Wireless
10 14 (8.59%) BGP
10 14 (8.59%) OSPF
11 13 (7.98%) SMTP
12 7 (4.29%) IP Telephony
12 7 (4.29%) IPsec
12 7 (4.29%) SSH
13 6 (3.68%) 4G
13 6 (3.68%) Wi-Fi
Database & Business Intelligence
1 9 (5.52%) Amazon RDS
2 7 (4.29%) NoSQL
3 6 (3.68%) Amazon Aurora
4 3 (1.84%) Power BI
5 2 (1.23%) Apache Cassandra
5 2 (1.23%) Hadoop
5 2 (1.23%) MongoDB
5 2 (1.23%) PostgreSQL
5 2 (1.23%) SQL Server
6 1 (0.61%) Data Lake
Development Applications
1 19 (11.66%) Git
2 16 (9.82%) Jenkins
3 8 (4.91%) GitLab
4 7 (4.29%) JIRA
5 6 (3.68%) Subversion
6 4 (2.45%) Robot Framework
6 4 (2.45%) TeamCity
7 3 (1.84%) Bitbucket
8 2 (1.23%) Mercurial
9 1 (0.61%) Atlassian Bamboo
9 1 (0.61%) Burp Suite
General
1 71 (43.56%) Social Skills
2 33 (20.25%) Finance
3 26 (15.95%) Analytical Skills
4 12 (7.36%) Public Sector
5 8 (4.91%) Banking
6 6 (3.68%) Financial Institution
6 6 (3.68%) Front Office
7 5 (3.07%) Legal
7 5 (3.07%) Telecoms
8 4 (2.45%) Documentation Skills
8 4 (2.45%) Games
9 3 (1.84%) Investment Banking
9 3 (1.84%) Local Government
10 2 (1.23%) Electronics
10 2 (1.23%) Inclusion and Diversity
10 2 (1.23%) Manufacturing
10 2 (1.23%) Marketing
10 2 (1.23%) Military
10 2 (1.23%) Presentation Skills
10 2 (1.23%) Retail
Job Titles
1 23 (14.11%) Infrastructure Engineer
2 22 (13.50%) Senior
3 20 (12.27%) Network Engineer
4 19 (11.66%) Support Engineer
5 14 (8.59%) Analyst
5 14 (8.59%) IT Support
6 12 (7.36%) Senior Infrastructure Engineer
7 11 (6.75%) DevOps Engineer
8 10 (6.13%) Support Analyst
9 9 (5.52%) Developer
10 8 (4.91%) 1st Line Engineer
10 8 (4.91%) IT Engineer
10 8 (4.91%) Senior DevOps
10 8 (4.91%) Senior DevOps Engineer
11 7 (4.29%) 2nd Line Support
11 7 (4.29%) Technical Support
12 6 (3.68%) Desktop Engineer
12 6 (3.68%) Desktop Support
12 6 (3.68%) Technical Engineer
12 6 (3.68%) Technical Support Engineer
Libraries, Frameworks & Software Standards
1 8 (4.91%) .NET
1 8 (4.91%) Elastic Stack
2 7 (4.29%) FIX Protocol
2 7 (4.29%) LDAP
2 7 (4.29%) Middleware
3 6 (3.68%) REST
4 5 (3.07%) FpML
5 3 (1.84%) JSON
5 3 (1.84%) OpenTelemetry
5 3 (1.84%) SAML
5 3 (1.84%) YAML
6 2 (1.23%) .NET Framework
6 2 (1.23%) ASP.NET
6 2 (1.23%) Node.js
6 2 (1.23%) React
7 1 (0.61%) 802.1X
7 1 (0.61%) Kafka
7 1 (0.61%) SAP Basis
7 1 (0.61%) TIBCO EMS
7 1 (0.61%) Ultra Messaging
Miscellaneous
1 10 (6.13%) Data Centre
1 10 (6.13%) Video Conferencing
2 9 (5.52%) Distributed Systems
3 8 (4.91%) Self-Motivation
4 7 (4.29%) Foreign Exchange (FX)
4 7 (4.29%) Onboarding
4 7 (4.29%) Private Cloud
5 6 (3.68%) Fixed Income
5 6 (3.68%) iPad
5 6 (3.68%) iPhone
5 6 (3.68%) Management Information System
5 6 (3.68%) Security Operations Centre
6 5 (3.07%) Algorithms
6 5 (3.07%) Clustering
6 5 (3.07%) Data Structures
6 5 (3.07%) Derivative
6 5 (3.07%) PKI
6 5 (3.07%) Replication
7 4 (2.45%) Digital Signage
7 4 (2.45%) Video\Live Streaming
Operating Systems
1 60 (36.81%) Windows
2 44 (26.99%) Linux
3 19 (11.66%) Windows 10
4 14 (8.59%) Mac OS
5 13 (7.98%) Unix
6 10 (6.13%) Windows Server
7 6 (3.68%) Android
7 6 (3.68%) Red Hat Enterprise Linux
7 6 (3.68%) Windows 7
7 6 (3.68%) Windows Server 2016
7 6 (3.68%) Windows Server 2019
8 5 (3.07%) Apple iOS
9 4 (2.45%) Solaris
10 2 (1.23%) CentOS
11 1 (0.61%) Kali Linux
11 1 (0.61%) Mac OS X
11 1 (0.61%) VMS
Processes & Methodologies
1 36 (22.09%) Problem-Solving
2 34 (20.86%) High Availability
3 31 (19.02%) DevOps
4 25 (15.34%) CI/CD
5 24 (14.72%) Infrastructure as Code
5 24 (14.72%) Infrastructure Engineering
6 20 (12.27%) Security Operations
7 19 (11.66%) Agile
8 16 (9.82%) Computer Science
9 14 (8.59%) Infrastructure Automation
9 14 (8.59%) SIEM
10 13 (7.98%) Configuration Management
10 13 (7.98%) Continuous Integration
10 13 (7.98%) Customer Service
10 13 (7.98%) Cybersecurity
10 13 (7.98%) Infrastructure Management
10 13 (7.98%) Low Latency
10 13 (7.98%) Mentoring
11 12 (7.36%) Incident Response
11 12 (7.36%) Load Balancing
Programming Languages
1 47 (28.83%) Python
2 26 (15.95%) Bash
3 22 (13.50%) PowerShell
4 13 (7.98%) SQL
5 12 (7.36%) C#
6 11 (6.75%) Perl
7 9 (5.52%) C++
8 7 (4.29%) Java
9 5 (3.07%) Kusto Query Language
10 4 (2.45%) Go
11 3 (1.84%) Bicep
11 3 (1.84%) C
12 2 (1.23%) JavaScript
12 2 (1.23%) PHP
12 2 (1.23%) Shell Script
12 2 (1.23%) VB
Qualifications
1 27 (16.56%) Security Cleared
2 24 (14.72%) SC Cleared
3 22 (13.50%) Degree
4 20 (12.27%) Cisco Certification
5 13 (7.98%) CCNP
6 12 (7.36%) CCNA
7 10 (6.13%) Computer Science Degree
8 5 (3.07%) JNCIA
9 4 (2.45%) CCIE
9 4 (2.45%) MCSA
9 4 (2.45%) Microsoft Certification
10 3 (1.84%) CISSP
10 3 (1.84%) CompTIA Security+
10 3 (1.84%) MCSE
11 2 (1.23%) Azure Certification
11 2 (1.23%) CEH
11 2 (1.23%) CompTIA CySA+
11 2 (1.23%) DV Cleared
11 2 (1.23%) GCIH
11 2 (1.23%) MOS
Quality Assurance & Compliance
1 7 (4.29%) GDPR
2 5 (3.07%) Cyber Essentials
3 4 (2.45%) Sarbanes-Oxley
3 4 (2.45%) SLA
4 3 (1.84%) NCSC
5 2 (1.23%) Government Security Classifications
5 2 (1.23%) HMG Security Policy Framework
5 2 (1.23%) ISO/IEC 27001
5 2 (1.23%) NIST
6 1 (0.61%) QA
6 1 (0.61%) SOC 2
System Software
1 32 (19.63%) Active Directory
2 17 (10.43%) VMware Infrastructure
3 15 (9.20%) Docker
4 7 (4.29%) VMware ESXi
5 6 (3.68%) Virtual Machines
6 4 (2.45%) NFS
6 4 (2.45%) Veritas File System
6 4 (2.45%) Veritas Volume Manager
7 3 (1.84%) Virtual Desktop
8 2 (1.23%) Firmware
8 2 (1.23%) Hyper-V
8 2 (1.23%) iptables
8 2 (1.23%) VMware NSX
9 1 (0.61%) vSphere
Systems Management
1 37 (22.70%) Ansible
2 36 (22.09%) Terraform
3 14 (8.59%) Grafana
3 14 (8.59%) SCCM
4 12 (7.36%) Prometheus
5 9 (5.52%) Kubernetes
6 8 (4.91%) Microsoft Intune
6 8 (4.91%) Puppet
7 7 (4.29%) FortiGate
8 6 (3.68%) Progress Chef
9 5 (3.07%) QRadar
10 4 (2.45%) Red Hat Satellite
11 3 (1.84%) Single Sign-On
11 3 (1.84%) WSUS
12 2 (1.23%) Consul
12 2 (1.23%) CSIRT
12 2 (1.23%) HAProxy
12 2 (1.23%) ITRS Geneos
12 2 (1.23%) Nessus
12 2 (1.23%) vCenter Server
Vendors
1 36 (22.09%) Microsoft
2 27 (16.56%) Cisco
3 20 (12.27%) F5
3 20 (12.27%) Palo Alto
4 19 (11.66%) VMware
5 14 (8.59%) CheckPoint
6 12 (7.36%) Fortinet
6 12 (7.36%) Red Hat
7 11 (6.75%) ServiceNow
8 10 (6.13%) Google
8 10 (6.13%) Splunk
9 7 (4.29%) Juniper
9 7 (4.29%) Qualys
9 7 (4.29%) Zscaler
10 6 (3.68%) Apple
10 6 (3.68%) CyberArk
11 5 (3.07%) Citrix
11 5 (3.07%) Meraki
12 4 (2.45%) SaltStack
12 4 (2.45%) SolarWinds