Cybersecurity Contract Job Trends in London

Cybersecurity
England > London

The table below provides summary statistics and contractor rates for jobs advertised in London requiring Cybersecurity skills. It covers contract job vacancies from the 6 months leading up to 22 November 2025, with comparisons to the same periods in the previous two years.

6 months to
22 Nov 2025
Same period 2024 Same period 2023
Rank 55 57 64
Rank change year-on-year +2 +7 +7
Contract jobs citing Cybersecurity 666 583 731
As % of all contract jobs in London 4.71% 3.69% 3.64%
As % of the Processes & Methodologies category 5.10% 4.12% 4.06%
Number of daily rates quoted 396 368 500
10th Percentile £411 £400 £425
25th Percentile £485 £500 £500
Median daily rate (50th Percentile) £600 £600 £600
75th Percentile £688 £700 £741
90th Percentile £775 £788 £825
England median daily rate £537 £575 £600
% change year-on-year -6.61% -4.17% -
Number of hourly rates quoted 11 6 2
10th Percentile £30.00 £38.62 £53.00
25th Percentile £36.25 £52.44 £55.63
Median hourly rate £47.00 £65.00 £62.50
Median % change year-on-year -27.69% +4.00% -3.85%
75th Percentile £67.88 £77.86 £70.63
90th Percentile £93.75 £80.80 £74.00
England median hourly rate £45.46 £52.00 £72.76
% change year-on-year -12.58% -28.53% +11.09%

All Process and Methodology Skills
London

Cybersecurity falls under the Processes and Methodologies category. For comparison with the information above, the following table provides summary statistics for all contract job vacancies requiring process or methodology skills in London.

Contract vacancies with a requirement for process or methodology skills 13,057 14,136 18,004
As % of all contract IT jobs advertised in London 92.24% 89.39% 89.72%
Number of daily rates quoted 8,585 9,131 12,920
10th Percentile £334 £350 £351
25th Percentile £425 £450 £460
Median daily rate (50th Percentile) £535 £550 £570
Median % change year-on-year -2.73% -3.51% -3.39%
75th Percentile £653 £675 £688
90th Percentile £775 £800 £800
England median daily rate £505 £525 £545
% change year-on-year -3.81% -3.67% -0.91%
Number of hourly rates quoted 258 170 250
10th Percentile £17.98 £17.25 £18.76
25th Percentile £24.50 £23.80 £21.75
Median hourly rate £28.31 £37.50 £37.17
Median % change year-on-year -24.50% +0.89% -4.39%
75th Percentile £47.00 £55.94 £61.75
90th Percentile £68.06 £80.75 £76.25
England median hourly rate £25.15 £35.36 £45.00
% change year-on-year -28.87% -21.42% +26.76%

Cybersecurity
Job Vacancy Trend in London

Historical trend showing the proportion of contract IT job postings citing Cybersecurity relative to all contract IT jobs advertised in London.
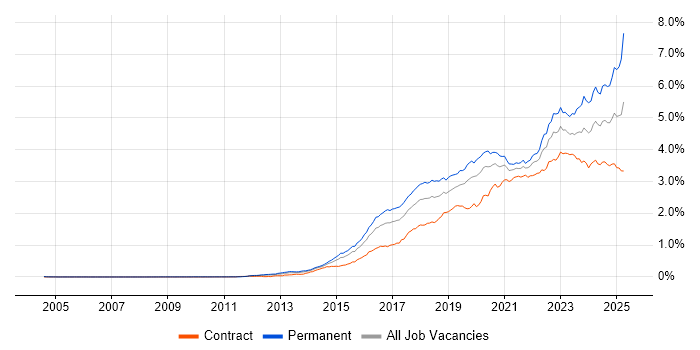
Cybersecurity job vacancy trend in London

Cybersecurity
Daily Rate Trend in London

Contractor daily rate distribution trend for jobs in London citing Cybersecurity.

Contractor daily rate distribution trend for jobs in London citing Cybersecurity

Cybersecurity
Daily Rate Histogram in London

Daily rate distribution for jobs citing Cybersecurity in London over the 6 months to 22 November 2025.

Daily rate histogram for Cybersecurity in London

Cybersecurity
Hourly Rate Trend in London

Contractor hourly rate distribution trend for jobs in London citing Cybersecurity.

Contractor hourly rate distribution trend for jobs in London citing Cybersecurity

Cybersecurity
Hourly Rate Histogram in London

Hourly rate distribution of jobs citing Cybersecurity in London over the 6 months to 22 November 2025.

Hourly rate histogram for Cybersecurity in London

Cybersecurity
Contract Job Locations in London

The table below looks at the demand and provides a guide to the median contractor rates quoted in IT jobs citing Cybersecurity within the London region over the 6 months to 22 November 2025. The 'Rank Change' column provides an indication of the change in demand within each location based on the same 6 month period last year.

Location Rank Change
on Same Period
Last Year
Matching
Contract
IT Job Ads
Median
Daily Rate
Past 6 Months
Median Daily Rate
% Change
on Same Period
Last Year
Live
Jobs
Central London -19 77 £533 -6.29% 245
West London -5 8 £423 -39.64% 60
South London -5 6 £525 -12.54% 26
North London +4 4 £650 +71.05% 16
East London -7 3 £675 +15.38% 36
Cybersecurity
England

Cybersecurity
Co-Occurring Skills & Capabilities in London by Category

The following tables expand on the one above by listing co-occurrences grouped by category. They cover the same employment type, locality and period, with up to 20 co-occurrences shown in each category:

Application Platforms
1 21 (3.15%) Confluence
2 20 (3.00%) SharePoint
3 11 (1.65%) Apache
3 11 (1.65%) Microsoft Exchange
4 2 (0.30%) Oracle HTTP Server
4 2 (0.30%) Tomcat
4 2 (0.30%) WebLogic
5 1 (0.15%) CMS
Applications
1 18 (2.70%) Microsoft Excel
2 10 (1.50%) Microsoft Project
3 9 (1.35%) Microsoft Office
4 5 (0.75%) MS Visio
5 4 (0.60%) Microsoft PowerPoint
6 3 (0.45%) Trello
7 1 (0.15%) GNU Octave
7 1 (0.15%) Spreadsheet
Business Applications
1 4 (0.60%) Dynamics CRM
1 4 (0.60%) SAP S/4HANA
2 2 (0.30%) SAP ERP
3 1 (0.15%) Eikon
3 1 (0.15%) Eze OMS
3 1 (0.15%) Fidessa
3 1 (0.15%) Oracle ERP
Cloud Services
1 160 (24.02%) Azure
2 103 (15.47%) AWS
3 64 (9.61%) Microsoft 365
4 49 (7.36%) GCP
5 38 (5.71%) Entra ID
6 34 (5.11%) GitHub
6 34 (5.11%) SaaS
7 21 (3.15%) Microsoft Purview
8 19 (2.85%) Azure Sentinel
9 16 (2.40%) Power Platform
10 15 (2.25%) Amazon S3
11 14 (2.10%) Serverless
12 12 (1.80%) GitHub Actions
13 10 (1.50%) Amazon EC2
14 9 (1.35%) Amazon SQS
14 9 (1.35%) Azure AKS
15 8 (1.20%) Dynamics 365
16 7 (1.05%) Azure DevOps
16 7 (1.05%) PaaS
17 5 (0.75%) Amazon CloudWatch
Communications & Networking
1 78 (11.71%) Firewall
2 45 (6.76%) Network Security
3 20 (3.00%) DNS
4 15 (2.25%) WAN
5 14 (2.10%) VPN
6 12 (1.80%) TCP/IP
7 11 (1.65%) Wi-Fi
8 10 (1.50%) SSL
9 9 (1.35%) Intrusion Detection
10 8 (1.20%) DHCP
10 8 (1.20%) Internet
10 8 (1.20%) LAN
10 8 (1.20%) Wireless
11 6 (0.90%) HTTP
11 6 (0.90%) IP Telephony
12 5 (0.75%) Modbus
12 5 (0.75%) VLAN
13 3 (0.45%) Cisco ASA
13 3 (0.45%) SSH
13 3 (0.45%) Structured Cabling
Database & Business Intelligence
1 14 (2.10%) Power BI
2 10 (1.50%) Big Data
3 7 (1.05%) Data Lake
4 5 (0.75%) Amazon Athena
4 5 (0.75%) PostgreSQL
4 5 (0.75%) SQL Server Reporting Services
4 5 (0.75%) Tableau
5 4 (0.60%) Amazon RDS
6 3 (0.45%) Data Warehouse
7 2 (0.30%) BigQuery
7 2 (0.30%) Metadata
7 2 (0.30%) SQL Server
7 2 (0.30%) SQL Server Analysis Services
7 2 (0.30%) SQL Server Integration Services
7 2 (0.30%) Star Schema
8 1 (0.15%) GIS
8 1 (0.15%) Looker
8 1 (0.15%) Oracle Database
8 1 (0.15%) Pinecone
Development Applications
1 30 (4.50%) JIRA
2 18 (2.70%) Burp Suite
2 18 (2.70%) Metasploit
3 14 (2.10%) SonarQube
4 7 (1.05%) GitLab
5 5 (0.75%) Git
6 4 (0.60%) Jenkins
7 3 (0.45%) Cypress.io
8 1 (0.15%) Ant
8 1 (0.15%) Balsamiq
8 1 (0.15%) Bitbucket
8 1 (0.15%) Fiddler
8 1 (0.15%) IDA Disassembler
8 1 (0.15%) Postman
8 1 (0.15%) Snyk
8 1 (0.15%) Zephyr
General
1 215 (32.28%) Social Skills
2 162 (24.32%) Finance
3 80 (12.01%) Public Sector
4 72 (10.81%) Analytical Skills
5 68 (10.21%) Banking
6 25 (3.75%) Legal
7 18 (2.70%) Documentation Skills
7 18 (2.70%) Telecoms
8 17 (2.55%) Investment Banking
9 16 (2.40%) Financial Institution
10 15 (2.25%) Manufacturing
10 15 (2.25%) Presentation Skills
11 14 (2.10%) Local Government
12 13 (1.95%) Military
13 11 (1.65%) Organisational Skills
14 10 (1.50%) Inclusion and Diversity
14 10 (1.50%) Law
14 10 (1.50%) Retail
15 8 (1.20%) Influencing Skills
16 6 (0.90%) Marketing
Job Titles
1 109 (16.37%) Analyst
2 97 (14.56%) Security Engineer
3 69 (10.36%) Architect
4 67 (10.06%) Senior
5 57 (8.56%) Security Analyst
6 55 (8.26%) Consultant
7 52 (7.81%) Security Architect
8 50 (7.51%) Cybersecurity Engineer
9 41 (6.16%) Project Manager
9 41 (6.16%) Security Manager
10 35 (5.26%) Cybersecurity Analyst
11 32 (4.80%) Lead
12 31 (4.65%) Tester
13 29 (4.35%) Cybersecurity Manager
13 29 (4.35%) Security Consultant
14 26 (3.90%) Penetration Tester
15 25 (3.75%) Business Analyst
15 25 (3.75%) Cybersecurity Consultant
16 20 (3.00%) Security Specialist
17 18 (2.70%) IT Manager
Libraries, Frameworks & Software Standards
1 19 (2.85%) Kafka
2 14 (2.10%) React
3 12 (1.80%) REST
4 11 (1.65%) OAuth
4 11 (1.65%) SAML
5 10 (1.50%) .NET
6 9 (1.35%) Apache NiFi
6 9 (1.35%) OpenID
6 9 (1.35%) SailPoint
7 5 (0.75%) GraphQL
7 5 (0.75%) LangChain
8 4 (0.60%) FastAPI
8 4 (0.60%) LDAP
8 4 (0.60%) NestJS
8 4 (0.60%) Node.js
8 4 (0.60%) PyTorch
8 4 (0.60%) Regular Expression
8 4 (0.60%) TensorFlow
9 3 (0.45%) OAuth2
9 3 (0.45%) RabbitMQ
Miscellaneous
1 50 (7.51%) Management Information System
2 47 (7.06%) Security Posture
3 46 (6.91%) Cyber Threat
4 35 (5.26%) Onboarding
4 35 (5.26%) Security Operations Centre
5 23 (3.45%) Cyber Defence
6 21 (3.15%) Data Centre
7 20 (3.00%) Cloud Native
7 20 (3.00%) Product Ownership
8 18 (2.70%) Data Protection Act
9 16 (2.40%) PKI
10 13 (1.95%) Operational Technology
11 12 (1.80%) CSOC
12 9 (1.35%) Legacy Systems
13 8 (1.20%) Greenfield Project
13 8 (1.20%) Hybrid Cloud
14 7 (1.05%) IoT
15 6 (0.90%) CMDB
15 6 (0.90%) NHS
15 6 (0.90%) Video Conferencing
Operating Systems
1 79 (11.86%) Windows
2 48 (7.21%) Linux
3 26 (3.90%) Mac OS
4 15 (2.25%) Unix
4 15 (2.25%) Windows 10
5 12 (1.80%) Windows Server
6 6 (0.90%) Android
7 5 (0.75%) Windows 7
8 4 (0.60%) Apple iOS
9 3 (0.45%) Kali Linux
9 3 (0.45%) VMS
10 2 (0.30%) CentOS
10 2 (0.30%) Red Hat Enterprise Linux
10 2 (0.30%) Ubuntu
11 1 (0.15%) FreeRTOS
11 1 (0.15%) Mac OS X
11 1 (0.15%) Windows Server 2012
Processes & Methodologies
1 126 (18.92%) SIEM
2 125 (18.77%) Incident Response
3 113 (16.97%) Cloud Security
4 105 (15.77%) Agile
5 103 (15.47%) Information Security
6 101 (15.17%) Security Operations
7 97 (14.56%) Stakeholder Management
8 83 (12.46%) Risk Management
9 79 (11.86%) Problem-Solving
10 66 (9.91%) Penetration Testing
10 66 (9.91%) Vulnerability Management
11 65 (9.76%) Stakeholder Engagement
12 63 (9.46%) Threat Intelligence
13 62 (9.31%) Cyber Threat Intelligence
14 61 (9.16%) CI/CD
15 59 (8.86%) Security Architecture
16 57 (8.56%) Continuous Improvement
17 53 (7.96%) DevOps
17 53 (7.96%) Identity Access Management
18 52 (7.81%) AI
Programming Languages
1 80 (12.01%) Python
2 49 (7.36%) PowerShell
3 39 (5.86%) Bash
4 27 (4.05%) Kusto Query Language
5 15 (2.25%) Java
6 13 (1.95%) JavaScript
6 13 (1.95%) SQL
7 12 (1.80%) C#
7 12 (1.80%) C++
8 4 (0.60%) Bicep
9 2 (0.30%) Perl
9 2 (0.30%) Shell Script
9 2 (0.30%) TypeScript
10 1 (0.15%) BeanShell
10 1 (0.15%) C
10 1 (0.15%) LookML
10 1 (0.15%) PromQL
10 1 (0.15%) R
10 1 (0.15%) Ruby
10 1 (0.15%) Search Processing Language
Qualifications
1 196 (29.43%) Security Cleared
2 163 (24.47%) SC Cleared
3 102 (15.32%) CISSP
4 58 (8.71%) Degree
5 57 (8.56%) CISM
6 34 (5.11%) CHECK Team Member
6 34 (5.11%) DV Cleared
7 31 (4.65%) OSCP
8 26 (3.90%) CEH
9 25 (3.75%) CHECK Team Leader
10 24 (3.60%) CompTIA Security+
11 21 (3.15%) CREST Certified
12 17 (2.55%) Cisco Certification
13 15 (2.25%) GIAC
13 15 (2.25%) PMI Certification
13 15 (2.25%) PMP
14 13 (1.95%) Computer Science Degree
14 13 (1.95%) Tigerscheme
15 12 (1.80%) (ISC)2 CCSP
15 12 (1.80%) ISO 27001 Lead Auditor
Quality Assurance & Compliance
1 119 (17.87%) ISO/IEC 27001
2 113 (16.97%) NIST
3 51 (7.66%) GDPR
4 36 (5.41%) Cyber Essentials
5 32 (4.80%) NCSC
6 26 (3.90%) GRC
7 21 (3.15%) PCI DSS
8 15 (2.25%) QA
9 14 (2.10%) Sarbanes-Oxley
10 12 (1.80%) Cyber Essentials PLUS
11 9 (1.35%) COBIT
11 9 (1.35%) EU AI Act
11 9 (1.35%) ISO/IEC 27005
11 9 (1.35%) SLA
12 7 (1.05%) Accessibility
13 6 (0.90%) HIPAA
13 6 (0.90%) SOC 2
14 5 (0.75%) NIST 800
15 4 (0.60%) ITGC
16 3 (0.45%) ISO/IEC 27002 (supersedes ISO/IEC 17799)
System Software
1 56 (8.41%) Active Directory
2 13 (1.95%) Virtual Machines
3 6 (0.90%) Docker
4 3 (0.45%) VMware Infrastructure
5 1 (0.15%) Embedded Firmware
5 1 (0.15%) Firmware
5 1 (0.15%) Hyper-V
5 1 (0.15%) Virtual Desktop
Systems Management
1 24 (3.60%) Terraform
2 22 (3.30%) Microsoft Intune
3 18 (2.70%) SCCM
4 16 (2.40%) Nmap
5 14 (2.10%) Jamf Pro
6 12 (1.80%) Kubernetes
7 11 (1.65%) CASB
8 9 (1.35%) QRadar
9 8 (1.20%) CSIRT
10 7 (1.05%) Ansible
10 7 (1.05%) Nessus
11 6 (0.90%) SCOrch
12 5 (0.75%) AirWatch
13 4 (0.60%) Prometheus
13 4 (0.60%) Single Sign-On
13 4 (0.60%) WSUS
14 3 (0.45%) Computer Emergency Response Teams
14 3 (0.45%) RSA Archer
15 2 (0.30%) Grafana
15 2 (0.30%) logstash
Vendors
1 148 (22.22%) Microsoft
2 69 (10.36%) Splunk
3 31 (4.65%) ServiceNow
4 28 (4.20%) CrowdStrike
5 19 (2.85%) CyberArk
6 18 (2.70%) Tenable
7 17 (2.55%) Oracle
8 16 (2.40%) Google
8 16 (2.40%) SAP
9 15 (2.25%) Palo Alto
9 15 (2.25%) Veracode
10 13 (1.95%) Cisco
10 13 (1.95%) Darktrace
11 11 (1.65%) Fortinet
11 11 (1.65%) Salesforce
12 8 (1.20%) VMware
13 7 (1.05%) Qualys
13 7 (1.05%) Zscaler
14 6 (0.90%) Forcepoint
14 6 (0.90%) Okta