SharePoint Contract Job Trends in London

Microsoft SharePoint
England > London

The table below provides summary statistics and contractor rates for jobs advertised in London requiring SharePoint skills. It covers contract job vacancies from the 6 months leading up to 16 October 2025, with comparisons to the same periods in the previous two years.

6 months to
16 Oct 2025
Same period 2024 Same period 2023
Rank 131 137 111
Rank change year-on-year +6 -26 +22
Contract jobs citing SharePoint 298 310 478
As % of all contract jobs in London 2.23% 1.93% 2.30%
As % of the Application Platforms category 19.49% 15.48% 21.78%
Number of daily rates quoted 196 191 342
10th Percentile £269 £225 £263
25th Percentile £383 £300 £398
Median daily rate (50th Percentile) £453 £468 £500
Median % change year-on-year -3.35% -6.37% +1.63%
75th Percentile £548 £551 £629
90th Percentile £631 £663 £743
England median daily rate £450 £450 £450
Number of hourly rates quoted 6 8 6
10th Percentile £17.50 £17.08 £18.57
25th Percentile £19.25 £17.77 £21.13
Median hourly rate £25.00 £23.80 £21.75
Median % change year-on-year +5.04% +9.43% -35.88%
75th Percentile £25.50 £26.60 £25.25
90th Percentile £27.75 £35.00 £41.75
England median hourly rate £27.21 £30.00 £22.25
% change year-on-year -9.30% +34.83% +8.54%

All Application Platform Skills
London

SharePoint falls under the Application Platforms category. For comparison with the information above, the following table provides summary statistics for all contract job vacancies requiring application platform skills in London.

Contract vacancies with a requirement for application platform skills 1,529 2,002 2,195
As % of all contract IT jobs advertised in London 11.42% 12.47% 10.58%
Number of daily rates quoted 1,052 1,355 1,517
10th Percentile £313 £309 £300
25th Percentile £413 £431 £425
Median daily rate (50th Percentile) £525 £570 £550
Median % change year-on-year -7.89% +3.64% -
75th Percentile £638 £749 £675
90th Percentile £783 £850 £788
England median daily rate £500 £525 £513
% change year-on-year -4.76% +2.44% -2.38%
Number of hourly rates quoted 23 22 24
10th Percentile £19.97 £17.17 £18.20
25th Percentile £24.83 £21.70 £21.50
Median hourly rate £31.50 £23.80 £27.50
Median % change year-on-year +32.35% -13.45% +12.24%
75th Percentile £50.63 £35.00 £59.25
90th Percentile £88.50 £73.88 £82.30
England median hourly rate £35.00 £42.50 £28.75
% change year-on-year -17.65% +47.83% +40.24%

SharePoint
Job Vacancy Trend in London

Historical trend showing the proportion of contract IT job postings citing SharePoint relative to all contract IT jobs advertised in London.
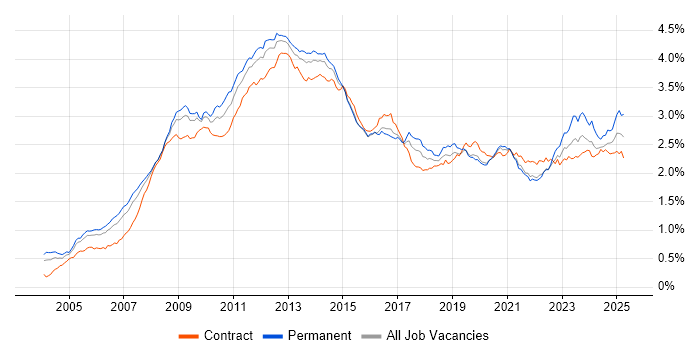
SharePoint job vacancy trend in London

SharePoint
Daily Rate Trend in London

Contractor daily rate distribution trend for jobs in London citing SharePoint.

Contractor daily rate distribution trend for jobs in London citing SharePoint

SharePoint
Daily Rate Histogram in London

Daily rate distribution for jobs citing SharePoint in London over the 6 months to 16 October 2025.

Daily rate histogram for SharePoint in London

SharePoint
Hourly Rate Trend in London

Contractor hourly rate distribution trend for jobs in London citing SharePoint.

Contractor hourly rate distribution trend for jobs in London citing SharePoint

SharePoint
Hourly Rate Histogram in London

Hourly rate distribution of jobs citing SharePoint in London over the 6 months to 16 October 2025.

Hourly rate histogram for SharePoint in London

SharePoint
Contract Job Locations in London

The table below looks at the demand and provides a guide to the median contractor rates quoted in IT jobs citing SharePoint within the London region over the 6 months to 16 October 2025. The 'Rank Change' column provides an indication of the change in demand within each location based on the same 6 month period last year.

Location Rank Change
on Same Period
Last Year
Matching
Contract
IT Job Ads
Median
Daily Rate
Past 6 Months
Median Daily Rate
% Change
on Same Period
Last Year
Live
Jobs
Central London +24 65 £515 -1.90% 48
West London +9 14 £330 +10.00% 10
South London +3 11 £475 +11.76% 12
East London +5 3 £363 -19.44% 4
North London - 1 £510 - 1
SharePoint
England

SharePoint
Co-Occurring Skills & Capabilities in London by Category

The following tables expand on the one above by listing co-occurrences grouped by category. They cover the same employment type, locality and period, with up to 20 co-occurrences shown in each category:

Application Platforms
1 49 (16.44%) Microsoft Exchange
2 21 (7.05%) Confluence
3 9 (3.02%) HCL Notes
4 6 (2.01%) Moodle
5 5 (1.68%) CMS
6 3 (1.01%) Alfresco
7 2 (0.67%) Adobe Experience Manager
8 1 (0.34%) Apache Airflow
8 1 (0.34%) Drupal
8 1 (0.34%) IIS
8 1 (0.34%) Mendix
8 1 (0.34%) SharePoint 2010
8 1 (0.34%) SharePoint Server
8 1 (0.34%) Skype for Business
Applications
1 51 (17.11%) Microsoft Office
2 46 (15.44%) Microsoft Excel
3 26 (8.72%) Microsoft PowerPoint
4 18 (6.04%) MS Visio
5 14 (4.70%) Microsoft Project
6 2 (0.67%) InfoPath
6 2 (0.67%) Spreadsheet
6 2 (0.67%) Trello
7 1 (0.34%) Acrobat
7 1 (0.34%) Adobe Creative Suite
7 1 (0.34%) Notion
Business Applications
1 12 (4.03%) Remedy ITSM
2 5 (1.68%) Salesforce CRM
2 5 (1.68%) Workday HCM
3 4 (1.34%) Dynamics CRM
4 3 (1.01%) Oracle Financials
5 2 (0.67%) Oracle Payables
5 2 (0.67%) SAP S/4HANA
6 1 (0.34%) Oracle Applications
6 1 (0.34%) Oracle EBS
6 1 (0.34%) Oracle EBS R12
6 1 (0.34%) Oracle Procure-to-Pay
Cloud Services
1 141 (47.32%) Microsoft 365
2 104 (34.90%) Azure
3 84 (28.19%) Power Platform
4 67 (22.48%) Entra ID
5 63 (21.14%) OneDrive
6 60 (20.13%) Power Automate
7 52 (17.45%) PowerApps
8 19 (6.38%) Azure DevOps
9 18 (6.04%) Microsoft Copilot
10 16 (5.37%) Dynamics 365
11 15 (5.03%) Microsoft Purview
12 13 (4.36%) AWS
13 11 (3.69%) Copilot Studio
14 10 (3.36%) SaaS
15 9 (3.02%) Azure Logic Apps
15 9 (3.02%) GitHub
16 8 (2.68%) GCP
17 7 (2.35%) PaaS
18 6 (2.01%) ShareGate
19 5 (1.68%) Azure Sentinel
Communications & Networking
1 22 (7.38%) VPN
2 18 (6.04%) DNS
3 16 (5.37%) Firewall
4 15 (5.03%) WAN
5 14 (4.70%) LAN
6 13 (4.36%) DHCP
7 10 (3.36%) TCP/IP
8 7 (2.35%) Internet
9 6 (2.01%) SD-WAN
10 5 (1.68%) Intranet
10 5 (1.68%) WebEx
10 5 (1.68%) Wi-Fi
11 3 (1.01%) BGP
11 3 (1.01%) BIG-IP
11 3 (1.01%) F5 BIG-IP GTM
11 3 (1.01%) F5 BIG-IP LTM
11 3 (1.01%) Network Security
11 3 (1.01%) OSPF
12 2 (0.67%) Structured Cabling
12 2 (0.67%) VLAN
Database & Business Intelligence
1 47 (15.77%) Power BI
2 15 (5.03%) Metadata
3 8 (2.68%) Power Query
3 8 (2.68%) SQL Server
4 5 (1.68%) Tableau
5 4 (1.34%) Oracle Database
6 2 (0.67%) Data Lake
6 2 (0.67%) PostgreSQL
6 2 (0.67%) Relational Database
7 1 (0.34%) Azure SQL Database
7 1 (0.34%) Data Hub
7 1 (0.34%) Data Warehouse
7 1 (0.34%) EDRMS
7 1 (0.34%) MS Access
7 1 (0.34%) MySQL
7 1 (0.34%) Qlik Sense
7 1 (0.34%) QlikView
Development Applications
1 33 (11.07%) JIRA
2 6 (2.01%) Git
3 3 (1.01%) Bitbucket
3 3 (1.01%) Visual Website Optimizer
4 2 (0.67%) GitLab
4 2 (0.67%) Visual Studio
5 1 (0.34%) Artifactory
5 1 (0.34%) Cypress.io
5 1 (0.34%) gulp
5 1 (0.34%) Jenkins
5 1 (0.34%) ScriptRunner
5 1 (0.34%) TestRail
5 1 (0.34%) Visual Studio Code
5 1 (0.34%) webpack
5 1 (0.34%) Zephyr
General
1 124 (41.61%) Social Skills
2 82 (27.52%) Finance
3 34 (11.41%) Analytical Skills
4 27 (9.06%) Banking
4 27 (9.06%) Public Sector
5 13 (4.36%) Organisational Skills
6 11 (3.69%) Legal
7 9 (3.02%) Presentation Skills
7 9 (3.02%) Telecoms
8 6 (2.01%) Documentation Skills
9 5 (1.68%) Inclusion and Diversity
10 4 (1.34%) Financial Institution
10 4 (1.34%) Investment Banking
10 4 (1.34%) Local Government
11 3 (1.01%) Corporate Banking
11 3 (1.01%) Law
11 3 (1.01%) Marketing
11 3 (1.01%) Retail
12 2 (0.67%) Advertising
12 2 (0.67%) Front Office
Job Titles
1 50 (16.78%) Analyst
2 37 (12.42%) Developer
3 24 (8.05%) Consultant
4 17 (5.70%) Architect
5 16 (5.37%) Power Platform Developer
6 15 (5.03%) Administrator
6 15 (5.03%) Project Manager
6 15 (5.03%) Support Analyst
7 14 (4.70%) IT Support
8 13 (4.36%) Lead
8 13 (4.36%) SharePoint Analyst
9 12 (4.03%) Business Analyst
9 12 (4.03%) Senior
10 11 (3.69%) IT Engineer
10 11 (3.69%) Solutions Architect
10 11 (3.69%) Support Engineer
11 10 (3.36%) 2nd Line Support
11 10 (3.36%) Coordinator
11 10 (3.36%) SharePoint Developer
12 9 (3.02%) Operations Support Analyst
Libraries, Frameworks & Software Standards
1 18 (6.04%) Microsoft Graph
2 15 (5.03%) .NET
2 15 (5.03%) REST
3 14 (4.70%) HTML
4 9 (3.02%) CSS
5 8 (2.68%) HTML5 Canvas
5 8 (2.68%) SPFx
6 6 (2.01%) OAuth
7 5 (1.68%) JSON
7 5 (1.68%) React
7 5 (1.68%) RESTful
7 5 (1.68%) Web Services
8 4 (1.34%) EDI
8 4 (1.34%) Lightning Web Components
9 3 (1.01%) LangChain
9 3 (1.01%) Semantic Kernel
10 2 (0.67%) ADO
10 2 (0.67%) jQuery
10 2 (0.67%) Playwright
10 2 (0.67%) Software Packaging
Miscellaneous
1 16 (5.37%) Data Centre
1 16 (5.37%) Onboarding
2 11 (3.69%) Low-Code
2 11 (3.69%) Management Information System
3 7 (2.35%) Product Ownership
4 6 (2.01%) Taxonomies
5 5 (1.68%) Analytical Mindset
6 4 (1.34%) Derivative
6 4 (1.34%) Learning Management System
6 4 (1.34%) Virtual Team
6 4 (1.34%) Web Conferencing
7 3 (1.01%) AI Agents
7 3 (1.01%) Data Protection Act
7 3 (1.01%) e-Learning
7 3 (1.01%) Video Editing
7 3 (1.01%) VLE
8 2 (0.67%) Algorithms
8 2 (0.67%) Data Structures
8 2 (0.67%) Driving Licence
8 2 (0.67%) Legacy Systems
Operating Systems
1 51 (17.11%) Windows
2 19 (6.38%) Windows 10
3 11 (3.69%) Windows Server
4 8 (2.68%) Windows Server 2016
5 6 (2.01%) Apple iOS
5 6 (2.01%) Mac OS
5 6 (2.01%) Windows Server 2019
6 5 (1.68%) Android
7 4 (1.34%) Unix
8 2 (0.67%) VMS
9 1 (0.34%) Linux
9 1 (0.34%) Windows 7
Processes & Methodologies
1 60 (20.13%) Migration
2 53 (17.79%) Business Intelligence
3 50 (16.78%) Agile
4 48 (16.11%) ITIL
4 48 (16.11%) Problem-Solving
5 41 (13.76%) Project Management
6 37 (12.42%) Stakeholder Engagement
7 33 (11.07%) Stakeholder Management
8 30 (10.07%) Change Management
9 25 (8.39%) Continuous Improvement
10 24 (8.05%) DevOps
11 23 (7.72%) Project Delivery
12 22 (7.38%) Roadmaps
13 21 (7.05%) ITSM
14 20 (6.71%) Service Management
14 20 (6.71%) Workflow
15 19 (6.38%) AI
16 18 (6.04%) Document Management
17 17 (5.70%) Data Loss Prevention
17 17 (5.70%) User Experience
Programming Languages
1 47 (15.77%) PowerShell
2 23 (7.72%) SQL
3 19 (6.38%) C#
4 18 (6.04%) Python
5 17 (5.70%) JavaScript
6 5 (1.68%) TypeScript
7 4 (1.34%) Data Analysis Expressions
7 4 (1.34%) Formula Language
7 4 (1.34%) LotusScript
8 3 (1.01%) VBA
9 2 (0.67%) Korn
9 2 (0.67%) PL/SQL
10 1 (0.34%) Bicep
10 1 (0.34%) Java
10 1 (0.34%) Shell Script
10 1 (0.34%) VB
Qualifications
1 48 (16.11%) Degree
1 48 (16.11%) Security Cleared
2 41 (13.76%) SC Cleared
3 20 (6.71%) Microsoft Certification
4 13 (4.36%) PMP
5 12 (4.03%) PMI Certification
6 9 (3.02%) DV Cleared
7 8 (2.68%) ITIL Certification
8 7 (2.35%) Azure Certification
8 7 (2.35%) Computer Science Degree
9 4 (1.34%) CCIE
9 4 (1.34%) Cisco Certification
10 3 (1.01%) CCNP
10 3 (1.01%) CCSE
10 3 (1.01%) CISSP
10 3 (1.01%) DBS Check
10 3 (1.01%) JNCIE
10 3 (1.01%) JNCIP
11 2 (0.67%) ITIL Foundation Certificate
11 2 (0.67%) MRICS
Quality Assurance & Compliance
1 18 (6.04%) PMO
2 12 (4.03%) Accessibility
3 8 (2.68%) WCAG
4 7 (2.35%) NIST
4 7 (2.35%) QA
5 6 (2.01%) GDPR
6 5 (1.68%) ISO/IEC 27001
7 4 (1.34%) COBIT
7 4 (1.34%) Data Quality
8 2 (0.67%) Actionable Recommendations
8 2 (0.67%) HMG Security Policy Framework
8 2 (0.67%) ISO/IEC 20000
8 2 (0.67%) NIST 800
8 2 (0.67%) PCI DSS
8 2 (0.67%) SLA
9 1 (0.34%) Cyber Essentials
9 1 (0.34%) Cyber Essentials PLUS
9 1 (0.34%) GRC
9 1 (0.34%) ISO 31000
9 1 (0.34%) SEPA
System Software
1 75 (25.17%) Active Directory
2 3 (1.01%) BitLocker
3 2 (0.67%) Microsoft App-V
3 2 (0.67%) VMware Infrastructure
4 1 (0.34%) Hyper-V
4 1 (0.34%) Virtual Desktop
4 1 (0.34%) Virtual Servers
Systems Management
1 32 (10.74%) Microsoft Intune
2 19 (6.38%) SCCM
3 8 (2.68%) HP SiteScope
3 8 (2.68%) SCOM
3 8 (2.68%) Single Sign-On
3 8 (2.68%) Terraform
4 3 (1.01%) Ansible
4 3 (1.01%) Kubernetes
5 2 (0.67%) QRadar
6 1 (0.34%) FortiGate
6 1 (0.34%) RSA Archer
Vendors
1 184 (61.74%) Microsoft
2 25 (8.39%) ServiceNow
3 15 (5.03%) Remedy
4 13 (4.36%) Adobe
5 12 (4.03%) Salesforce
6 11 (3.69%) Cisco
7 9 (3.02%) Lotus
7 9 (3.02%) Oracle
8 8 (2.68%) Okta
8 8 (2.68%) Splunk
9 7 (2.35%) Google
9 7 (2.35%) OpenAI
9 7 (2.35%) SAP
10 6 (2.01%) Zscaler
11 5 (1.68%) Atlassian
11 5 (1.68%) Databricks
11 5 (1.68%) Workday
12 4 (1.34%) Apple
12 4 (1.34%) Citrix
13 3 (1.01%) Juniper