Red Hat Enterprise Linux Contracts in London

Red Hat Enterprise Linux (RHEL)
England > London

The table below provides summary statistics for contract job vacancies advertised in London requiring Red Hat Enterprise Linux skills. It includes a benchmarking guide to the contractor rates offered in vacancies that cited Red Hat Enterprise Linux over the 6 months leading up to 21 June 2025, comparing them to the same period in the previous two years.

6 months to
21 Jun 2025
Same period 2024 Same period 2023
Rank 267 311 209
Rank change year-on-year +44 -102 +43
Contract jobs citing Red Hat Enterprise Linux 78 86 310
As % of all contract jobs advertised in London 0.62% 0.49% 1.24%
As % of the Operating Systems category 5.20% 4.07% 8.38%
Number of daily rates quoted 47 63 247
10th Percentile £408 £352 £450
25th Percentile £440 £406 £536
Median daily rate (50th Percentile) £550 £510 £650
Median % change year-on-year +7.84% -21.54% +7.44%
75th Percentile £649 £603 £798
90th Percentile £715 £735 £828
England median daily rate £550 £525 £625
% change year-on-year +4.76% -16.00% +4.17%
Number of hourly rates quoted 0 0 1
10th Percentile - - -
25th Percentile - - £51.25
Median hourly rate - - £52.50
75th Percentile - - £53.75
90th Percentile - - -
England median hourly rate - £72.75 £52.50
% change year-on-year - +38.57% -25.00%

All Operating Systems
London

Red Hat Enterprise Linux falls under the Operating Systems category. For comparison with the information above, the following table provides summary statistics for all contract job vacancies requiring operating system skills in London.

Contract vacancies with a requirement for operating system skills 1,501 2,112 3,700
As % of all contract IT jobs advertised in London 11.97% 11.92% 14.76%
Number of daily rates quoted 1,038 1,479 2,680
10th Percentile £243 £213 £213
25th Percentile £363 £350 £405
Median daily rate (50th Percentile) £500 £500 £550
Median % change year-on-year - -9.09% -
75th Percentile £635 £619 £666
90th Percentile £738 £750 £775
England median daily rate £465 £475 £500
% change year-on-year -2.11% -5.00% -
Number of hourly rates quoted 31 68 61
10th Percentile £18.87 £15.19 £18.93
25th Percentile £19.73 £18.13 £22.75
Median hourly rate £24.00 £22.00 £50.00
Median % change year-on-year +9.09% -56.00% +109.12%
75th Percentile £25.20 £27.00 £64.50
90th Percentile £49.50 £60.00 £83.75
England median hourly rate £19.00 £24.18 £43.93
% change year-on-year -21.42% -44.96% +100.69%

Red Hat Enterprise Linux
Job Vacancy Trend in London

Job postings citing Red Hat Enterprise Linux as a proportion of all IT jobs advertised in London.
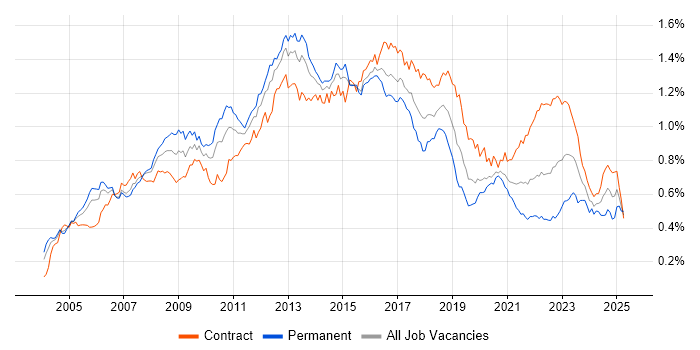
Job vacancy trend for Red Hat Enterprise Linux in London

Red Hat Enterprise Linux
Contractor Daily Rate Trend in London

3-month moving average daily rate quoted in jobs citing Red Hat Enterprise Linux in London.

Daily rate trend for Red Hat Enterprise Linux in London

Red Hat Enterprise Linux
Daily Rate Histogram in London

Daily rate distribution for jobs citing Red Hat Enterprise Linux in London over the 6 months to 21 June 2025.

Daily rate histogram for Red Hat Enterprise Linux in London

Red Hat Enterprise Linux
Contractor Hourly Rate Trend in London

3-month moving average hourly rates quoted in jobs citing Red Hat Enterprise Linux in London.

Hourly rate trend for Red Hat Enterprise Linux in London

Red Hat Enterprise Linux
Contract Job Locations in London

The table below looks at the demand and provides a guide to the median contractor rates quoted in IT jobs citing Red Hat Enterprise Linux within the London region over the 6 months to 21 June 2025. The 'Rank Change' column provides an indication of the change in demand within each location based on the same 6 month period last year.

Location Rank Change
on Same Period
Last Year
Matching
Contract
IT Job Ads
Median
Daily Rate
Past 6 Months
Median Daily Rate
% Change
on Same Period
Last Year
Live
Jobs
Central London +4 5 £625 +4.12% 25
South London - 3 £600 -
Red Hat Enterprise Linux
England

Red Hat Enterprise Linux
Co-occurring Skills and Capabilities in London by Category

The follow tables expand on the table above by listing co-occurrences grouped by category. The same employment type, locality and period is covered with up to 20 co-occurrences shown in each of the following categories:

Application Platforms
1 9 (11.54%) Confluence
2 7 (8.97%) Apache
3 4 (5.13%) Apache Spark
3 4 (5.13%) JBoss
4 3 (3.85%) WebSphere
5 2 (2.56%) nginx
5 2 (2.56%) Tomcat
6 1 (1.28%) IBM HTTP Server
6 1 (1.28%) Microsoft Exchange
6 1 (1.28%) Oracle SOA Suite
6 1 (1.28%) WebLogic
Cloud Services
1 25 (32.05%) Azure
2 20 (25.64%) AWS
3 11 (14.10%) GitHub
4 9 (11.54%) GCP
5 7 (8.97%) Azure Monitor
6 6 (7.69%) Azure DevOps
6 6 (7.69%) OpenShift
7 5 (6.41%) Amazon EC2
7 5 (6.41%) Amazon S3
8 4 (5.13%) AWS CloudFormation
9 3 (3.85%) AWS Lambda
9 3 (3.85%) Azure AKS
9 3 (3.85%) IaaS
9 3 (3.85%) Serverless
9 3 (3.85%) Virtual Private Cloud
10 2 (2.56%) Amazon CloudWatch
10 2 (2.56%) Amazon EMR
10 2 (2.56%) Amazon Kinesis
10 2 (2.56%) Nutanix
10 2 (2.56%) Slack
Communications & Networking
1 12 (15.38%) DNS
2 9 (11.54%) DHCP
3 5 (6.41%) NAS
3 5 (6.41%) SAN
4 4 (5.13%) TCP/IP
5 3 (3.85%) VPN
6 2 (2.56%) Firewall
6 2 (2.56%) HTTP
6 2 (2.56%) SSH
6 2 (2.56%) VLAN
6 2 (2.56%) VSAN
7 1 (1.28%) Broadband
7 1 (1.28%) Cisco Nexus
7 1 (1.28%) Internet
7 1 (1.28%) Kerberos
7 1 (1.28%) LAN
7 1 (1.28%) Multicast
7 1 (1.28%) Network Security
7 1 (1.28%) OpenLDAP
7 1 (1.28%) Wi-Fi
Database & Business Intelligence
1 8 (10.26%) SQL Server
2 7 (8.97%) MySQL
2 7 (8.97%) PostgreSQL
2 7 (8.97%) Relational Database
3 6 (7.69%) MongoDB
4 5 (6.41%) Elasticsearch
5 3 (3.85%) Big Data
5 3 (3.85%) MariaDB
5 3 (3.85%) Oracle Database
6 2 (2.56%) Apache Cassandra
6 2 (2.56%) Hadoop
6 2 (2.56%) NoSQL
6 2 (2.56%) Redis
7 1 (1.28%) Amazon Redshift
7 1 (1.28%) DB2
7 1 (1.28%) NonStop SQL
7 1 (1.28%) Oracle Exadata
7 1 (1.28%) Oracle Reports
7 1 (1.28%) RDBMS
7 1 (1.28%) Sybase ASE
Development Applications
1 14 (17.95%) Jenkins
2 13 (16.67%) JIRA
3 12 (15.38%) Git
4 9 (11.54%) Sonatype Nexus
5 7 (8.97%) GitLab
6 5 (6.41%) Artifactory
6 5 (6.41%) SonarQube
7 4 (5.13%) Bitbucket
7 4 (5.13%) Gradle
7 4 (5.13%) Maven
8 3 (3.85%) Cucumber
9 2 (2.56%) Ant
9 2 (2.56%) git-flow
10 1 (1.28%) Jasmine
10 1 (1.28%) JUnit
10 1 (1.28%) TeamCity
10 1 (1.28%) Vagrant
General
1 26 (33.33%) Finance
2 21 (26.92%) Social Skills
3 12 (15.38%) Banking
4 6 (7.69%) Public Sector
5 3 (3.85%) Financial Institution
5 3 (3.85%) Front Office
5 3 (3.85%) Law
5 3 (3.85%) Legal
6 2 (2.56%) Back Office
6 2 (2.56%) Documentation Skills
7 1 (1.28%) Analytical Skills
7 1 (1.28%) French Language
7 1 (1.28%) Military
7 1 (1.28%) Presentation Skills
Job Titles
1 20 (25.64%) Linux Engineer
2 10 (12.82%) Architect
2 10 (12.82%) Senior
3 9 (11.54%) Azure Engineer
4 8 (10.26%) DevOps Engineer
5 6 (7.69%) Consultant
6 5 (6.41%) Cloud Engineer
6 5 (6.41%) Developer
6 5 (6.41%) Principal Engineer
6 5 (6.41%) Systems Engineer
7 4 (5.13%) Administrator
7 4 (5.13%) AWS DevOps
7 4 (5.13%) Java Developer
7 4 (5.13%) Lead
7 4 (5.13%) Linux Systems Engineer
7 4 (5.13%) Principal Systems Engineer
7 4 (5.13%) Senior Developer
7 4 (5.13%) Senior Java Developer
7 4 (5.13%) Solutions Architect
8 3 (3.85%) Technical Engineer
Libraries, Frameworks & Software Standards
1 6 (7.69%) Elastic Stack
2 5 (6.41%) Kafka
2 5 (6.41%) RabbitMQ
2 5 (6.41%) Spring
2 5 (6.41%) Spring Boot
3 4 (5.13%) HTML
3 4 (5.13%) XML
4 3 (3.85%) .NET
4 3 (3.85%) Apache NiFi
4 3 (3.85%) ASP.NET
4 3 (3.85%) ASP.NET Core
4 3 (3.85%) CSS
4 3 (3.85%) JSON
4 3 (3.85%) Middleware
4 3 (3.85%) RESTful
5 2 (2.56%) Murex MxML
5 2 (2.56%) Node.js
5 2 (2.56%) OpenTelemetry
5 2 (2.56%) Spring Batch
5 2 (2.56%) Spring Security
Miscellaneous
1 6 (7.69%) Private Cloud
2 5 (6.41%) Data Centre
2 5 (6.41%) Public Cloud
3 4 (5.13%) Data Protection Act
3 4 (5.13%) Enterprise Storage
3 4 (5.13%) Management Information System
3 4 (5.13%) Replication
4 3 (3.85%) Cloud Native
4 3 (3.85%) EMC VMAX
4 3 (3.85%) Hedge funds
4 3 (3.85%) Hybrid Cloud
5 2 (2.56%) Clustering
5 2 (2.56%) Credit Derivative
5 2 (2.56%) Derivative
5 2 (2.56%) Fixed Income
5 2 (2.56%) Interest Rate Derivative
5 2 (2.56%) Legacy Systems
6 1 (1.28%) Legacy Applications
6 1 (1.28%) Online Banking
6 1 (1.28%) Tandem
Operating Systems
1 78 (100.00%) Linux
2 19 (24.36%) Windows
3 17 (21.79%) Unix
4 12 (15.38%) CentOS
5 8 (10.26%) Rocky
5 8 (10.26%) Windows Server
6 5 (6.41%) Solaris
6 5 (6.41%) Ubuntu
7 3 (3.85%) AIX
7 3 (3.85%) Oracle Linux
8 2 (2.56%) SUSE
9 1 (1.28%) Amazon Linux
9 1 (1.28%) Debian
9 1 (1.28%) HPUX
9 1 (1.28%) Windows 10
9 1 (1.28%) Windows 7
Processes & Methodologies
1 27 (34.62%) DevOps
2 23 (29.49%) CI/CD
3 17 (21.79%) Migration
4 15 (19.23%) Infrastructure as Code
4 15 (19.23%) Problem-Solving
5 14 (17.95%) Containerisation
6 12 (15.38%) Configuration Management
6 12 (15.38%) High Availability
7 9 (11.54%) Agile
8 8 (10.26%) Observability
8 8 (10.26%) Performance Tuning
9 7 (8.97%) Microservices
9 7 (8.97%) Storage Management
10 6 (7.69%) Data Protection
10 6 (7.69%) Infrastructure Automation
10 6 (7.69%) Low Latency
11 5 (6.41%) Continuous Integration
11 5 (6.41%) Deployment Automation
11 5 (6.41%) Project Management
11 5 (6.41%) TDD
Programming Languages
1 25 (32.05%) Python
2 22 (28.21%) Bash
3 8 (10.26%) Java
3 8 (10.26%) Shell Script
3 8 (10.26%) SQL
4 5 (6.41%) C#
4 5 (6.41%) JavaScript
5 4 (5.13%) Perl
5 4 (5.13%) PowerShell
6 3 (3.85%) Groovy
6 3 (3.85%) Ruby
7 2 (2.56%) C++
8 1 (1.28%) AWK
8 1 (1.28%) C
8 1 (1.28%) COBOL
8 1 (1.28%) PHP
8 1 (1.28%) sed
Qualifications
1 16 (20.51%) SC Cleared
1 16 (20.51%) Security Cleared
2 4 (5.13%) Degree
3 2 (2.56%) RHCE
3 2 (2.56%) RHCSA
4 1 (1.28%) AWS Certification
4 1 (1.28%) AWS Certified Solutions Architect
4 1 (1.28%) Azure Certification
4 1 (1.28%) CASP
4 1 (1.28%) CISA
4 1 (1.28%) CISM
4 1 (1.28%) CISSP
4 1 (1.28%) DV Cleared
4 1 (1.28%) VMware Certified Professional (VCP)
Quality Assurance & Compliance
1 5 (6.41%) PCI DSS
2 2 (2.56%) GDPR
2 2 (2.56%) HIPAA
2 2 (2.56%) NIST
2 2 (2.56%) QA
2 2 (2.56%) Sarbanes-Oxley
3 1 (1.28%) ISO 15022
3 1 (1.28%) ISO 20022
System Software
1 26 (33.33%) Docker
2 20 (25.64%) VMware Infrastructure
3 7 (8.97%) Active Directory
4 6 (7.69%) vSphere
5 4 (5.13%) Veritas Cluster Server
6 3 (3.85%) vCloud
6 3 (3.85%) VMware ESXi
6 3 (3.85%) VMware Workstation
7 2 (2.56%) Virtual Machines
8 1 (1.28%) GPFS
8 1 (1.28%) Microsoft App-V
8 1 (1.28%) NFS
8 1 (1.28%) Oracle RAC
8 1 (1.28%) Virtual Desktop
8 1 (1.28%) VirtualBox
Systems Management
1 32 (41.03%) Kubernetes
2 26 (33.33%) Ansible
3 23 (29.49%) Terraform
4 16 (20.51%) Puppet
5 5 (6.41%) Podman
6 4 (5.13%) Packer
6 4 (5.13%) Progress Chef
6 4 (5.13%) Red Hat Satellite
7 3 (3.85%) Grafana
7 3 (3.85%) Kibana
7 3 (3.85%) Nagios
7 3 (3.85%) Prometheus
8 2 (2.56%) Argo
8 2 (2.56%) Failover Clustering
9 1 (1.28%) Graylog
9 1 (1.28%) HAProxy
9 1 (1.28%) Icinga
9 1 (1.28%) PowerCLI
9 1 (1.28%) Salt
9 1 (1.28%) vRealize Orchestrator
Vendors
1 39 (50.00%) Red Hat
2 23 (29.49%) VMware
3 13 (16.67%) Oracle
4 9 (11.54%) ServiceNow
5 7 (8.97%) Microsoft
6 6 (7.69%) Splunk
7 4 (5.13%) EMC
7 4 (5.13%) Google
7 4 (5.13%) IBM
7 4 (5.13%) Veritas
8 3 (3.85%) AppDynamics
8 3 (3.85%) Cisco
8 3 (3.85%) NetApp
8 3 (3.85%) SolarWinds
8 3 (3.85%) Sybase
9 2 (2.56%) Bloomberg
9 2 (2.56%) Murex
9 2 (2.56%) Tenable
10 1 (1.28%) Remedy
10 1 (1.28%) Serena