VMware Contracts in London

VMware
England > London

The table below provides summary statistics for contract job vacancies advertised in London requiring knowledge or experience of VMware products and/or services. It includes a benchmarking guide to contractor rates offered in vacancies that cited VMware over the 6 months leading up to 1 May 2025, comparing them to the same period in the previous two years.

The figures below represent the IT contractor job market in general and are not representative of contractor rates within VMware, Inc.

6 months to
1 May 2025
Same period 2024 Same period 2023
Rank 158 125 119
Rank change year-on-year -33 -6 0
Contract jobs citing VMware 219 336 586
As % of all contract jobs advertised in London 1.75% 1.88% 2.17%
As % of the Vendors category 3.85% 4.65% 5.58%
Number of daily rates quoted 148 212 440
10th Percentile £313 £300 £315
25th Percentile £417 £400 £427
Median daily rate (50th Percentile) £525 £500 £542
Median % change year-on-year +5.00% -7.66% +3.14%
75th Percentile £613 £555 £638
90th Percentile £679 £650 £700
England median daily rate £550 £500 £525
% change year-on-year +10.00% -4.76% +10.53%
Number of hourly rates quoted 0 11 3
10th Percentile - £22.08 £54.91
25th Percentile - £22.19 £57.83
Median hourly rate - £23.80 £62.68
Median % change year-on-year - -62.03% +39.29%
75th Percentile - £71.25 £71.34
90th Percentile - - £76.54
England median hourly rate £72.50 £46.18 £63.00
% change year-on-year +56.99% -26.70% +76.84%

All Vendors
London

VMware falls under the Vendor Products and Services category. For comparison with the information above, the following table provides summary statistics for all contract job vacancies requiring knowledge or experience of all vendor products and services in London.

Contract vacancies with a requirement for knowledge or experience of vendor products and services 5,695 7,227 10,507
As % of all contract IT jobs advertised in London 45.39% 40.53% 38.87%
Number of daily rates quoted 3,736 4,950 7,441
10th Percentile £325 £300 £325
25th Percentile £425 £425 £450
Median daily rate (50th Percentile) £550 £549 £563
Median % change year-on-year +0.23% -2.44% +2.27%
75th Percentile £653 £663 £688
90th Percentile £775 £775 £798
England median daily rate £525 £518 £538
% change year-on-year +1.30% -3.58% +2.38%
Number of hourly rates quoted 92 138 127
10th Percentile £15.91 £13.86 £16.28
25th Percentile £22.27 £17.00 £21.00
Median hourly rate £29.00 £23.99 £30.75
Median % change year-on-year +20.88% -21.98% -12.14%
75th Percentile £51.20 £36.56 £57.00
90th Percentile £67.25 £64.13 £70.00
England median hourly rate £27.13 £22.50 £39.55
% change year-on-year +20.56% -43.11% +88.33%

VMware
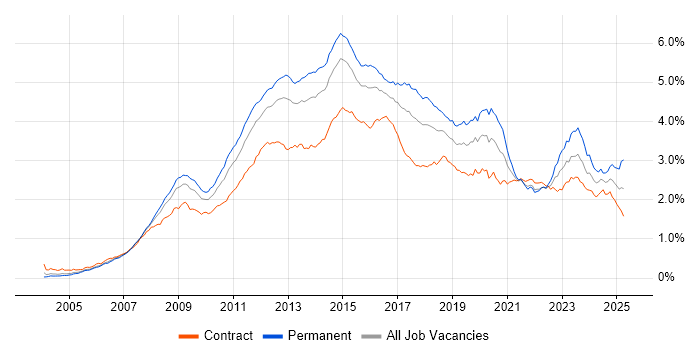
Job Vacancy Trend in London

Job postings citing VMware as a proportion of all IT jobs advertised in London.

Job vacancy trend for VMware in London

VMware
Contractor Daily Rate Trend in London

3-month moving average daily rate quoted in jobs citing VMware in London.

Daily rate trend for VMware in London

VMware
Daily Rate Histogram in London

Daily rate distribution for jobs citing VMware in London over the 6 months to 1 May 2025.

Daily rate histogram for VMware in London

VMware
Contractor Hourly Rate Trend in London

3-month moving average hourly rates quoted in jobs citing VMware in London.

Hourly rate trend for VMware in London

VMware
Contract Job Locations in London

The table below looks at the demand and provides a guide to the median contractor rates quoted in IT jobs citing VMware within the London region over the 6 months to 1 May 2025. The 'Rank Change' column provides an indication of the change in demand within each location based on the same 6 month period last year.

Location Rank Change
on Same Period
Last Year
Matching
Contract
IT Job Ads
Median
Daily Rate
Past 6 Months
Median Daily Rate
% Change
on Same Period
Last Year
Live
Jobs
Central London -6 28 £593 +31.67% 41
West London +16 10 £400 -20.00% 9
South London +9 5 £525 +21.39% 1
East London +6 3 £245 -44.32% 6
North London -3 3 £285 +14.00% 1
VMware
England

VMware
Co-occurring Skills and Capabilities in London by Category

The follow tables expand on the table above by listing co-occurrences grouped by category. The same employment type, locality and period is covered with up to 20 co-occurrences shown in each of the following categories:

Application Platforms
1 25 (11.42%) SharePoint
2 21 (9.59%) Microsoft Exchange
3 7 (3.20%) Confluence
3 7 (3.20%) OpenStack
4 3 (1.37%) Apache
4 3 (1.37%) Skype for Business
5 2 (0.91%) IIS
5 2 (0.91%) nginx
5 2 (0.91%) Tomcat
6 1 (0.46%) Apache Airflow
6 1 (0.46%) CMS
6 1 (0.46%) JBoss
6 1 (0.46%) Jupyter
Applications
1 12 (5.48%) Microsoft Office
2 1 (0.46%) Weka
Cloud Services
1 82 (37.44%) Azure
2 53 (24.20%) AWS
3 46 (21.00%) Microsoft 365
4 22 (10.05%) Entra ID
5 18 (8.22%) GitHub
6 16 (7.31%) GCP
6 16 (7.31%) Nutanix
7 13 (5.94%) IaaS
7 13 (5.94%) OpenShift
8 9 (4.11%) Azure Stack
8 9 (4.11%) OneDrive
9 6 (2.74%) Amazon EC2
9 6 (2.74%) PaaS
9 6 (2.74%) SaaS
10 5 (2.28%) Azure DevOps
10 5 (2.28%) Cloud Computing
10 5 (2.28%) Rubrik
11 3 (1.37%) Azure ExpressRoute
11 3 (1.37%) Mimecast
12 2 (0.91%) Amazon CloudWatch
Communications & Networking
1 45 (20.55%) Firewall
2 38 (17.35%) DNS
3 30 (13.70%) TCP/IP
4 22 (10.05%) DHCP
5 19 (8.68%) Network Security
6 18 (8.22%) VPN
7 17 (7.76%) Wi-Fi
8 14 (6.39%) SAN
9 13 (5.94%) NAS
10 12 (5.48%) VLAN
11 11 (5.02%) VSAN
11 11 (5.02%) WAN
12 10 (4.57%) LAN
13 7 (3.20%) VoIP
14 6 (2.74%) BGP
14 6 (2.74%) OSPF
15 5 (2.28%) Cisco IOS
15 5 (2.28%) Remote Desktop
15 5 (2.28%) Software-Defined Networking
15 5 (2.28%) SSH
Database & Business Intelligence
1 21 (9.59%) SQL Server
2 8 (3.65%) Elasticsearch
3 6 (2.74%) Amazon RDS
3 6 (2.74%) NoSQL
4 5 (2.28%) Big Data
4 5 (2.28%) Oracle Database
5 4 (1.83%) Data Warehouse
5 4 (1.83%) MongoDB
5 4 (1.83%) PostgreSQL
5 4 (1.83%) Relational Database
6 3 (1.37%) Amazon Aurora
6 3 (1.37%) Couchbase
6 3 (1.37%) OLTP
7 2 (0.91%) Hadoop
7 2 (0.91%) MariaDB
7 2 (0.91%) MySQL
7 2 (0.91%) Power BI
7 2 (0.91%) Sybase ASE
8 1 (0.46%) Azure SQL Database
8 1 (0.46%) Oracle Database 11g
Development Applications
1 16 (7.31%) Git
2 11 (5.02%) JIRA
3 9 (4.11%) TeamCity
4 8 (3.65%) Subversion
5 6 (2.74%) GitLab
5 6 (2.74%) Jenkins
6 5 (2.28%) Sonatype Nexus
7 3 (1.37%) Bitbucket
7 3 (1.37%) SonarQube
8 1 (0.46%) Serena SBM
General
1 58 (26.48%) Social Skills
2 52 (23.74%) Finance
3 17 (7.76%) Public Sector
3 17 (7.76%) Telecoms
4 14 (6.39%) Banking
5 10 (4.57%) Analytical Skills
6 8 (3.65%) Inclusion and Diversity
7 6 (2.74%) Documentation Skills
7 6 (2.74%) Legal
8 4 (1.83%) Manufacturing
8 4 (1.83%) Marketing
9 3 (1.37%) Electronics
9 3 (1.37%) Law
9 3 (1.37%) Organisational Skills
10 2 (0.91%) Financial Institution
10 2 (0.91%) Local Government
11 1 (0.46%) Back Office
11 1 (0.46%) Investment Banking
11 1 (0.46%) Presentation Skills
11 1 (0.46%) Retail
Job Titles
1 43 (19.63%) Infrastructure Engineer
2 27 (12.33%) Architect
3 23 (10.50%) Consultant
4 21 (9.59%) VMware Engineer
5 20 (9.13%) Senior
6 19 (8.68%) Network Engineer
7 14 (6.39%) Linux Engineer
8 13 (5.94%) Administrator
9 12 (5.48%) Systems Engineer
10 11 (5.02%) Infrastructure Architect
11 9 (4.11%) Cloud Engineer
11 9 (4.11%) Lead
12 8 (3.65%) Analyst
12 8 (3.65%) Linux Administrator
12 8 (3.65%) Support Engineer
12 8 (3.65%) VMware Infrastructure Engineer
12 8 (3.65%) Windows Engineer
13 7 (3.20%) Network Infrastructure Engineer
13 7 (3.20%) Senior Infrastructure Engineer
13 7 (3.20%) Senior Network Engineer
Libraries, Frameworks & Software Standards
1 7 (3.20%) REST
2 6 (2.74%) .NET
3 5 (2.28%) ASP.NET
4 4 (1.83%) CSS
4 4 (1.83%) HTML
5 3 (1.37%) Apache NiFi
5 3 (1.37%) ASP.NET Core
5 3 (1.37%) Elastic Stack
5 3 (1.37%) JSON
5 3 (1.37%) Kafka
5 3 (1.37%) LDAP
5 3 (1.37%) RabbitMQ
5 3 (1.37%) XML
6 2 (0.91%) .NET Framework
6 2 (0.91%) Node.js
6 2 (0.91%) React
7 1 (0.46%) EDI
7 1 (0.46%) Middleware
7 1 (0.46%) RESTful
Miscellaneous
1 27 (12.33%) Data Centre
2 15 (6.85%) Replication
3 14 (6.39%) Clustering
3 14 (6.39%) Private Cloud
4 12 (5.48%) Video Conferencing
5 11 (5.02%) Public Cloud
6 8 (3.65%) PKI
7 7 (3.20%) Data Protection Act
7 7 (3.20%) Hybrid Cloud
8 6 (2.74%) Enterprise Storage
9 3 (1.37%) Cyber Threat
9 3 (1.37%) EMC VMAX
9 3 (1.37%) Enterprise Software
9 3 (1.37%) iPad
9 3 (1.37%) Linux Command Line
9 3 (1.37%) Onboarding
9 3 (1.37%) Operational Technology
10 2 (0.91%) Self-Motivation
10 2 (0.91%) Team-Oriented Environment
10 2 (0.91%) Virtual Team
Operating Systems
1 107 (48.86%) Windows
2 69 (31.51%) Linux
3 64 (29.22%) Windows Server
4 27 (12.33%) Windows 10
5 21 (9.59%) Red Hat Enterprise Linux
6 9 (4.11%) Solaris
6 9 (4.11%) Unix
7 8 (3.65%) CentOS
7 8 (3.65%) Windows Server 2016
7 8 (3.65%) Windows Server 2019
8 4 (1.83%) Apple iOS
8 4 (1.83%) Ubuntu
9 3 (1.37%) Android
9 3 (1.37%) VMS
10 2 (0.91%) Mac OS
10 2 (0.91%) Rocky
10 2 (0.91%) SUSE
10 2 (0.91%) Windows Server 2003
10 2 (0.91%) Windows Server 2012
11 1 (0.46%) Oracle Linux
Processes & Methodologies
1 50 (22.83%) Infrastructure Engineering
2 47 (21.46%) Problem-Solving
3 34 (15.53%) Migration
4 31 (14.16%) DevOps
5 28 (12.79%) High Availability
6 23 (10.50%) Disaster Recovery
7 21 (9.59%) Configuration Management
8 19 (8.68%) ITIL
9 18 (8.22%) ITSM
10 17 (7.76%) Containerisation
10 17 (7.76%) Roadmaps
11 15 (6.85%) CI/CD
11 15 (6.85%) Infrastructure as Code
12 14 (6.39%) Service Delivery
12 14 (6.39%) Storage Management
13 13 (5.94%) Agile
13 13 (5.94%) Cybersecurity
13 13 (5.94%) Network Virtualisation
13 13 (5.94%) Performance Tuning
14 12 (5.48%) Task Automation
Programming Languages
1 50 (22.83%) Python
2 42 (19.18%) PowerShell
3 26 (11.87%) SQL
4 25 (11.42%) Bash
5 13 (5.94%) Perl
6 8 (3.65%) Java
6 8 (3.65%) JavaScript
7 7 (3.20%) C#
8 3 (1.37%) Scala
9 2 (0.91%) VB
9 2 (0.91%) VBScript
10 1 (0.46%) ActionScript
10 1 (0.46%) ActionScript 2.0
10 1 (0.46%) C
10 1 (0.46%) PL/SQL
10 1 (0.46%) Ruby
10 1 (0.46%) T-SQL
Qualifications
1 44 (20.09%) Security Cleared
2 30 (13.70%) SC Cleared
3 14 (6.39%) DV Cleared
4 12 (5.48%) Cisco Certification
5 9 (4.11%) CCIE
5 9 (4.11%) CCNP
6 7 (3.20%) Degree
7 6 (2.74%) VCAP
8 5 (2.28%) AWS Certification
8 5 (2.28%) VMware Certified Professional (VCP)
9 4 (1.83%) RHCSA
10 3 (1.37%) CCNA
10 3 (1.37%) Microsoft Certification
10 3 (1.37%) PRINCE2 Certification
11 2 (0.91%) AWS Certified Solutions Architect
11 2 (0.91%) Azure Certification
11 2 (0.91%) CCIE Data Center
11 2 (0.91%) Computer Science Degree
12 1 (0.46%) A+ Certification
12 1 (0.46%) RHCE
Quality Assurance & Compliance
1 13 (5.94%) GDPR
2 8 (3.65%) Sarbanes-Oxley
3 6 (2.74%) SLA
4 5 (2.28%) NIST
5 3 (1.37%) Government Security Classifications
5 3 (1.37%) HIPAA
5 3 (1.37%) HMG Security Policy Framework
5 3 (1.37%) ISO/IEC 27001
5 3 (1.37%) QA
6 2 (0.91%) Accessibility
6 2 (0.91%) PCI DSS
7 1 (0.46%) Cyber Essentials
7 1 (0.46%) Cyber Essentials PLUS
7 1 (0.46%) PMO
System Software
1 145 (66.21%) VMware Infrastructure
2 76 (34.70%) Active Directory
3 29 (13.24%) VMware ESXi
3 29 (13.24%) vSphere
4 22 (10.05%) Docker
5 20 (9.13%) VMware NSX
6 17 (7.76%) Hyper-V
7 8 (3.65%) Virtual Desktop
8 5 (2.28%) Virtual Machines
8 5 (2.28%) VMware Workstation
9 4 (1.83%) BitLocker
9 4 (1.83%) NFS
10 3 (1.37%) FreeRADIUS
10 3 (1.37%) iptables
10 3 (1.37%) Microsoft App-V
10 3 (1.37%) vCloud
10 3 (1.37%) Veritas Cluster Server
10 3 (1.37%) Veritas File System
10 3 (1.37%) Veritas Volume Manager
11 2 (0.91%) KVM
Systems Management
1 46 (21.00%) Ansible
2 33 (15.07%) Kubernetes
3 23 (10.50%) Terraform
4 19 (8.68%) SCCM
5 14 (6.39%) Microsoft Intune
6 11 (5.02%) Progress Chef
6 11 (5.02%) Puppet
6 11 (5.02%) Red Hat Satellite
7 9 (4.11%) VxRail
8 8 (3.65%) QRadar
9 7 (3.20%) Nagios
9 7 (3.20%) Tivoli
9 7 (3.20%) vCenter Server
10 6 (2.74%) EMC NetWorker
10 6 (2.74%) PowerCLI
10 6 (2.74%) Tivoli Storage Manager
10 6 (2.74%) vRealize
11 5 (2.28%) Netcool
11 5 (2.28%) Proxmox
12 4 (1.83%) ZABBIX
Vendors
1 67 (30.59%) Microsoft
2 50 (22.83%) Cisco
3 37 (16.89%) Red Hat
4 22 (10.05%) Splunk
5 20 (9.13%) EMC
6 17 (7.76%) Oracle
7 16 (7.31%) ServiceNow
8 15 (6.85%) Citrix
9 13 (5.94%) SolarWinds
10 10 (4.57%) CyberArk
10 10 (4.57%) NetApp
11 9 (4.11%) Fortinet
11 9 (4.11%) Meraki
11 9 (4.11%) Qualys
12 8 (3.65%) Google
12 8 (3.65%) IBM
13 7 (3.20%) CheckPoint
13 7 (3.20%) F5
13 7 (3.20%) Nokia
13 7 (3.20%) Veritas